

Sleek market research for the curious
All-in-one platform for investment research, from screening to charting, with institutional depth and none of the clutter.
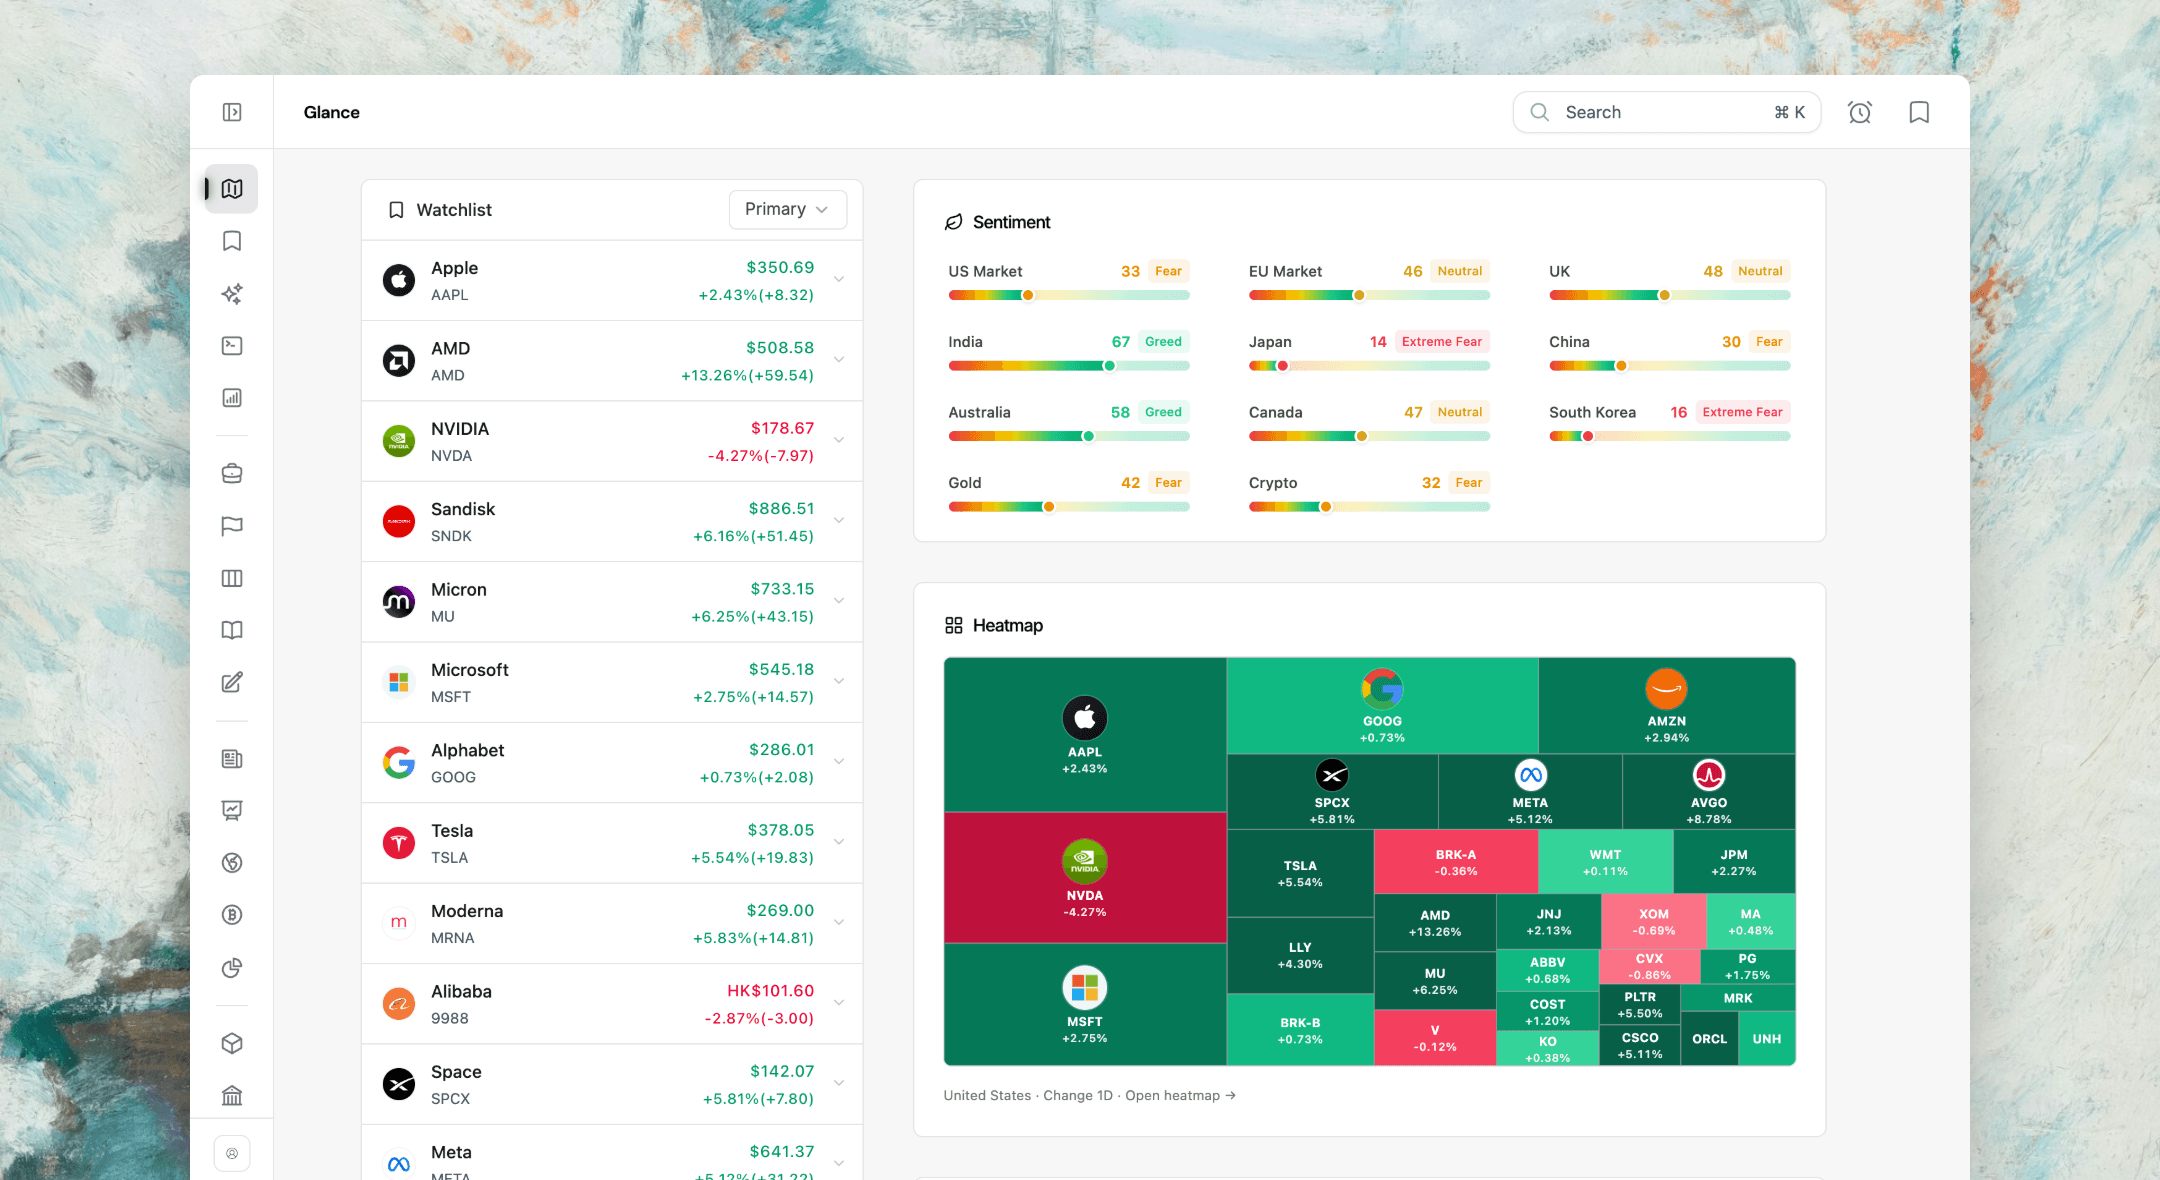
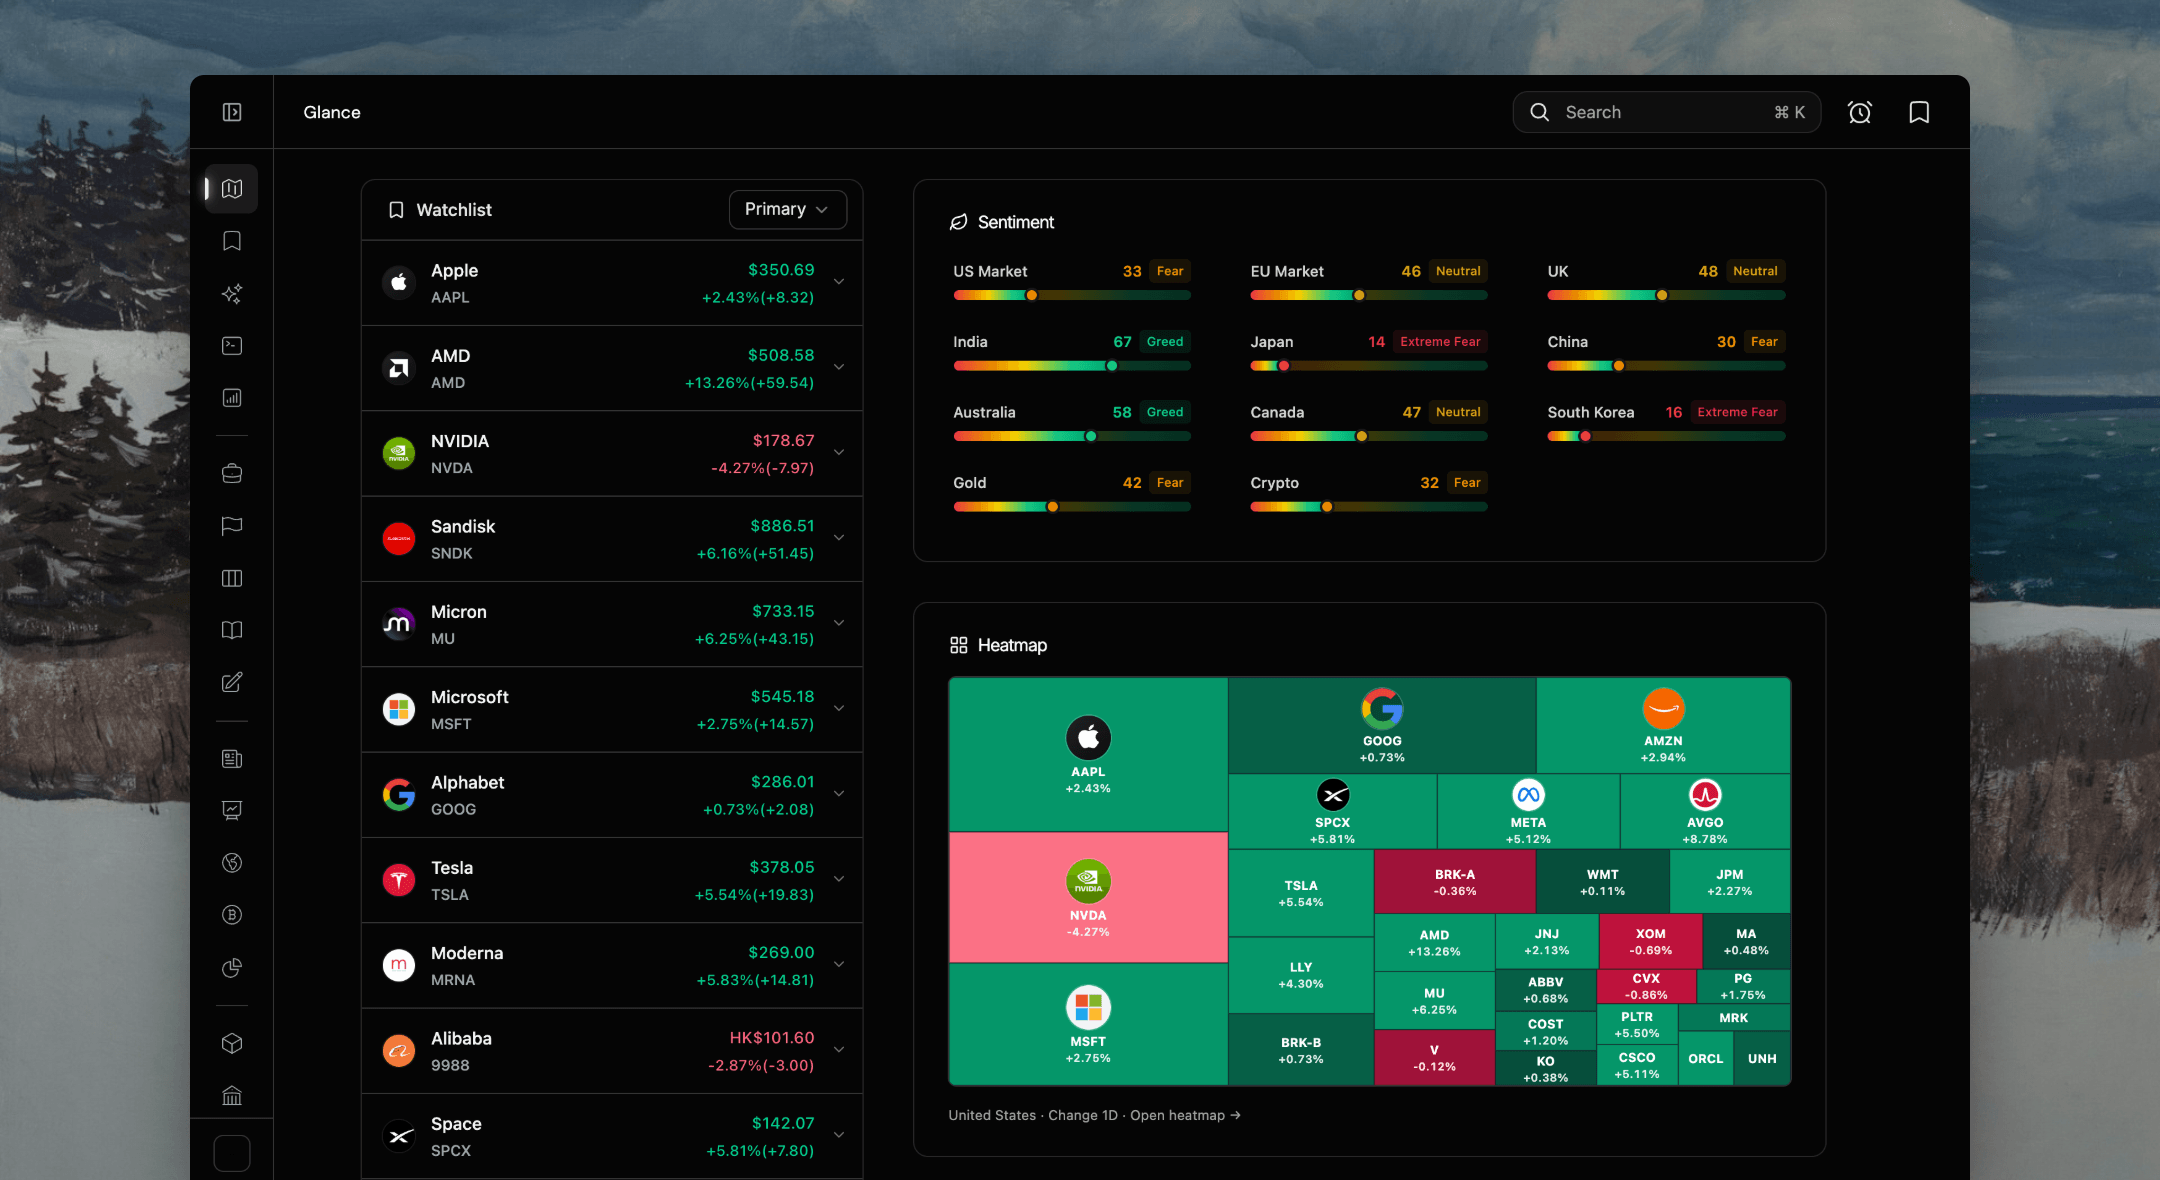
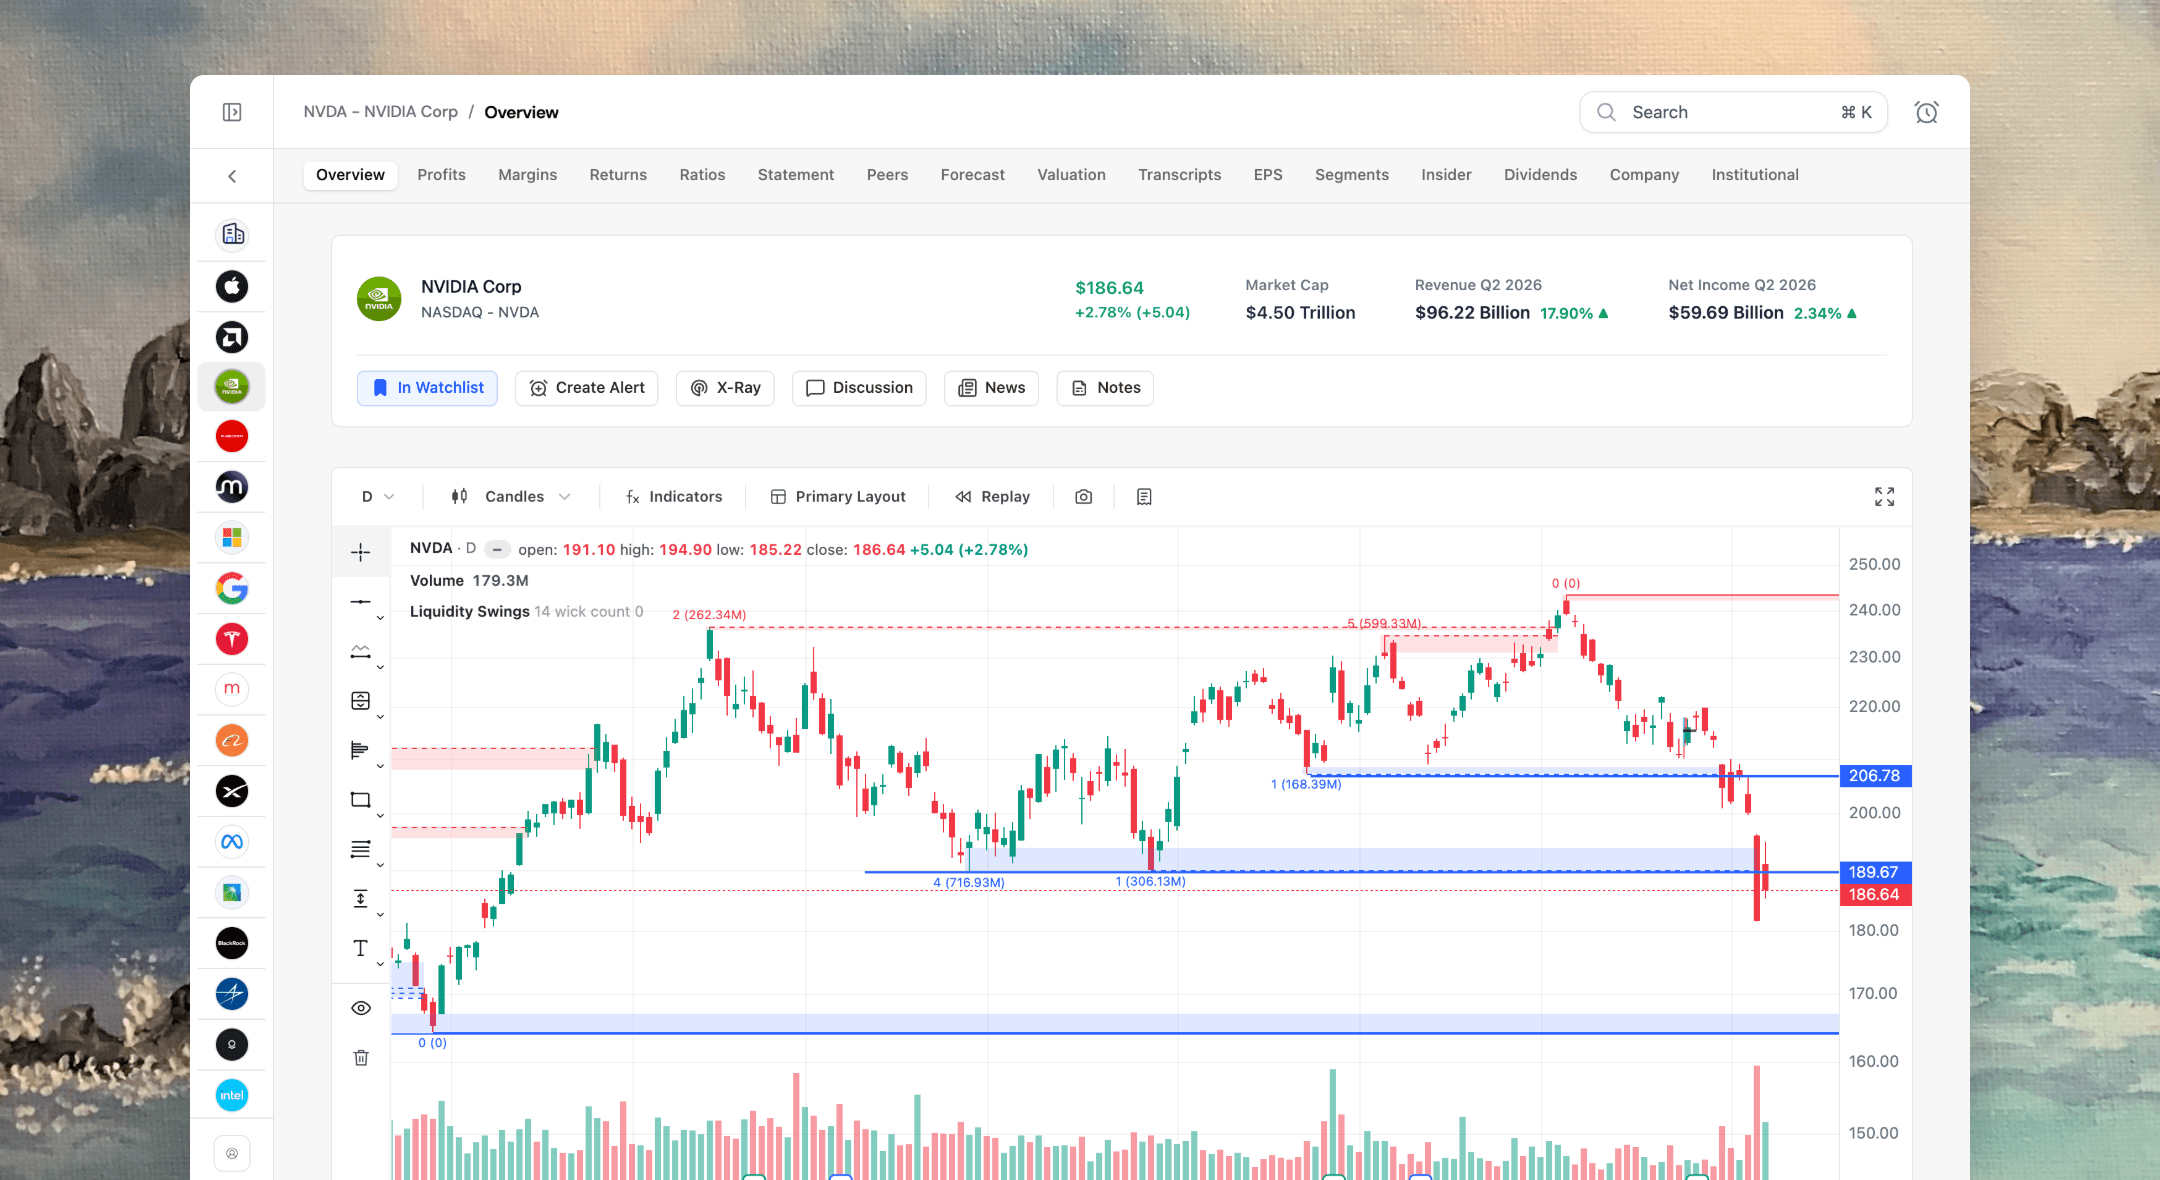
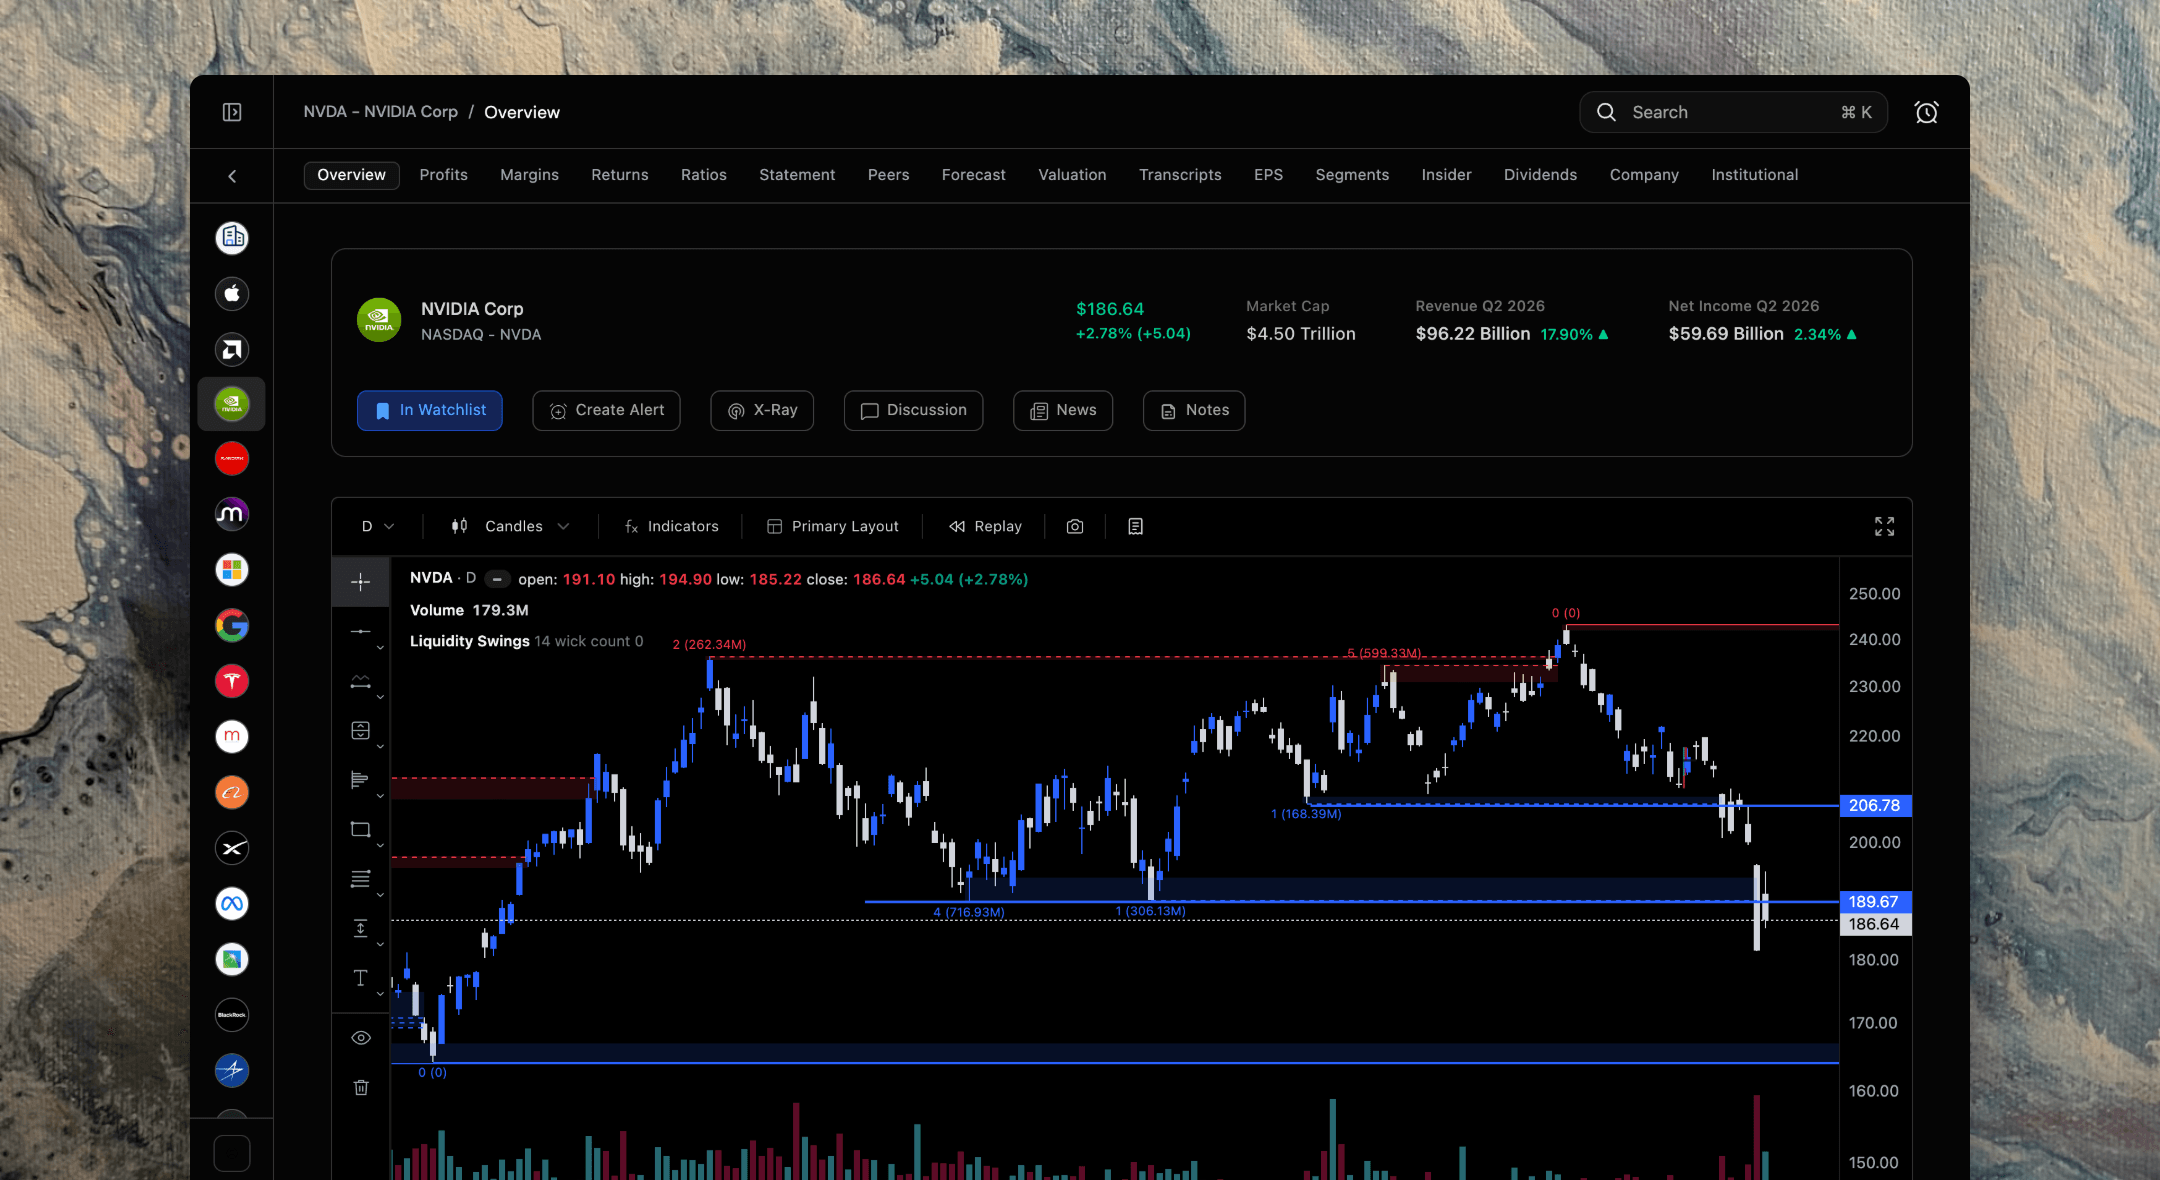
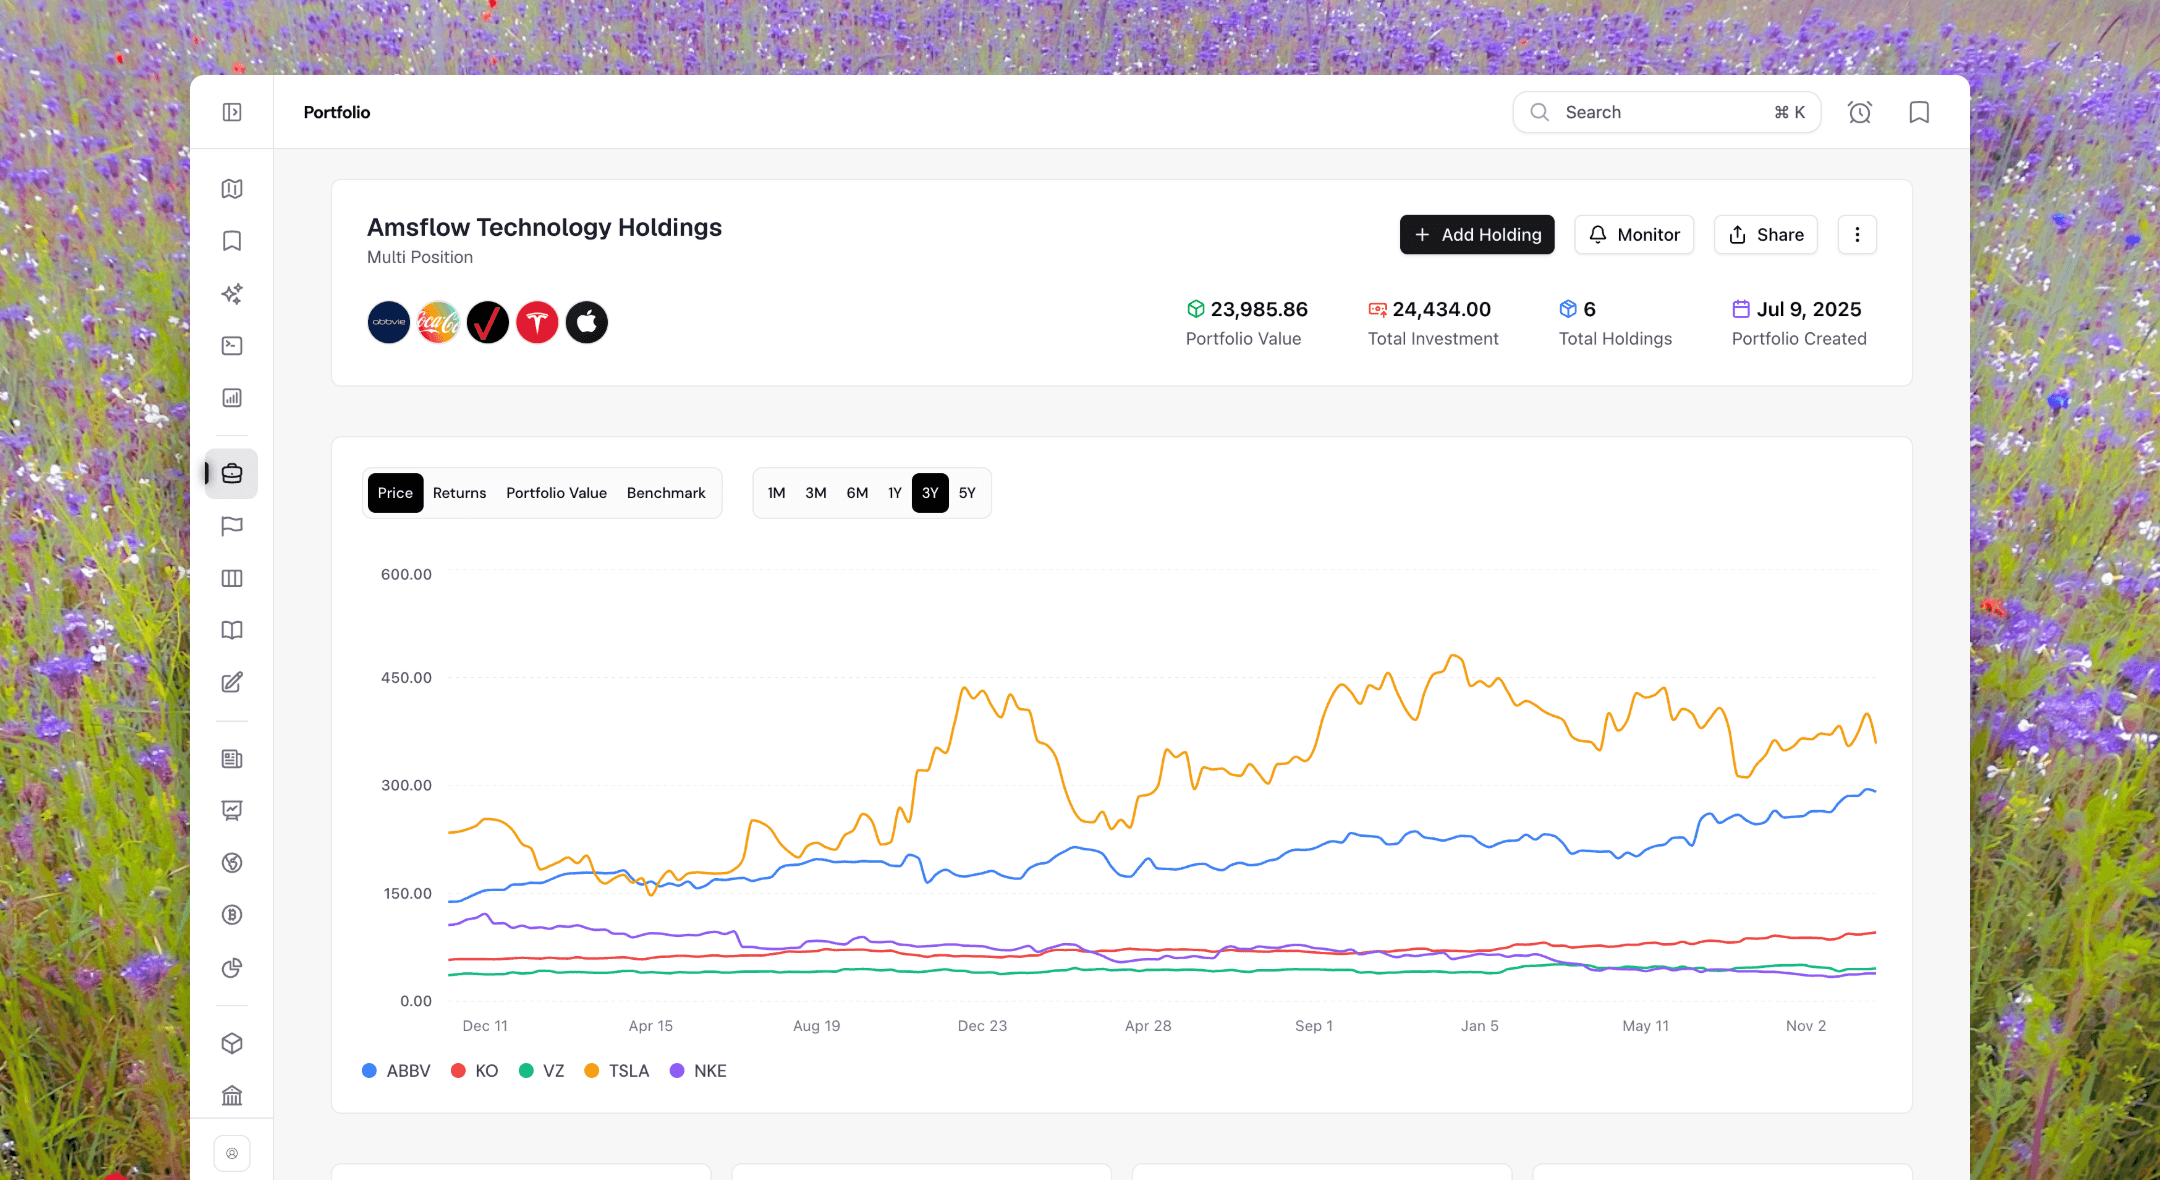
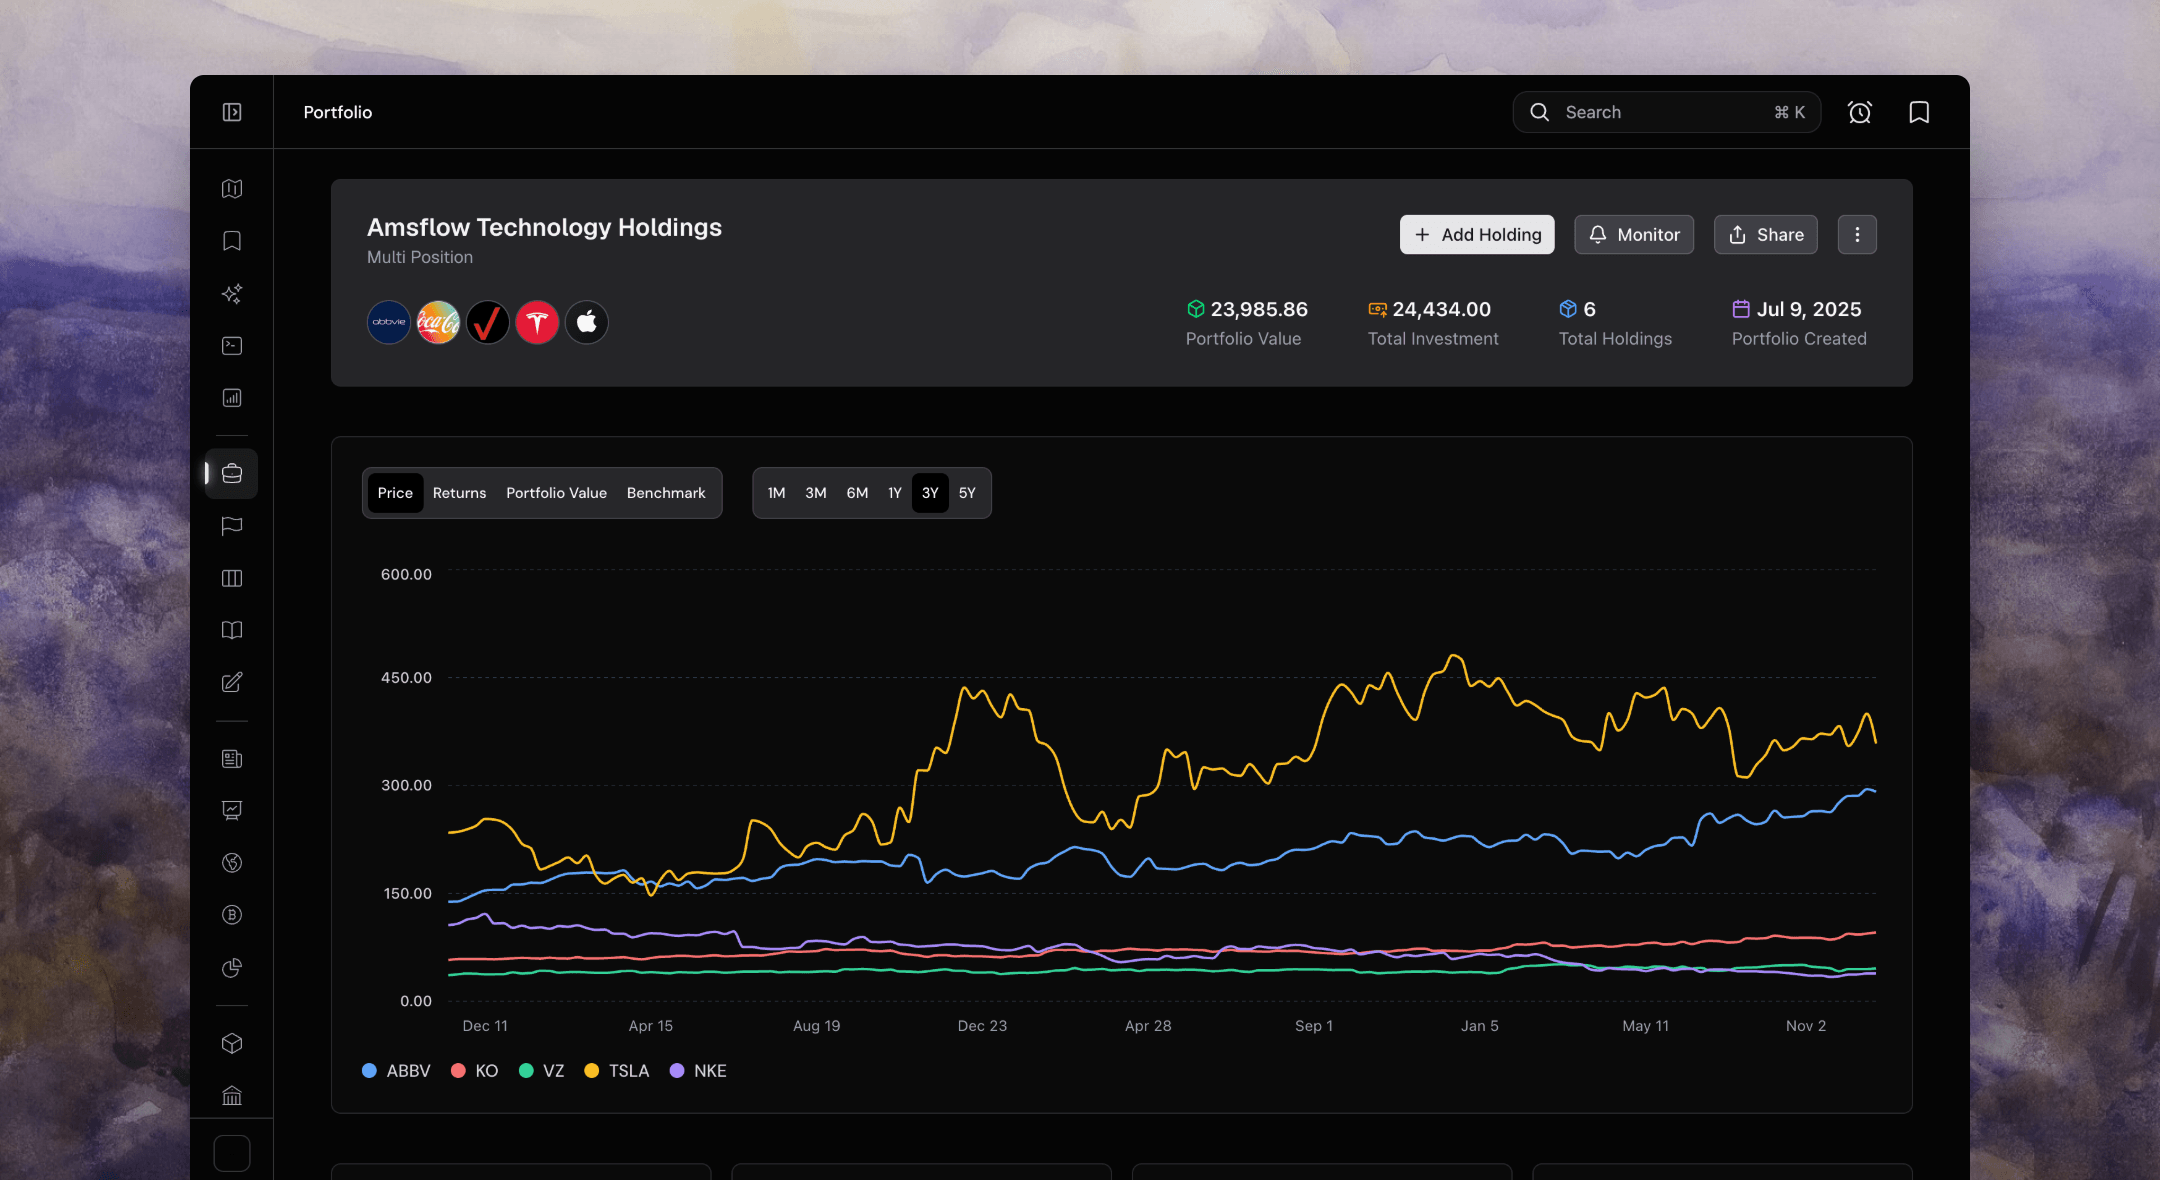
Your watchlist
Prices and daily moves for everything you follow, each in its own currency.
Sentiment by market
Fear and greed for the US, Europe, Asia, gold and crypto, side by side.
Heatmap, movers and news
What moved today and why, with indices, commodities, crypto and forex.
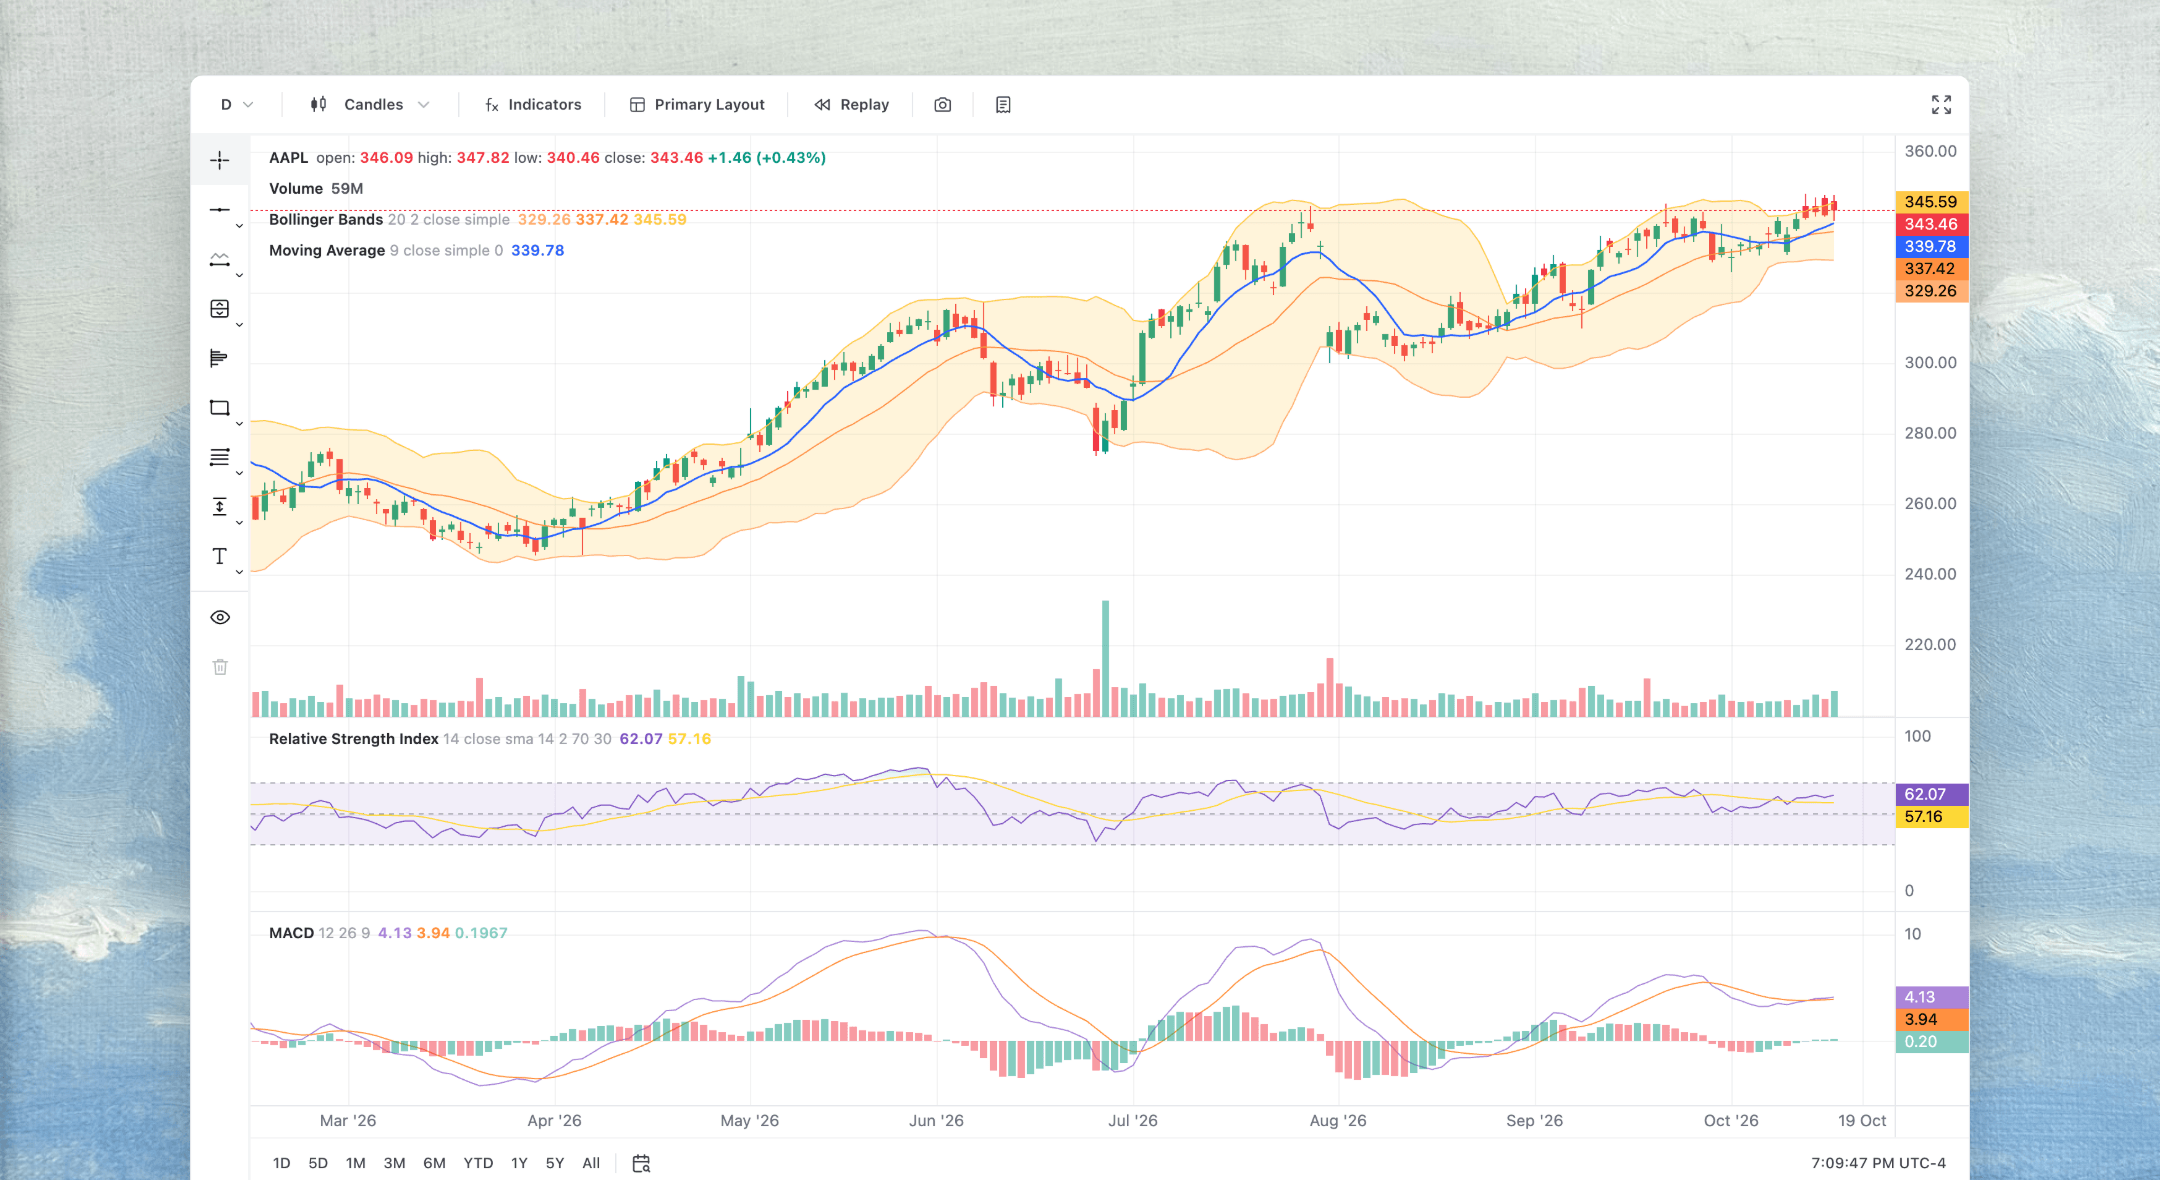
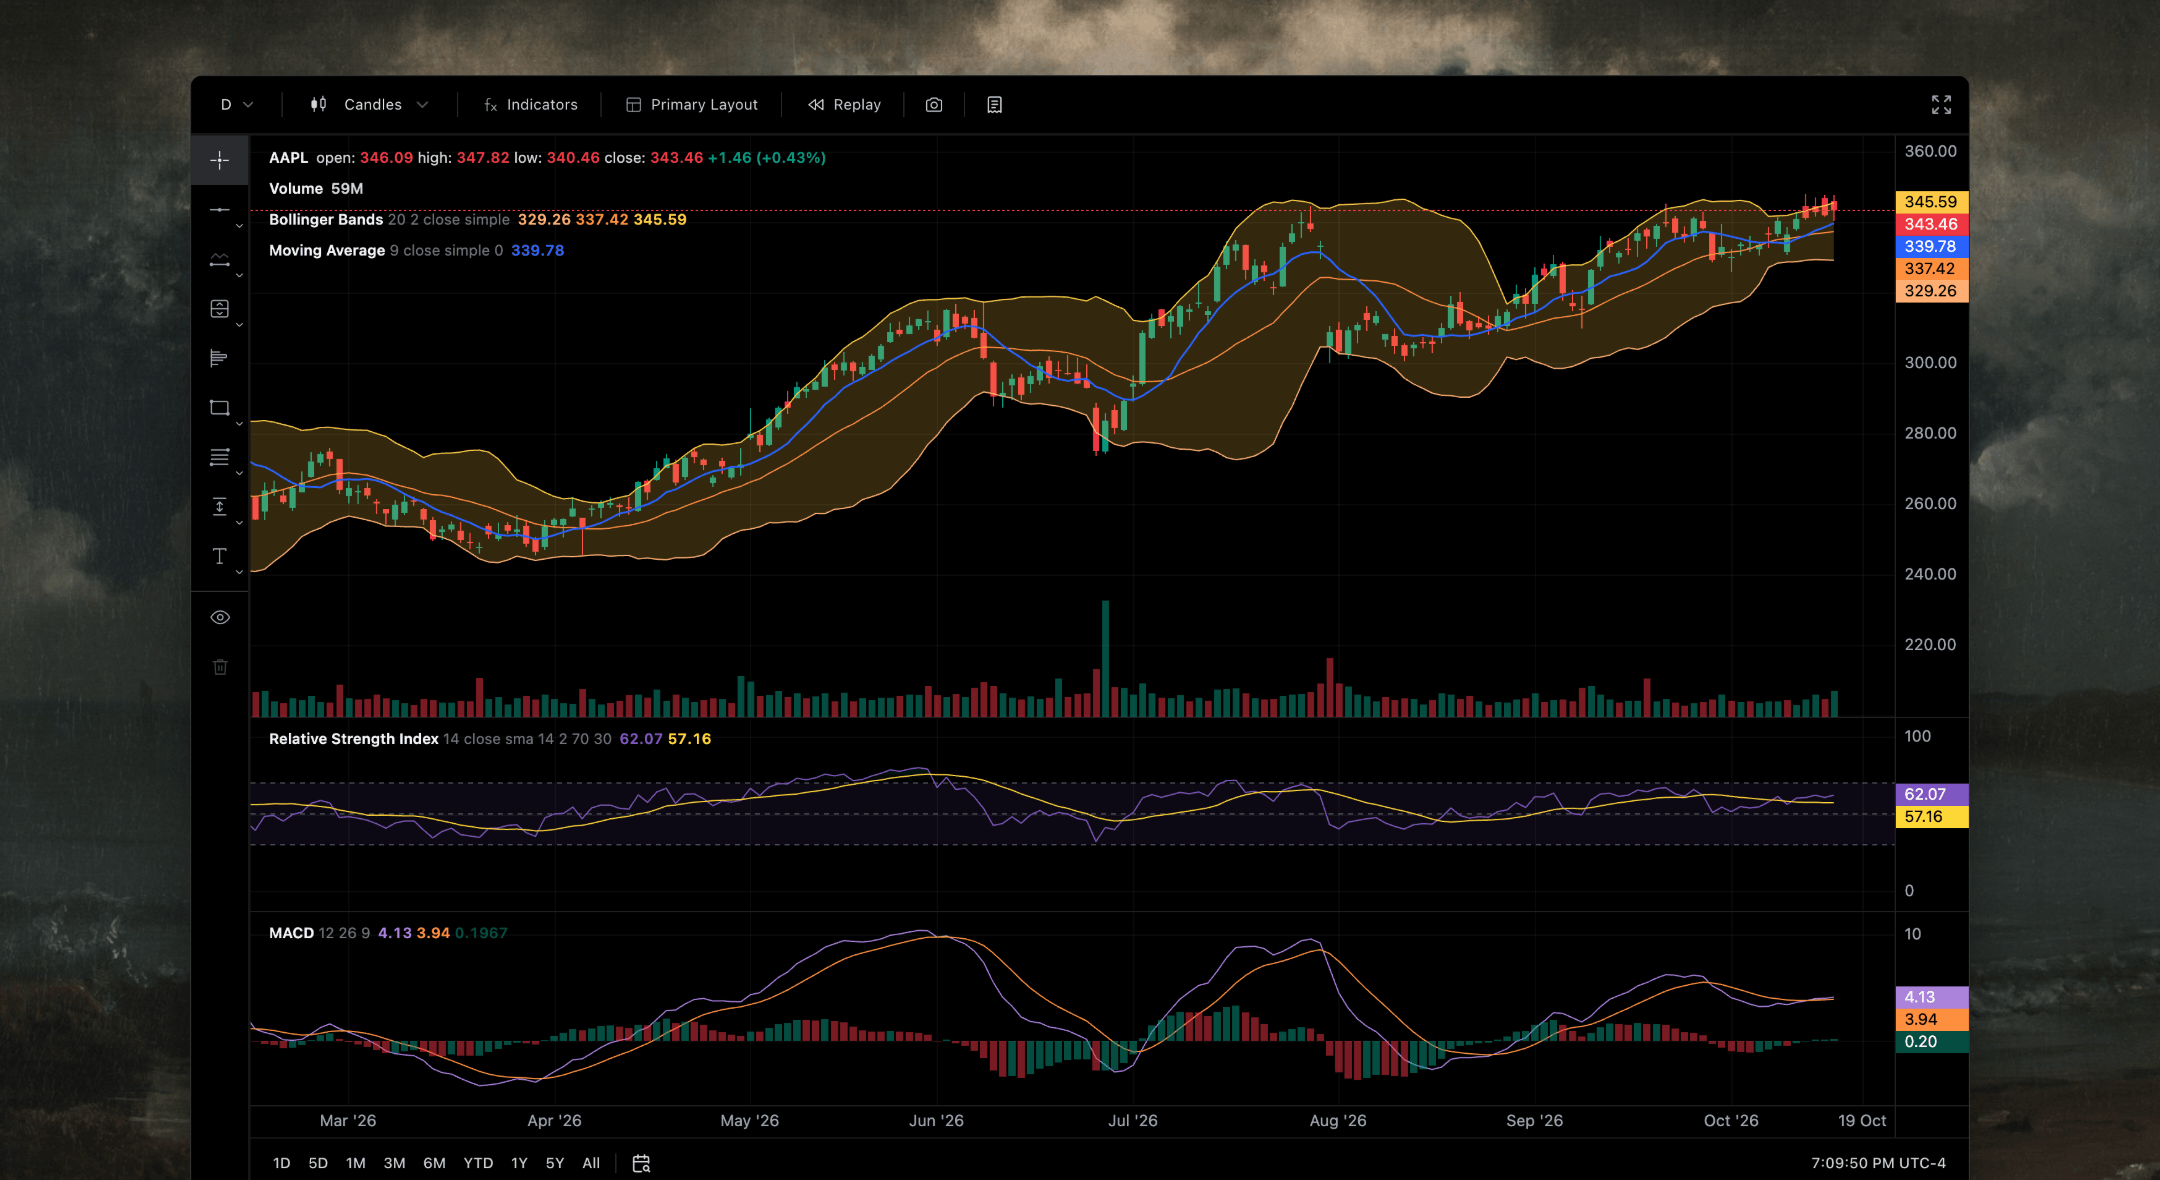
74 indicators, 59 drawing tools
19 chart types, including Market Profile and Volume Footprint, on Amsflow Chart Engine II.
Backtest and replay
Strategies with no look-ahead, bar-by-bar Replay and paper trading, right on the chart.
Up to 16 charts
Layouts with their own symbols and intervals, custom intervals and higher-timeframe indicators.
Build from plain language
Describe an indicator or a strategy and Flow Agent writes it in FlowScript, applies it and backtests it.
Ask about the chart
It reads the bars, indicators and backtest trades in front of you, and any screenshot you attach.
Act on it
Draw key levels, set price and conditional alerts, or build a screen, straight from the chat.
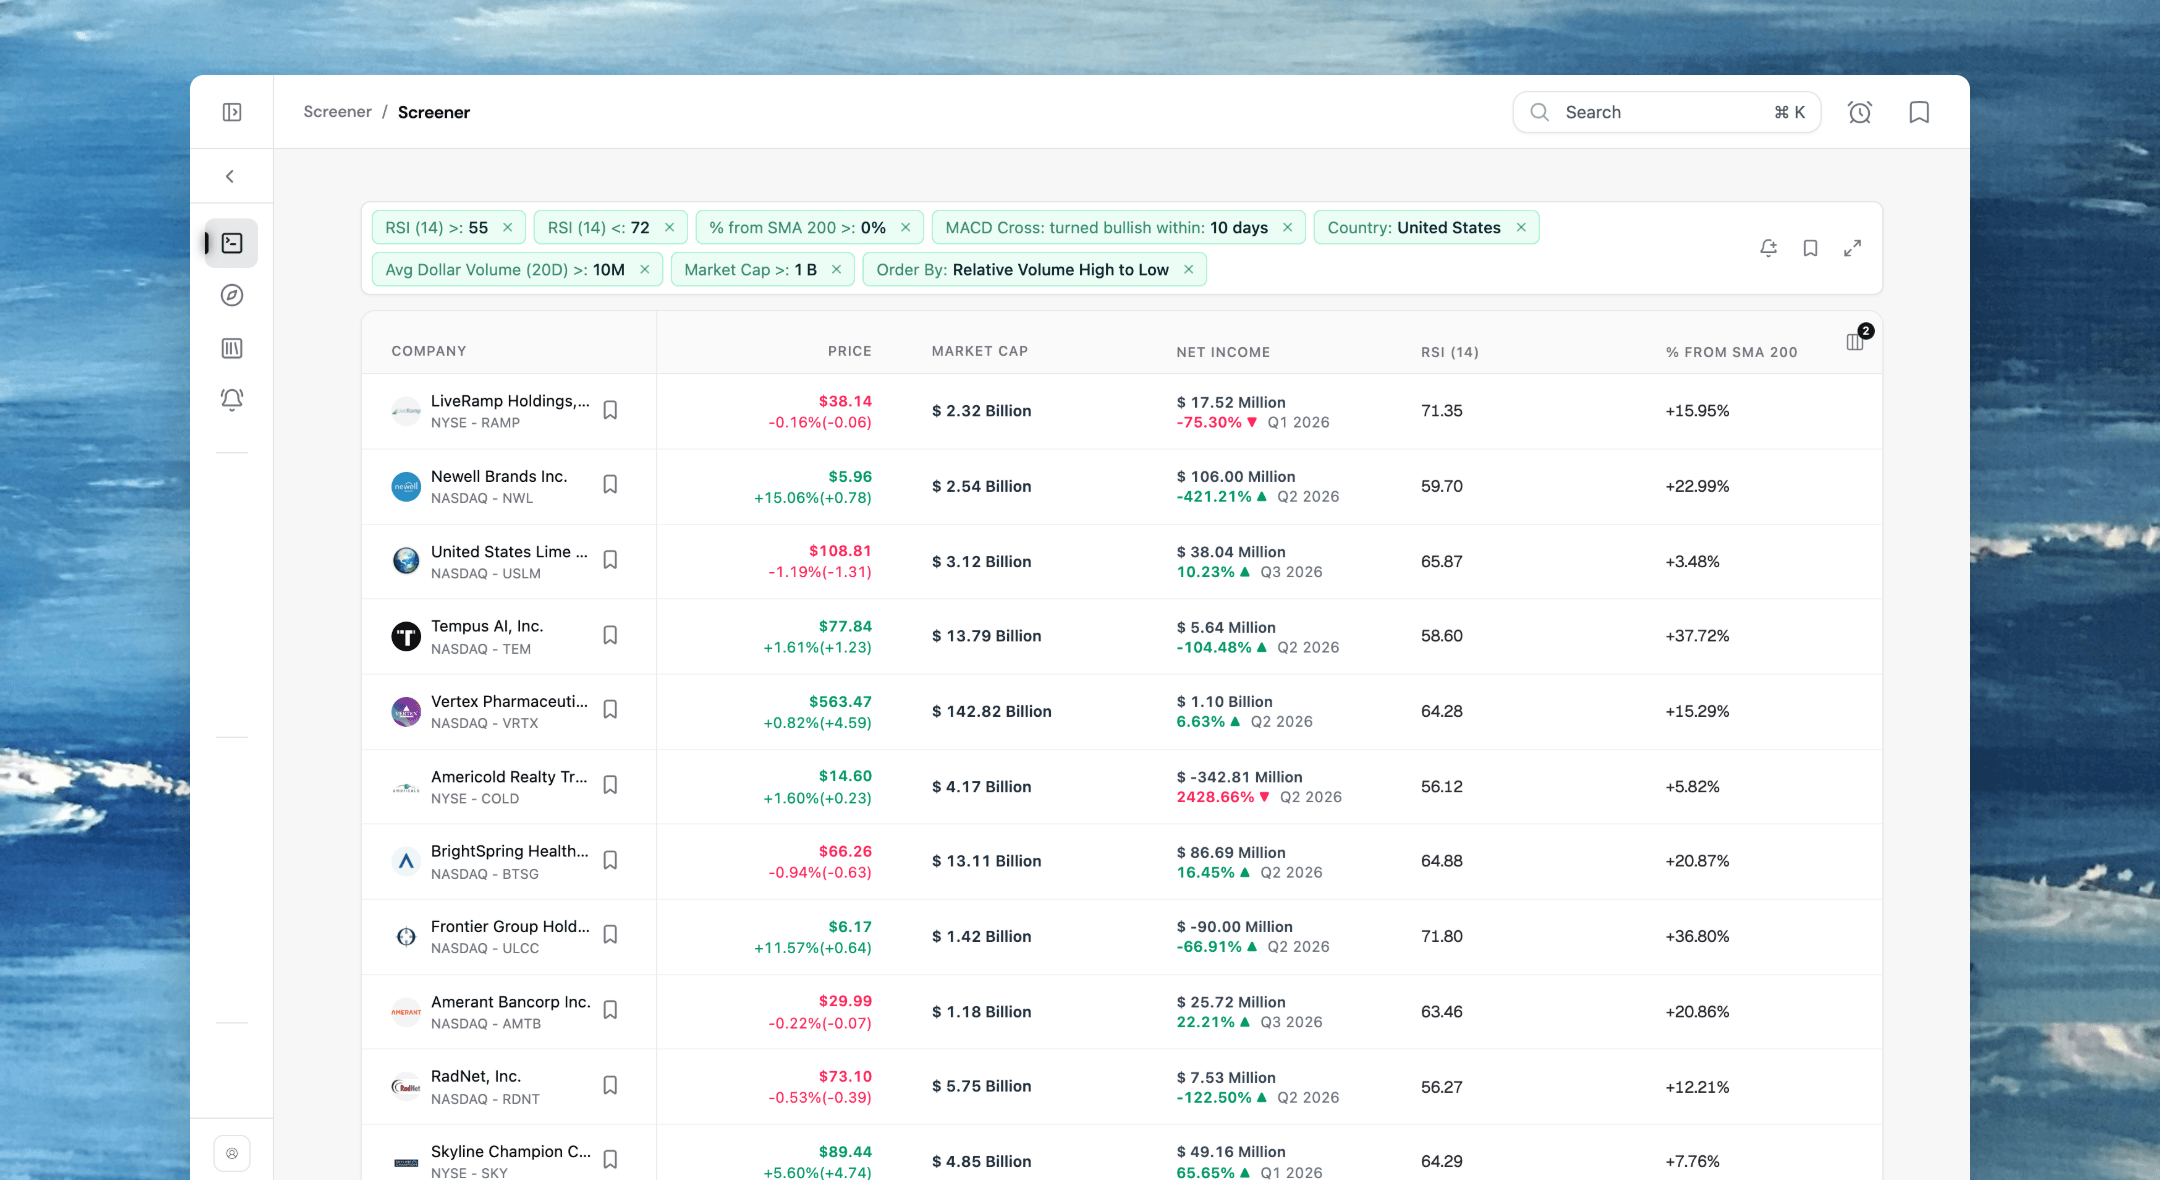
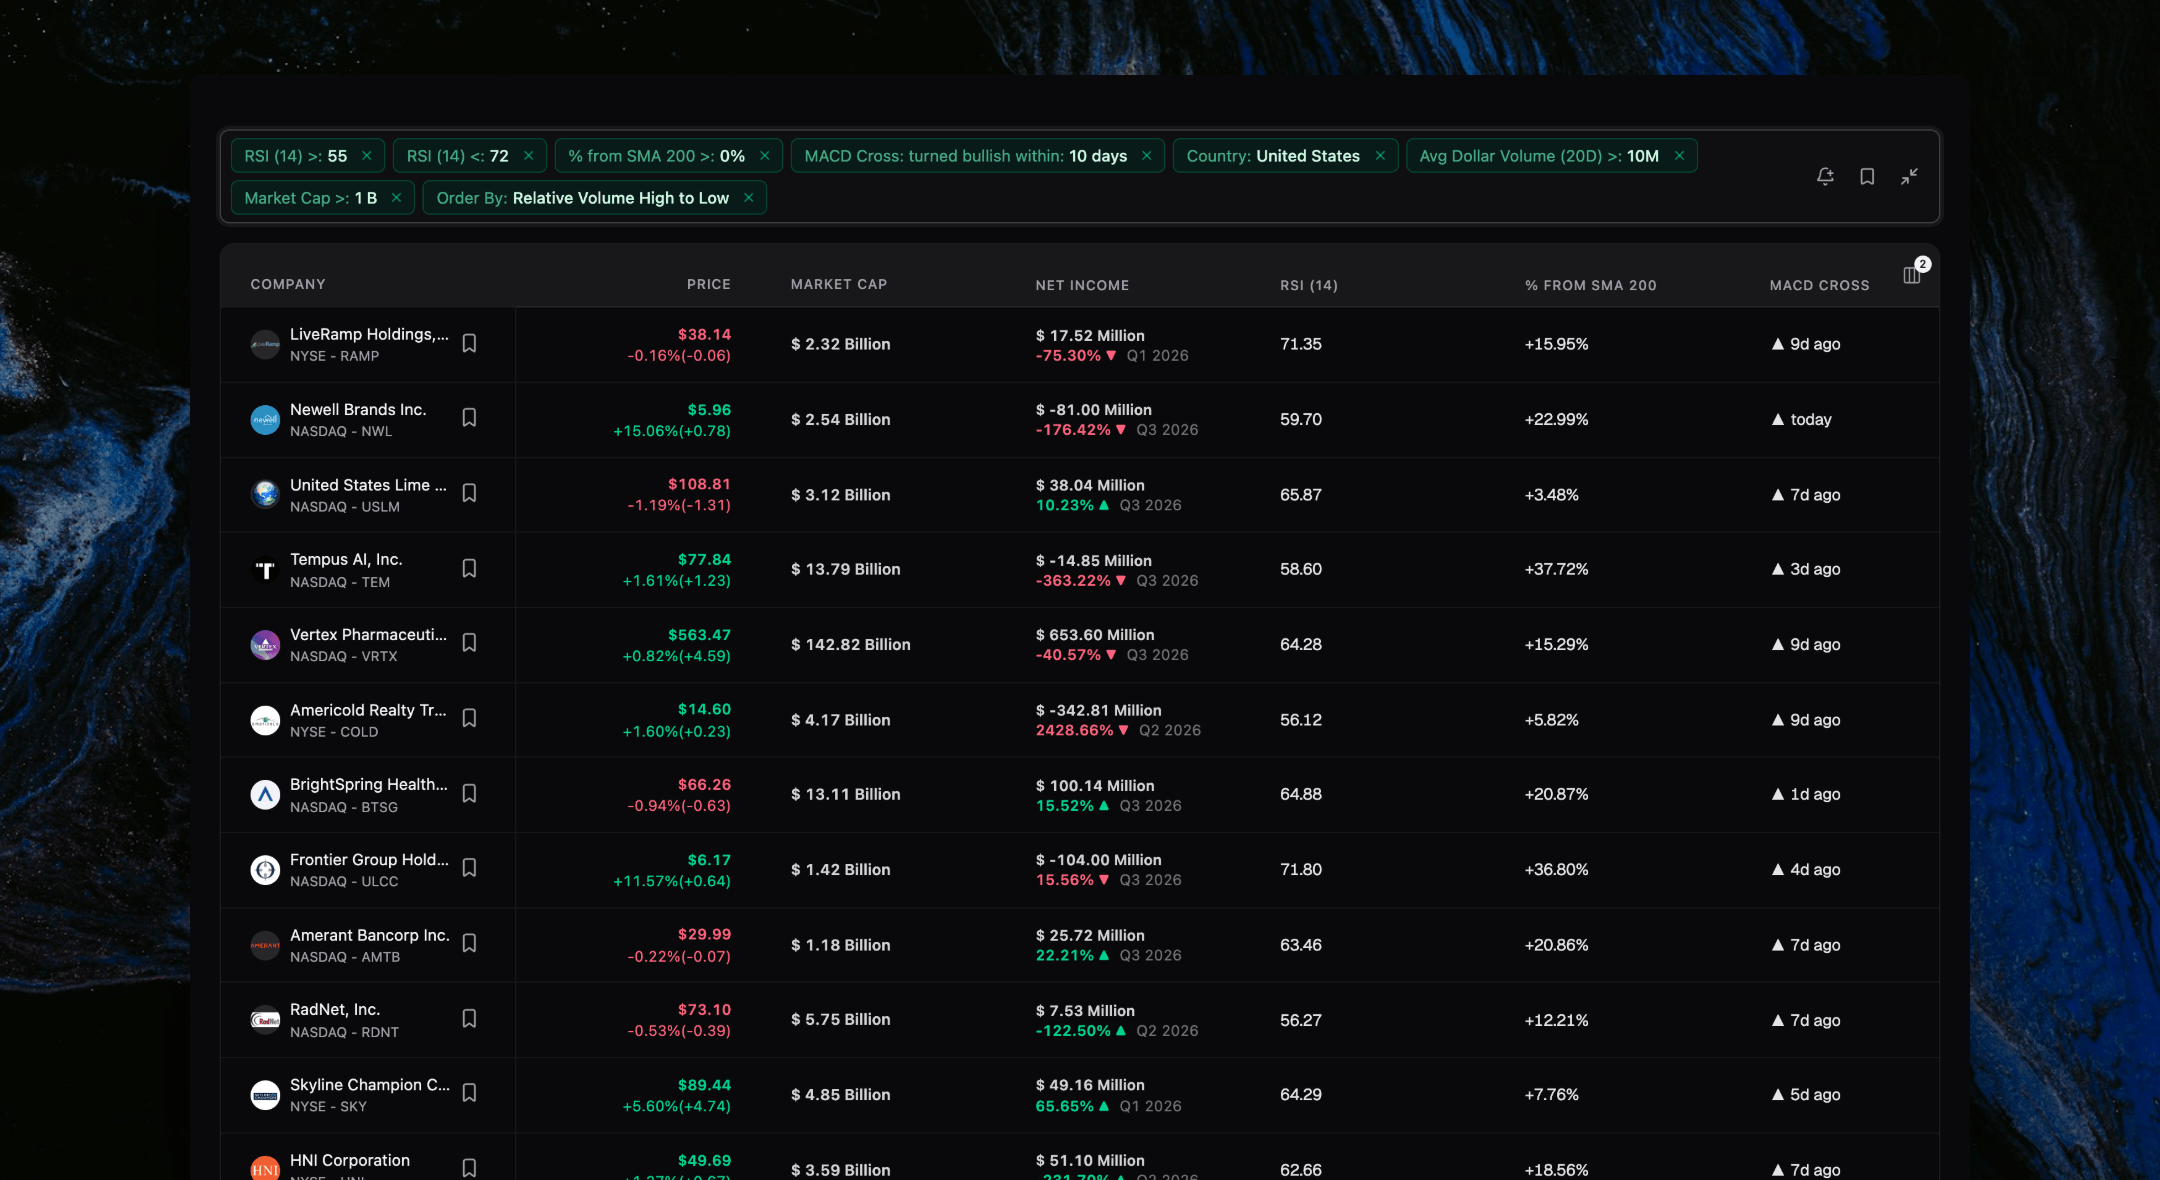
830+ metrics, 1,390+ filters
Fundamentals and technicals in one screen, on daily, weekly and monthly bars.
Patterns and signals
44 candlestick and 16 chart patterns by stage, divergences, Smart Money Concepts and 37 strategies with win rates.
Columns and alerts
1,270+ sortable columns, and an alert when stocks enter or leave a screen after the close.
Up to 10 conditions
Join them with and / or and group them in brackets, so one alert covers the whole setup.
60+ indicators
Price, indicator, divergence, volume and fundamental alerts, on stocks, ETFs, crypto and more.
Email, SMS or webhook
Straight to Slack, Microsoft Teams, Discord or Telegram when it triggers.
Ask or research
Ask mode for quick facts and comparisons, Research mode for valuation and bull and bear cases.
X-Ray in one click
Highlights, anomalies, a scorecard, pivot levels and a technical read for any stock, ETF or index.
Earnings calls, scored
Transcript summaries with Management Guidance Integrity, and voice input everywhere you ask.
Built from a prompt
“Track the Magnificent 7” becomes a board of widgets, ready in seconds.
Edit by asking
Follow-ups add analyst ratings, drop ratios or track margins, in place.
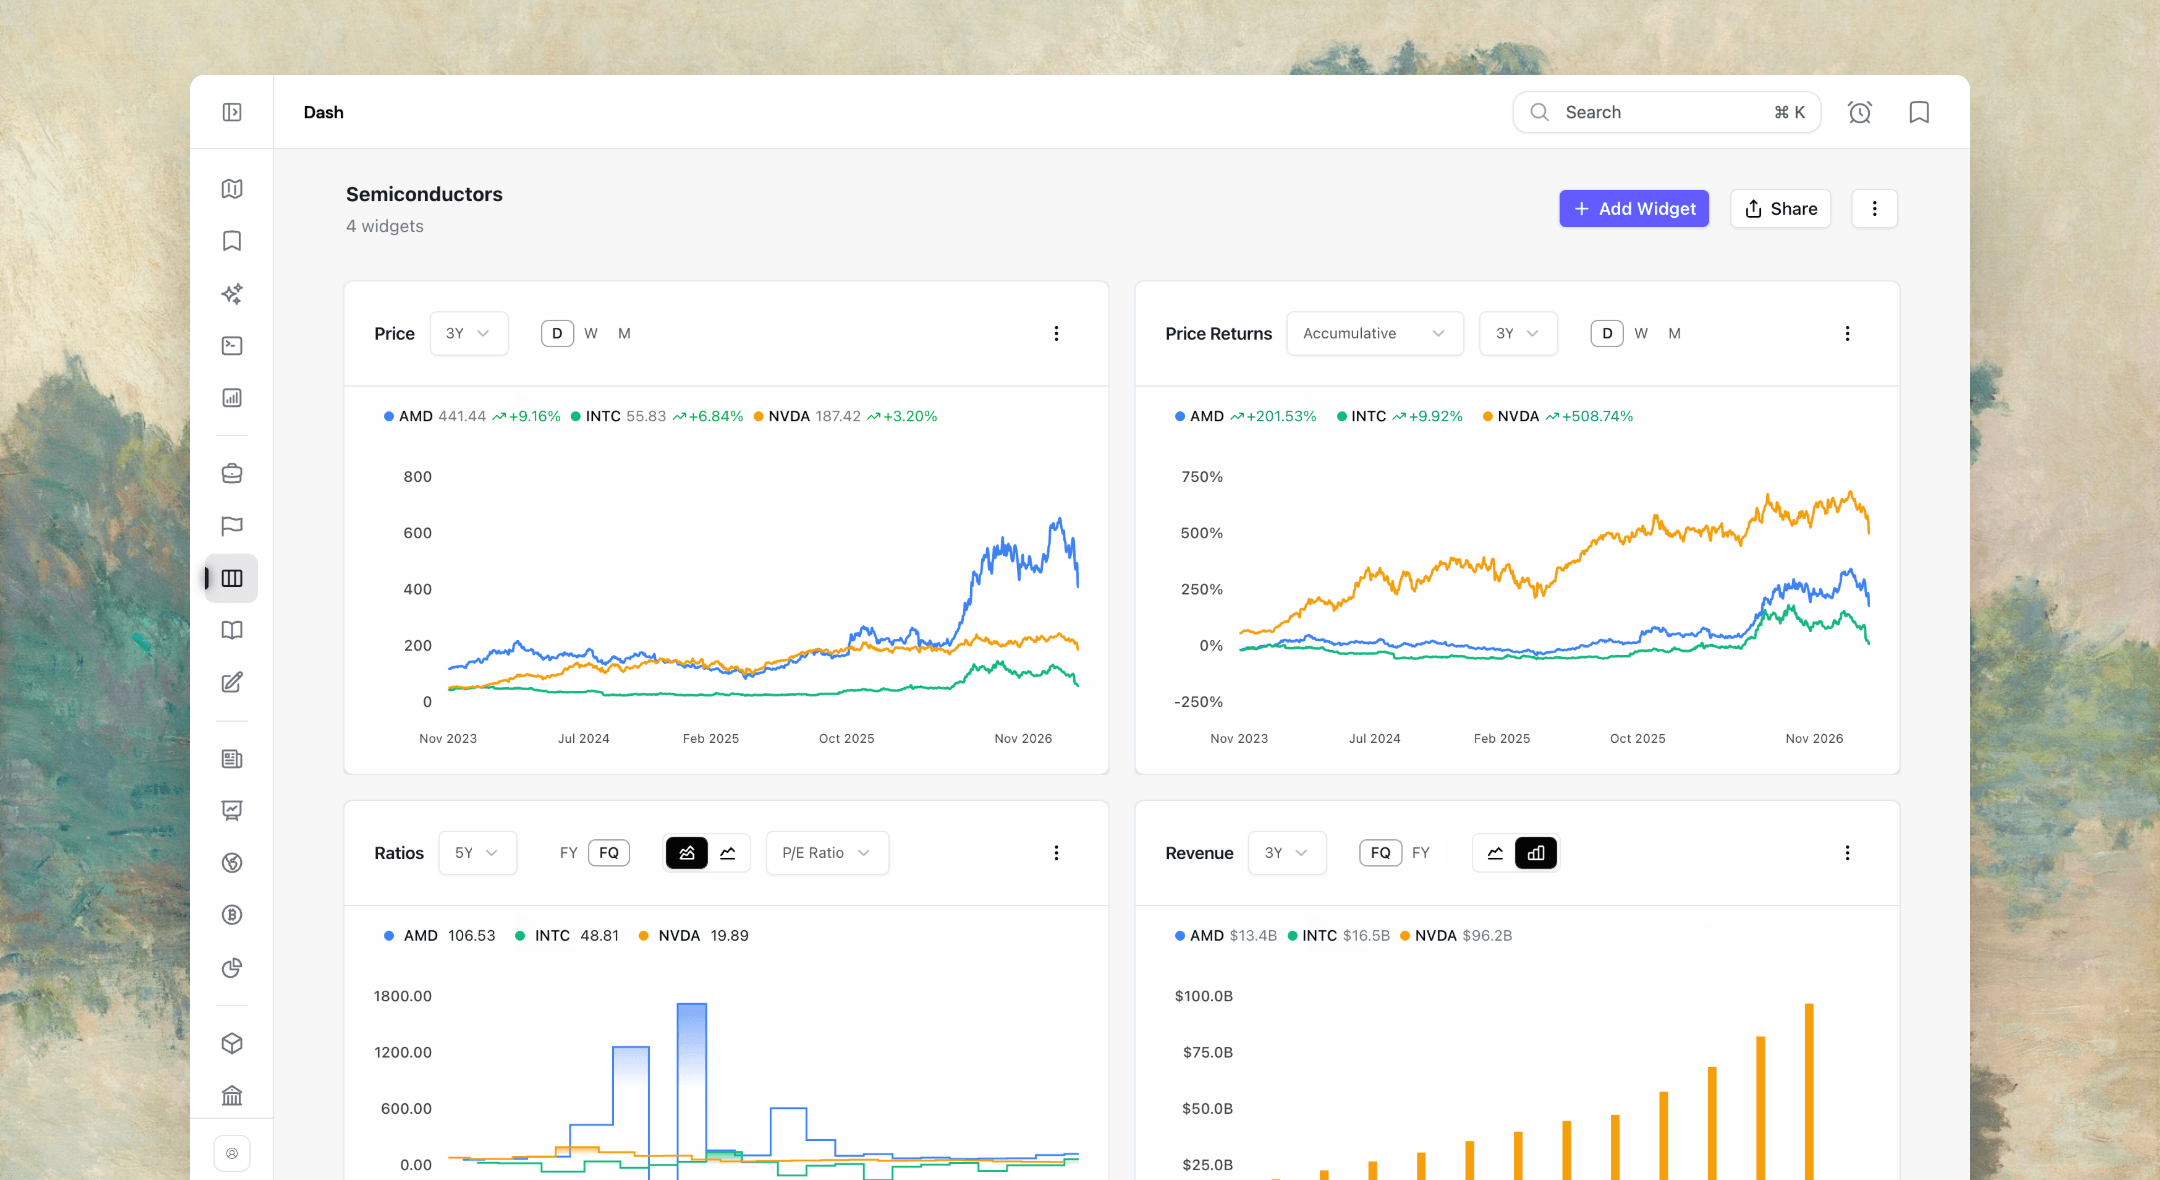
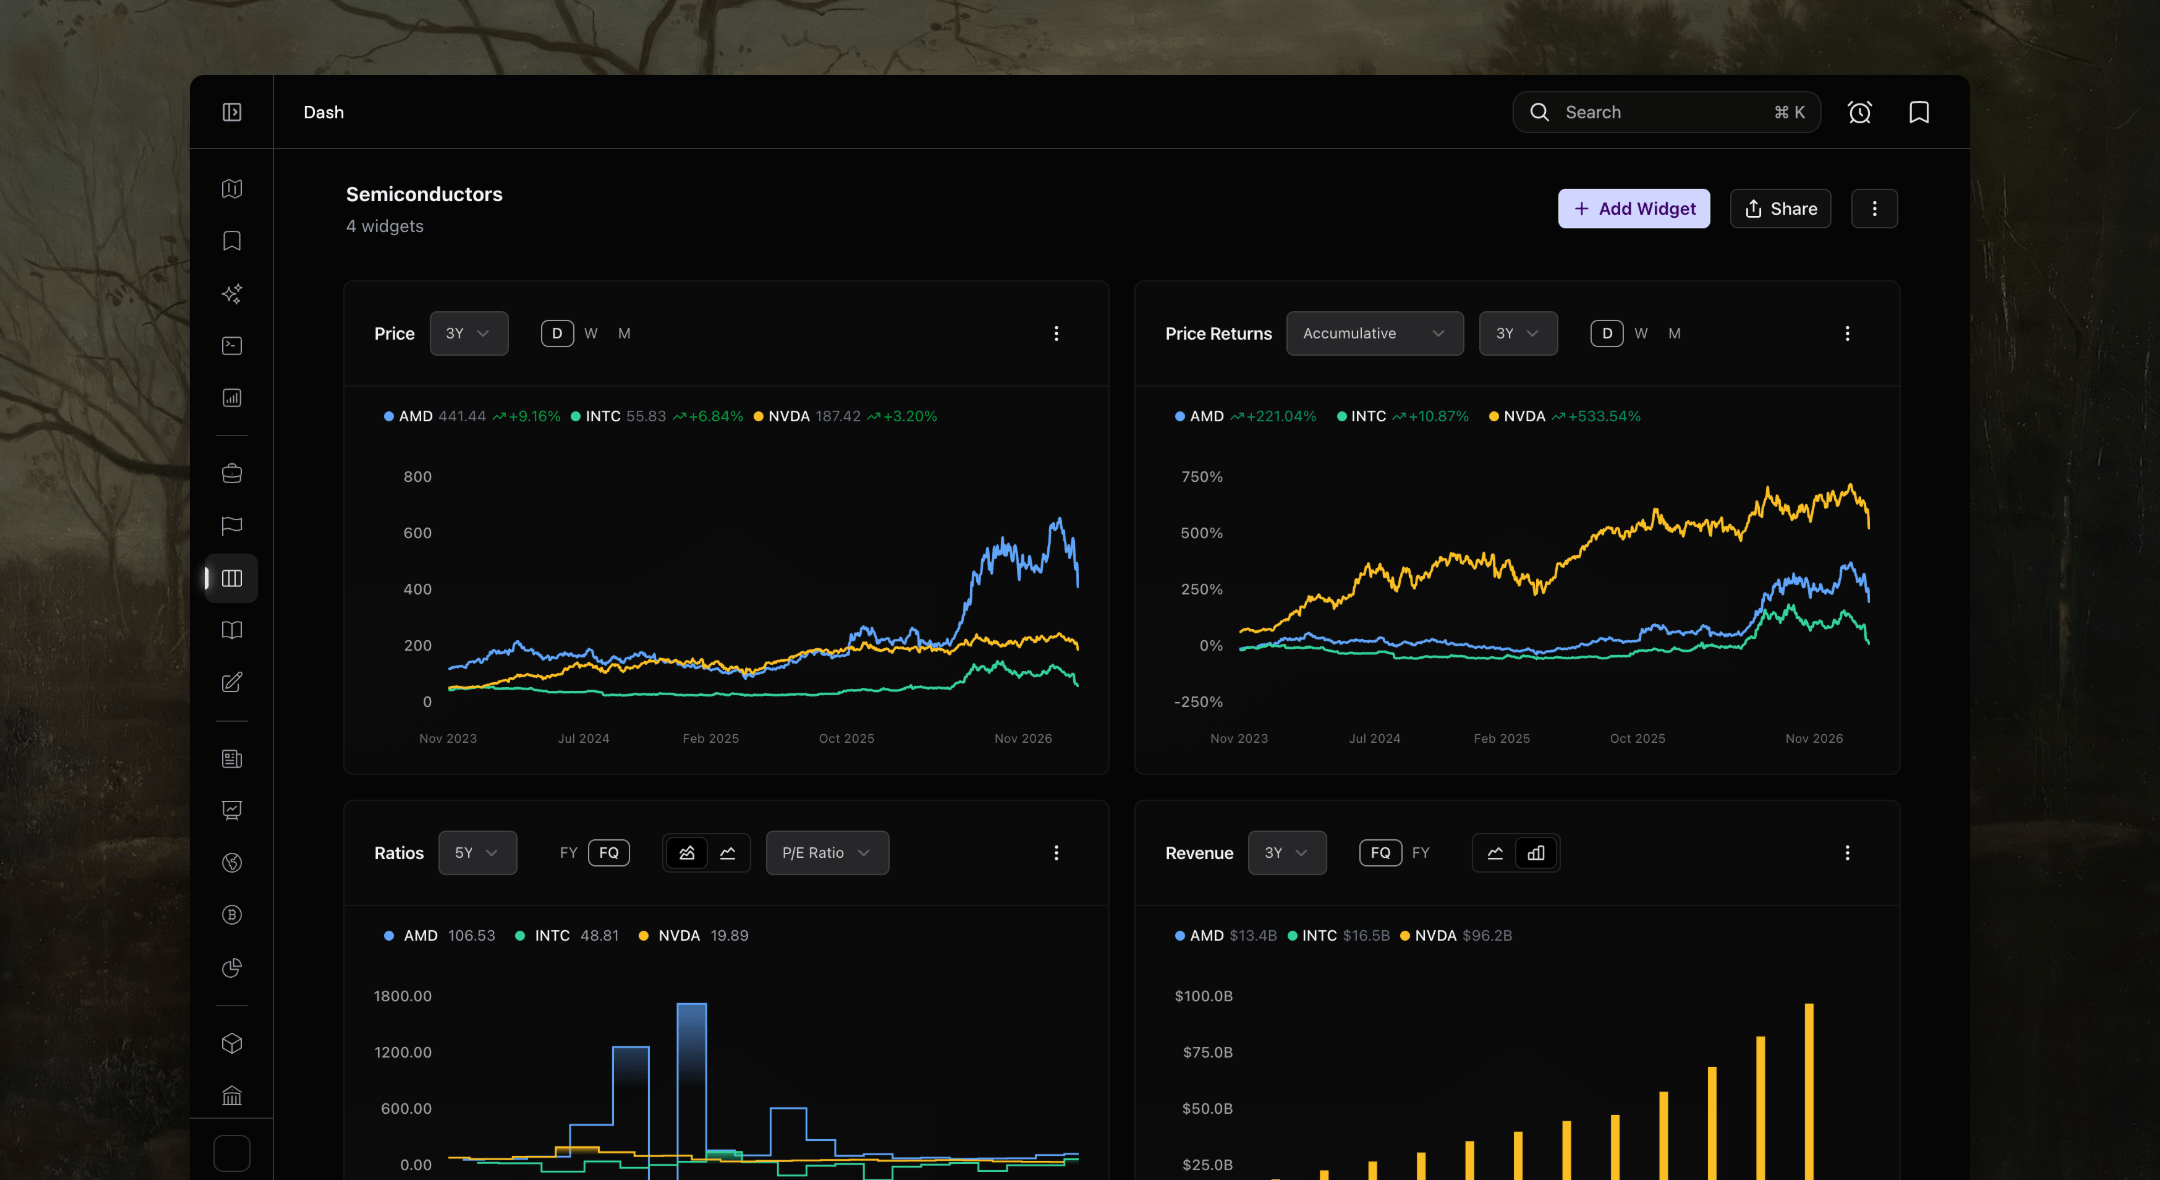
10+ widgets
Stocks, ETFs, funds, indices, crypto and commodities. Resize, reorder and share them.
Every company, one page
Financials, forecasts, valuation, segments and ownership for 70,000+ stocks.
Fair value and health
DCF and levered DCF, Altman Z-score and Piotroski F-score beside the price.
Earnings calls
Transcripts with X-Ray highlights and Management Guidance Integrity scores.
Every asset, every lot
Stocks, ETFs, funds and crypto with several lots per symbol, in one of nine currencies.
Six-factor attribution
Market, value, quality, momentum, size and low volatility, plus benchmarks and exposure.
Dividends and import
A dividend calendar, and broker import from CSV, Excel or JSON exports.
14 markets
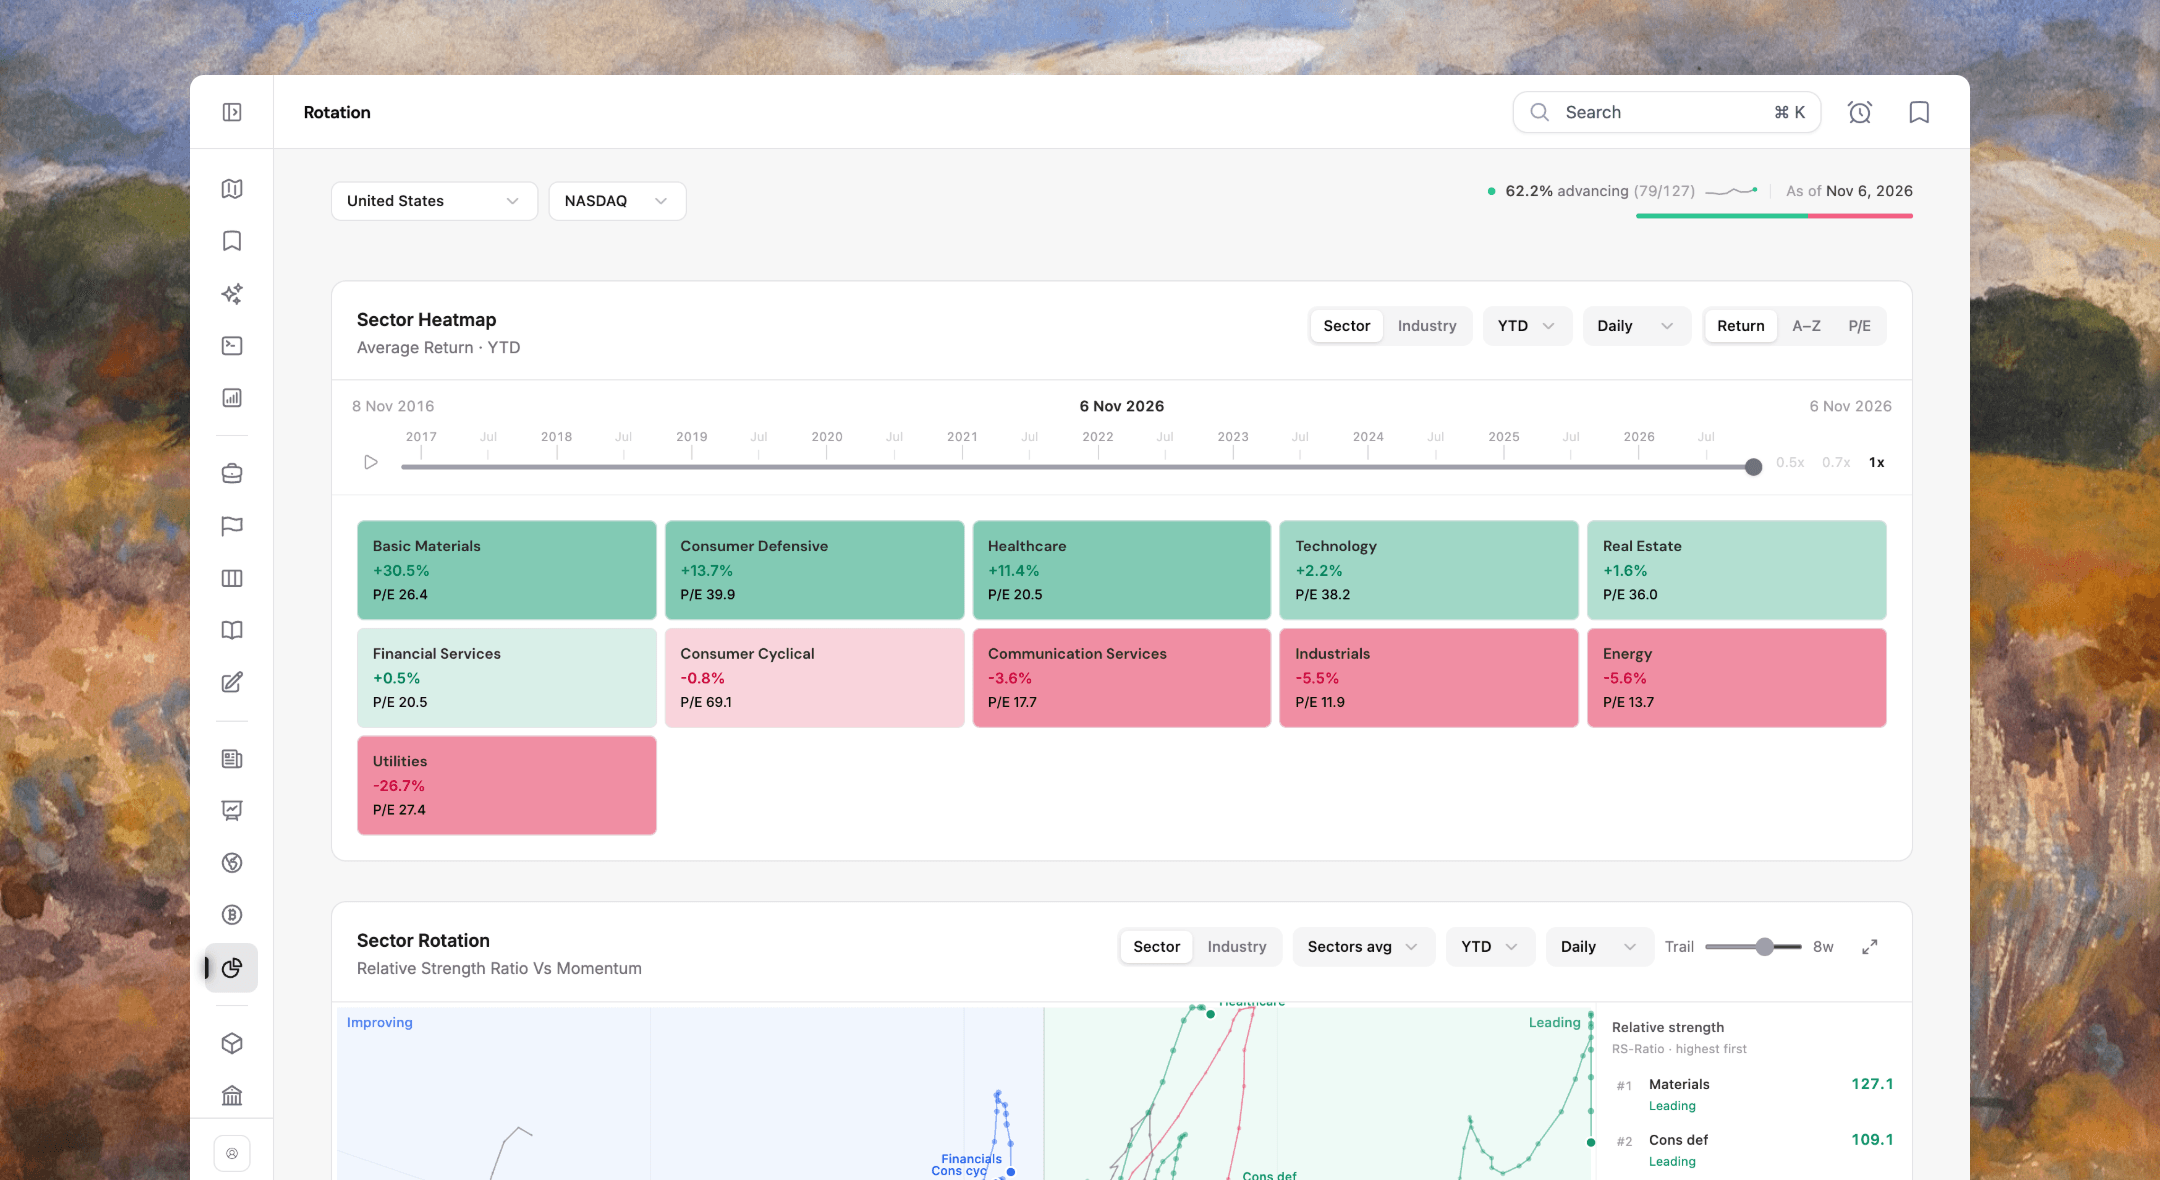
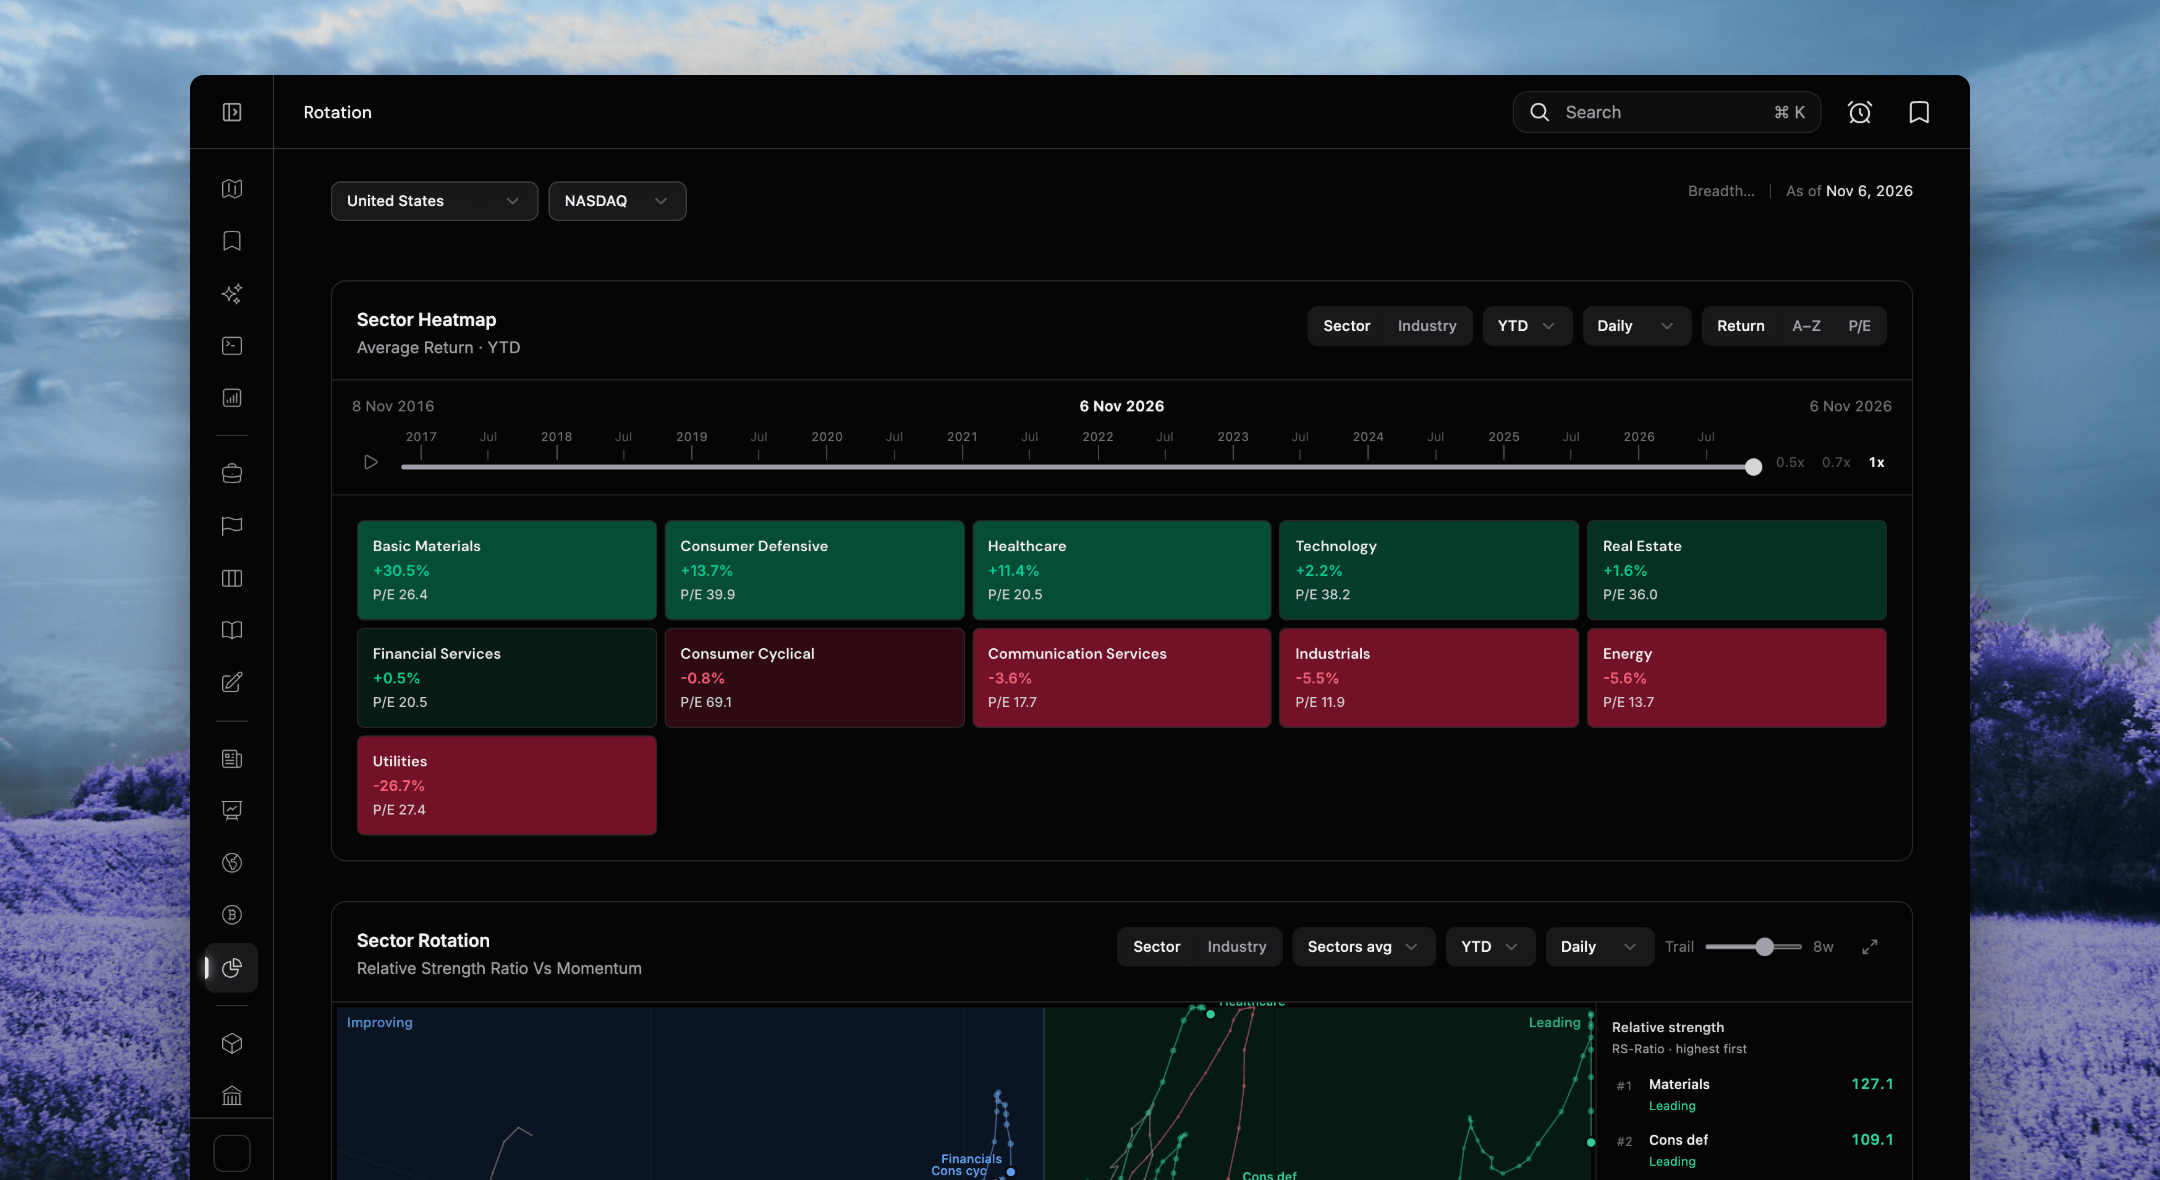
Sectors and industries through Leading, Weakening, Lagging and Improving, against each market’s own index.
Across borders
The same sector or industry side by side in every market, sorted by the global average.
Down to the companies
Valuation against momentum, P/E percentile bands, then the stocks inside each group.
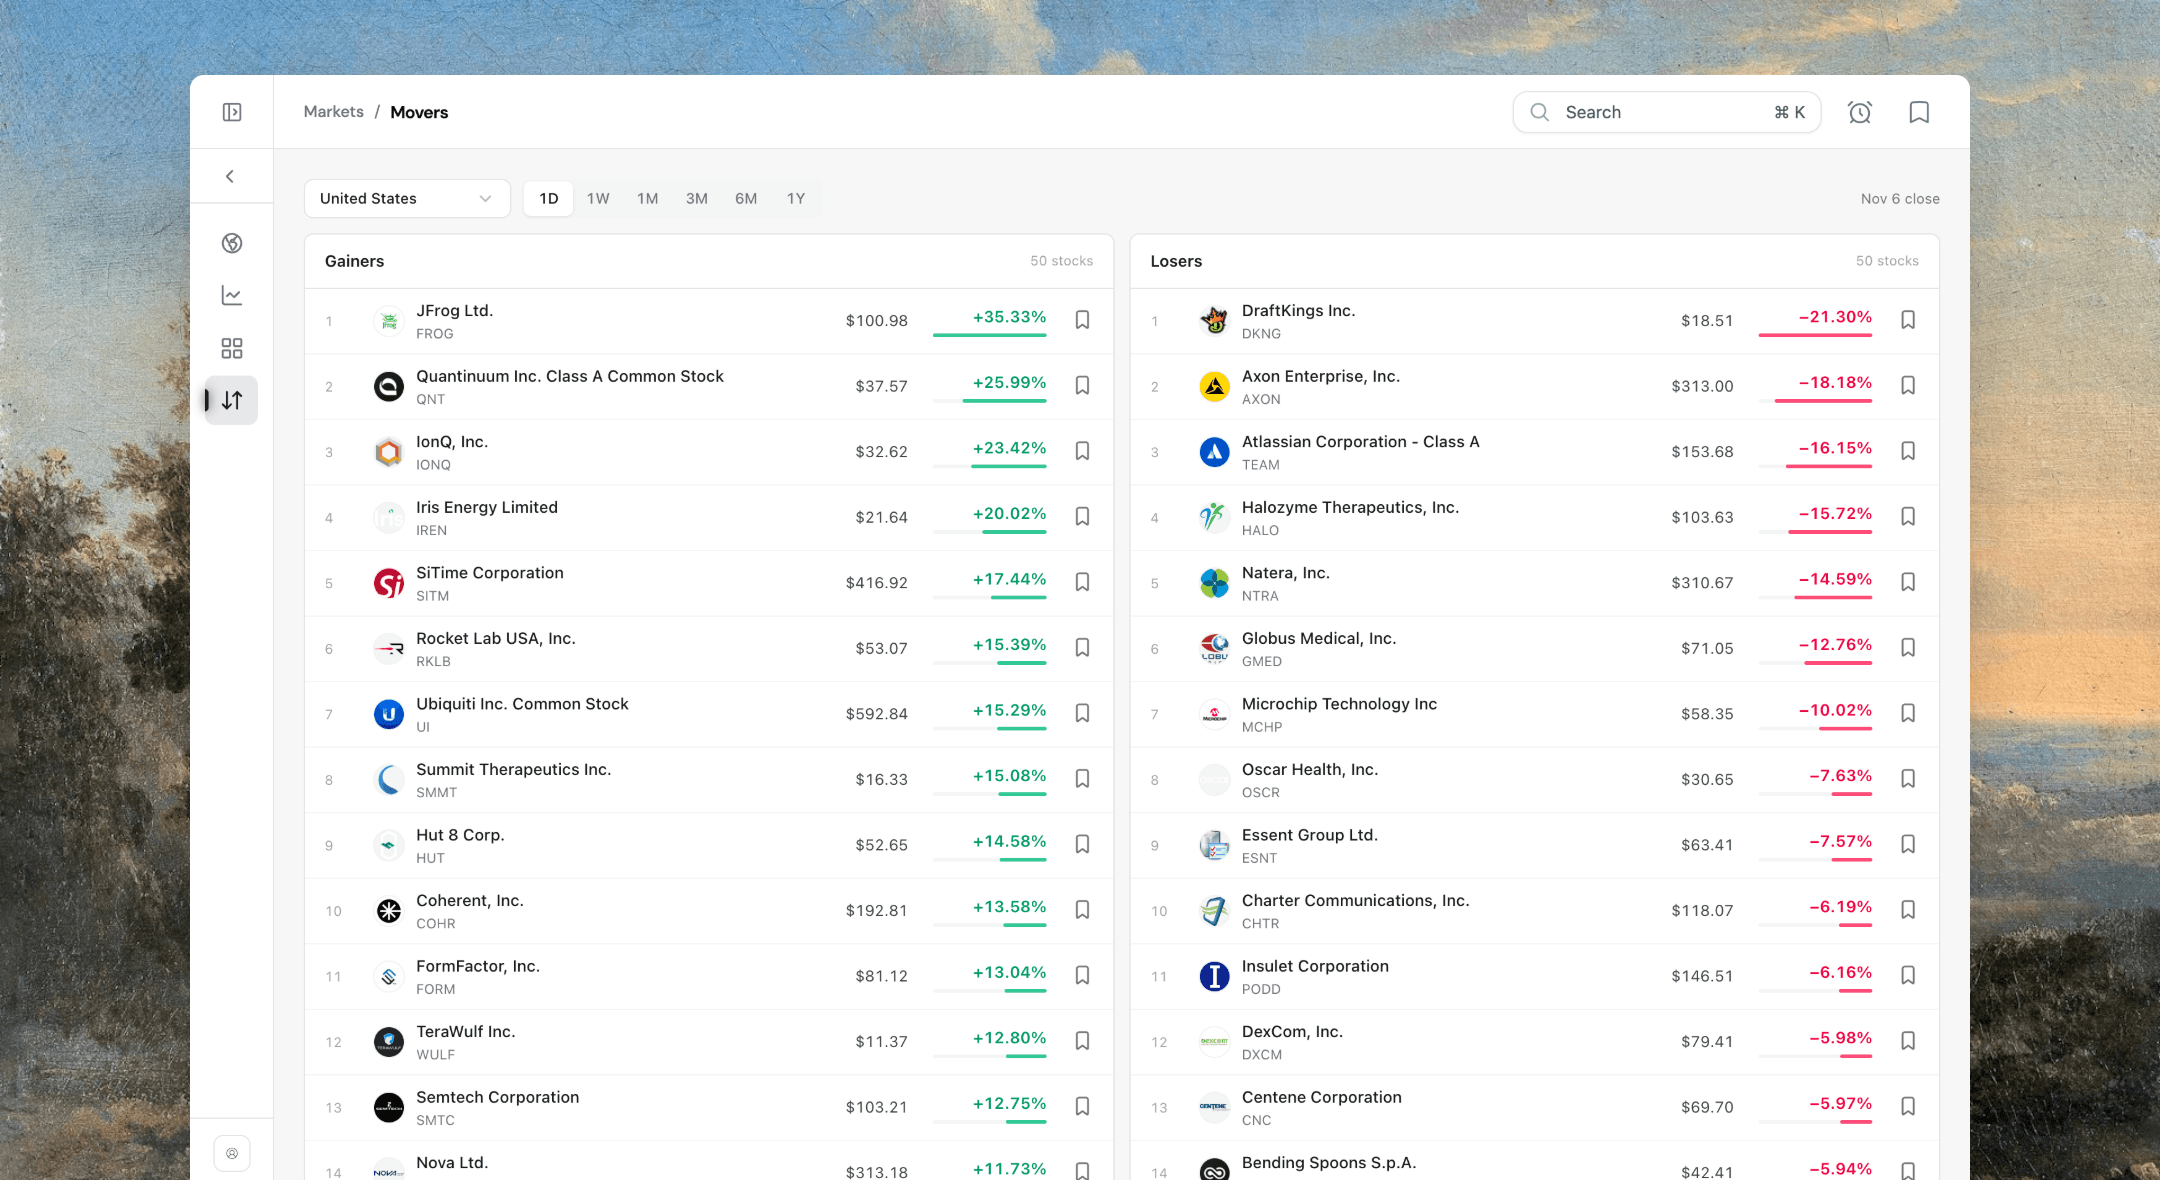
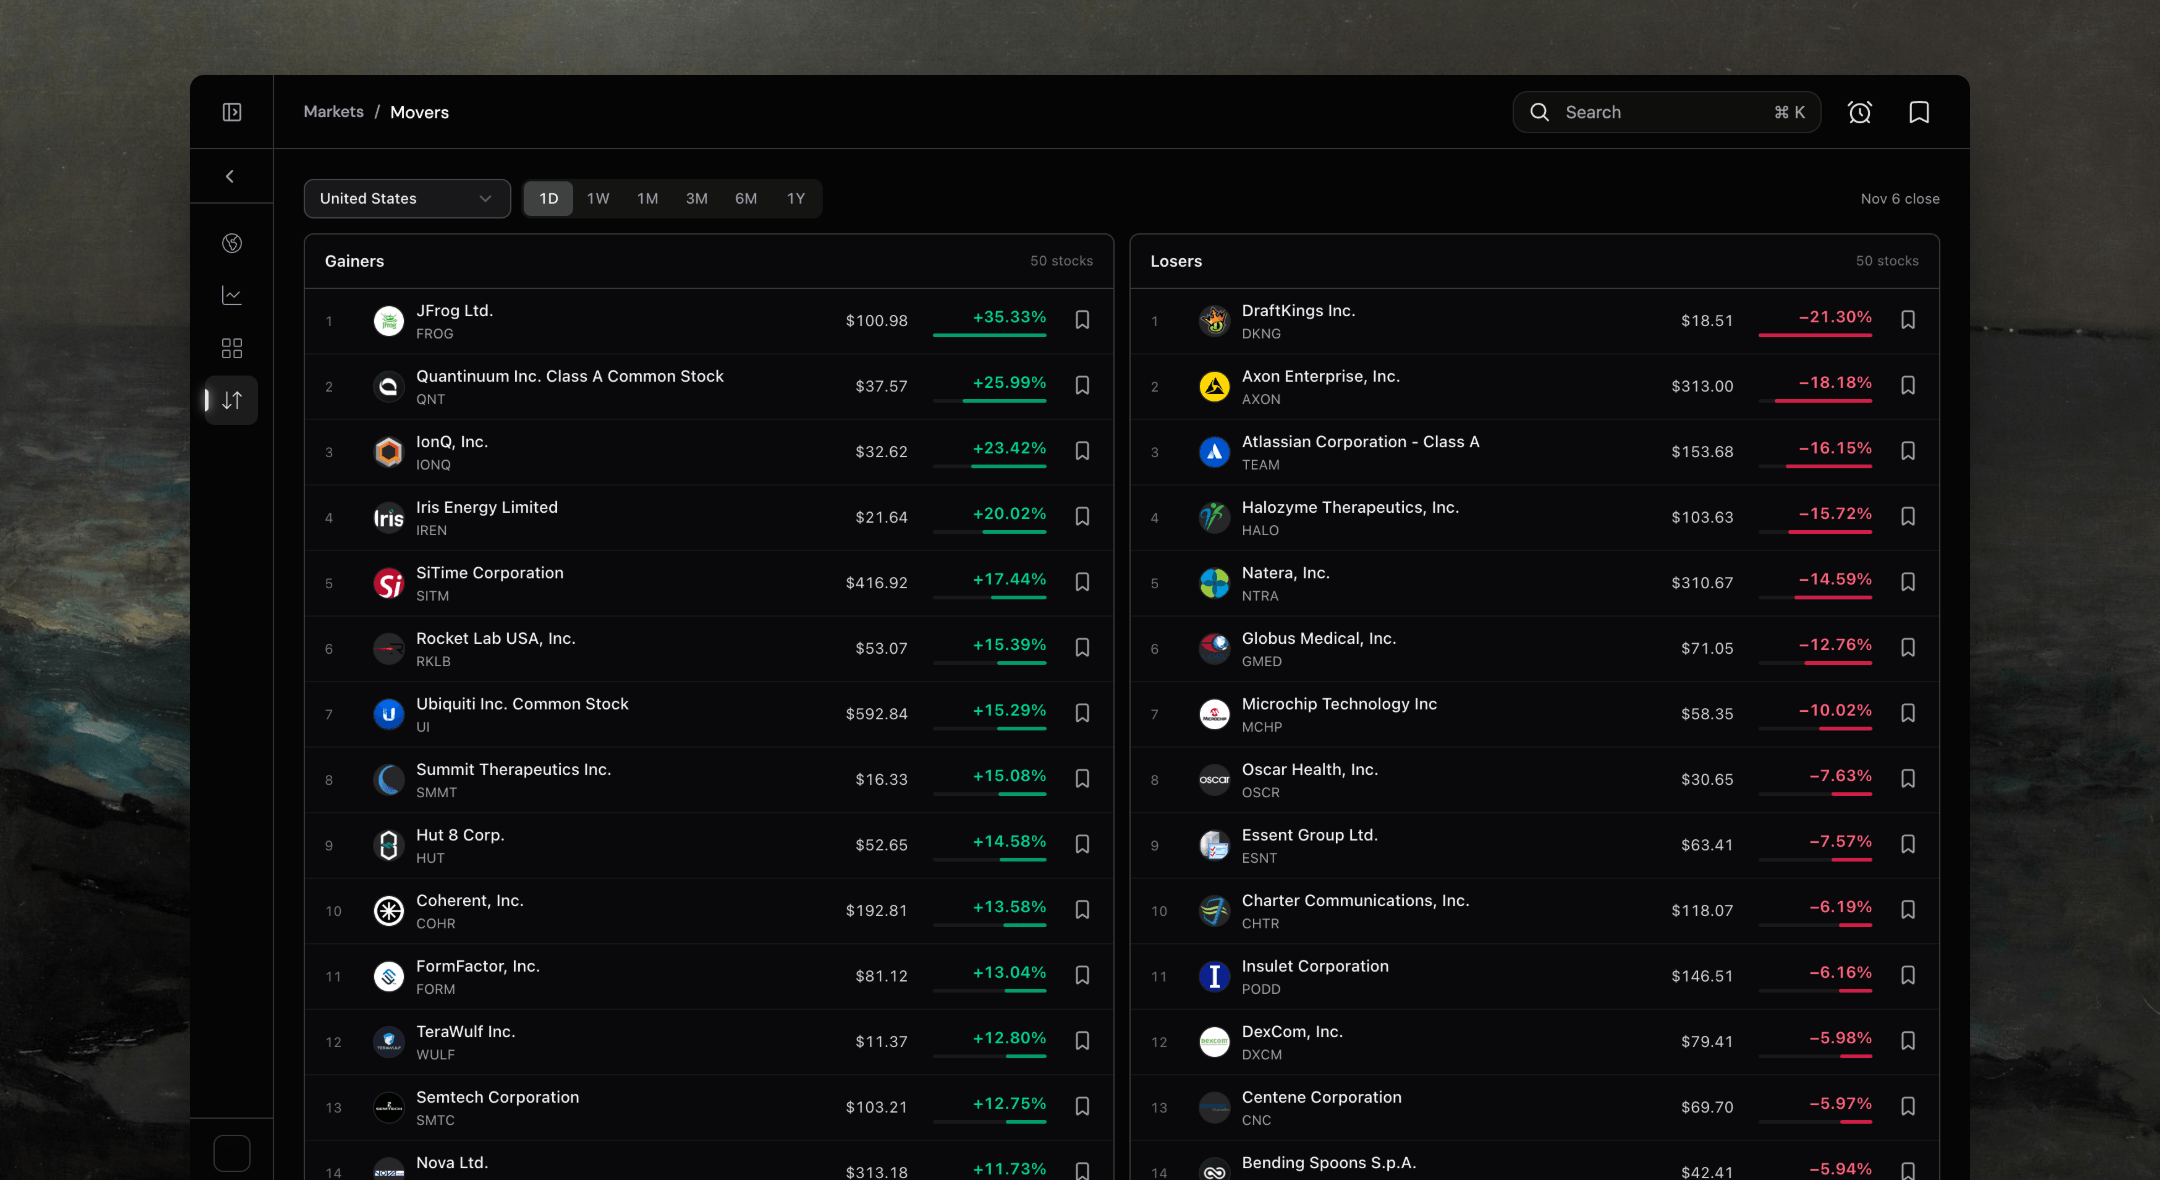
Gainers and losers
Today, or over a week up to a year, among each market’s largest companies, in 14 markets.
Fear & Greed
Sentiment for 10 markets, with its history against the index.
Fund managers and Congress
What well-known US funds hold, and the trades members of Congress disclose.
Where money moved
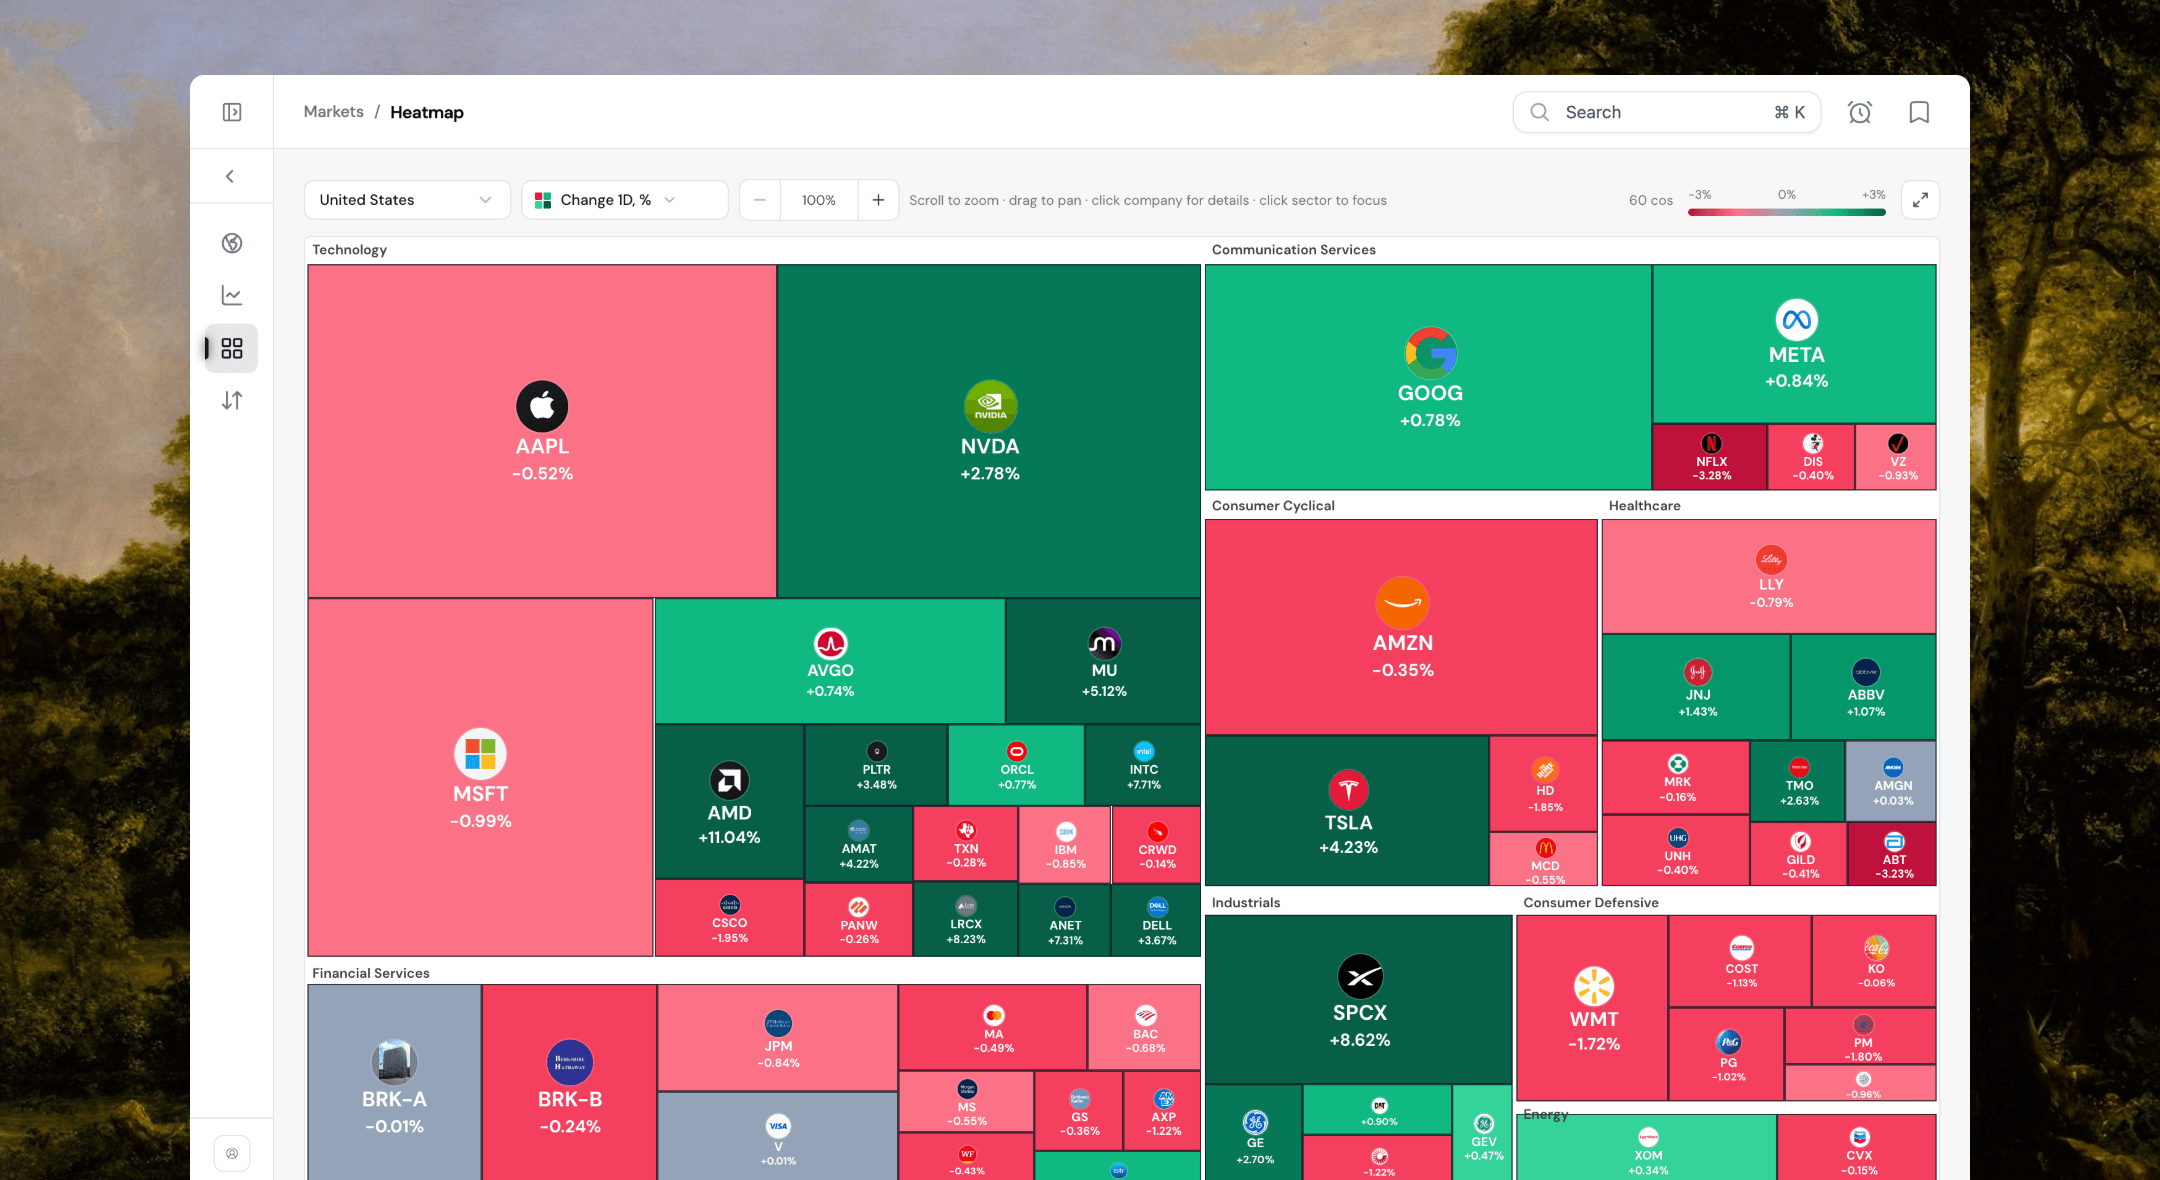
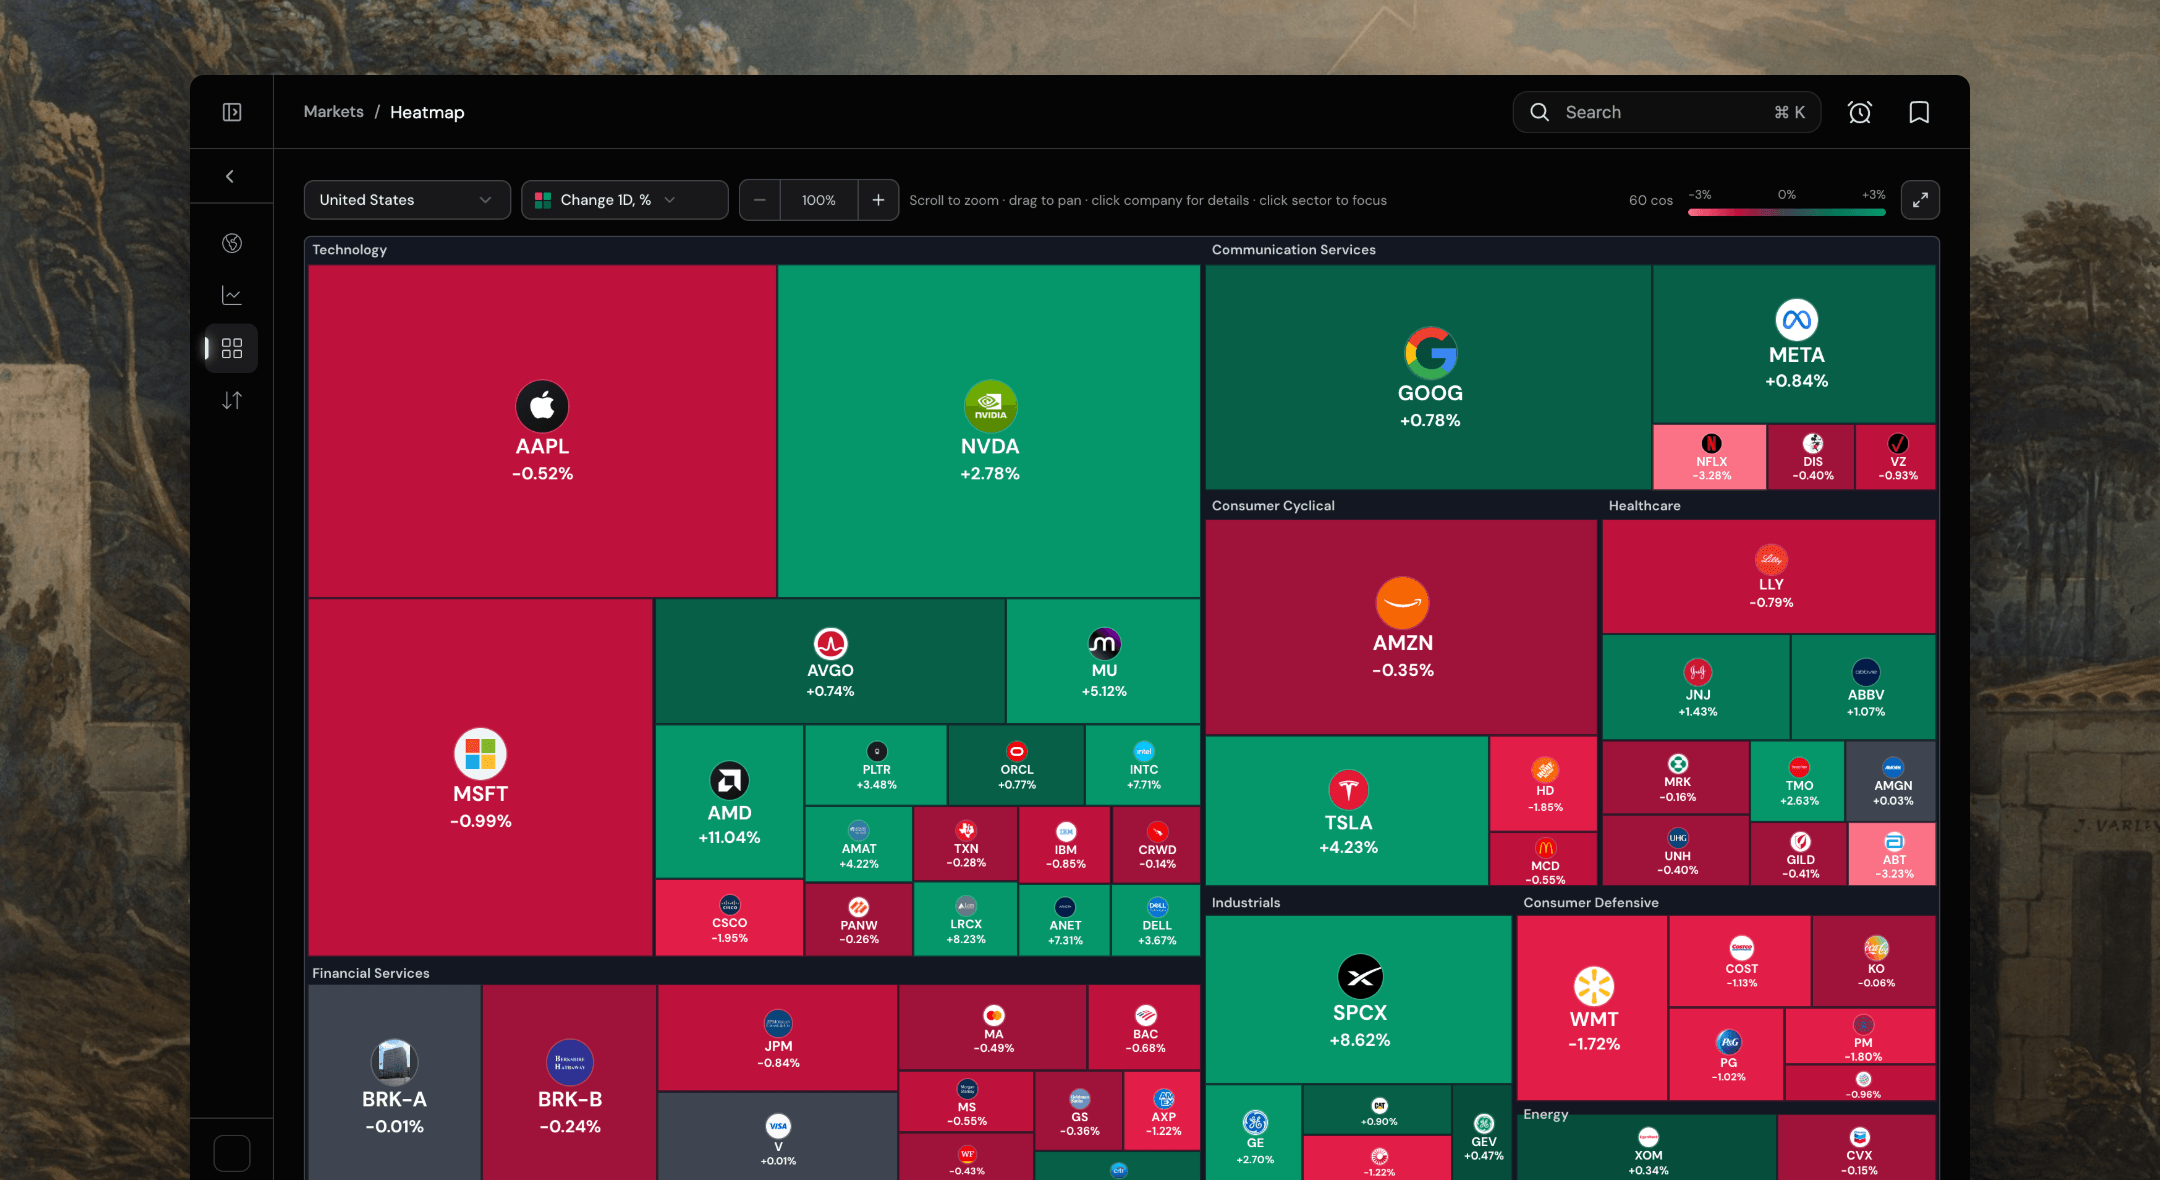
A market by sector and company, today, this quarter or this year.
Drill down
Click a sector to focus it and a company for its details, then zoom and pan.
Global
Heatmaps for the major stock markets.
News by market
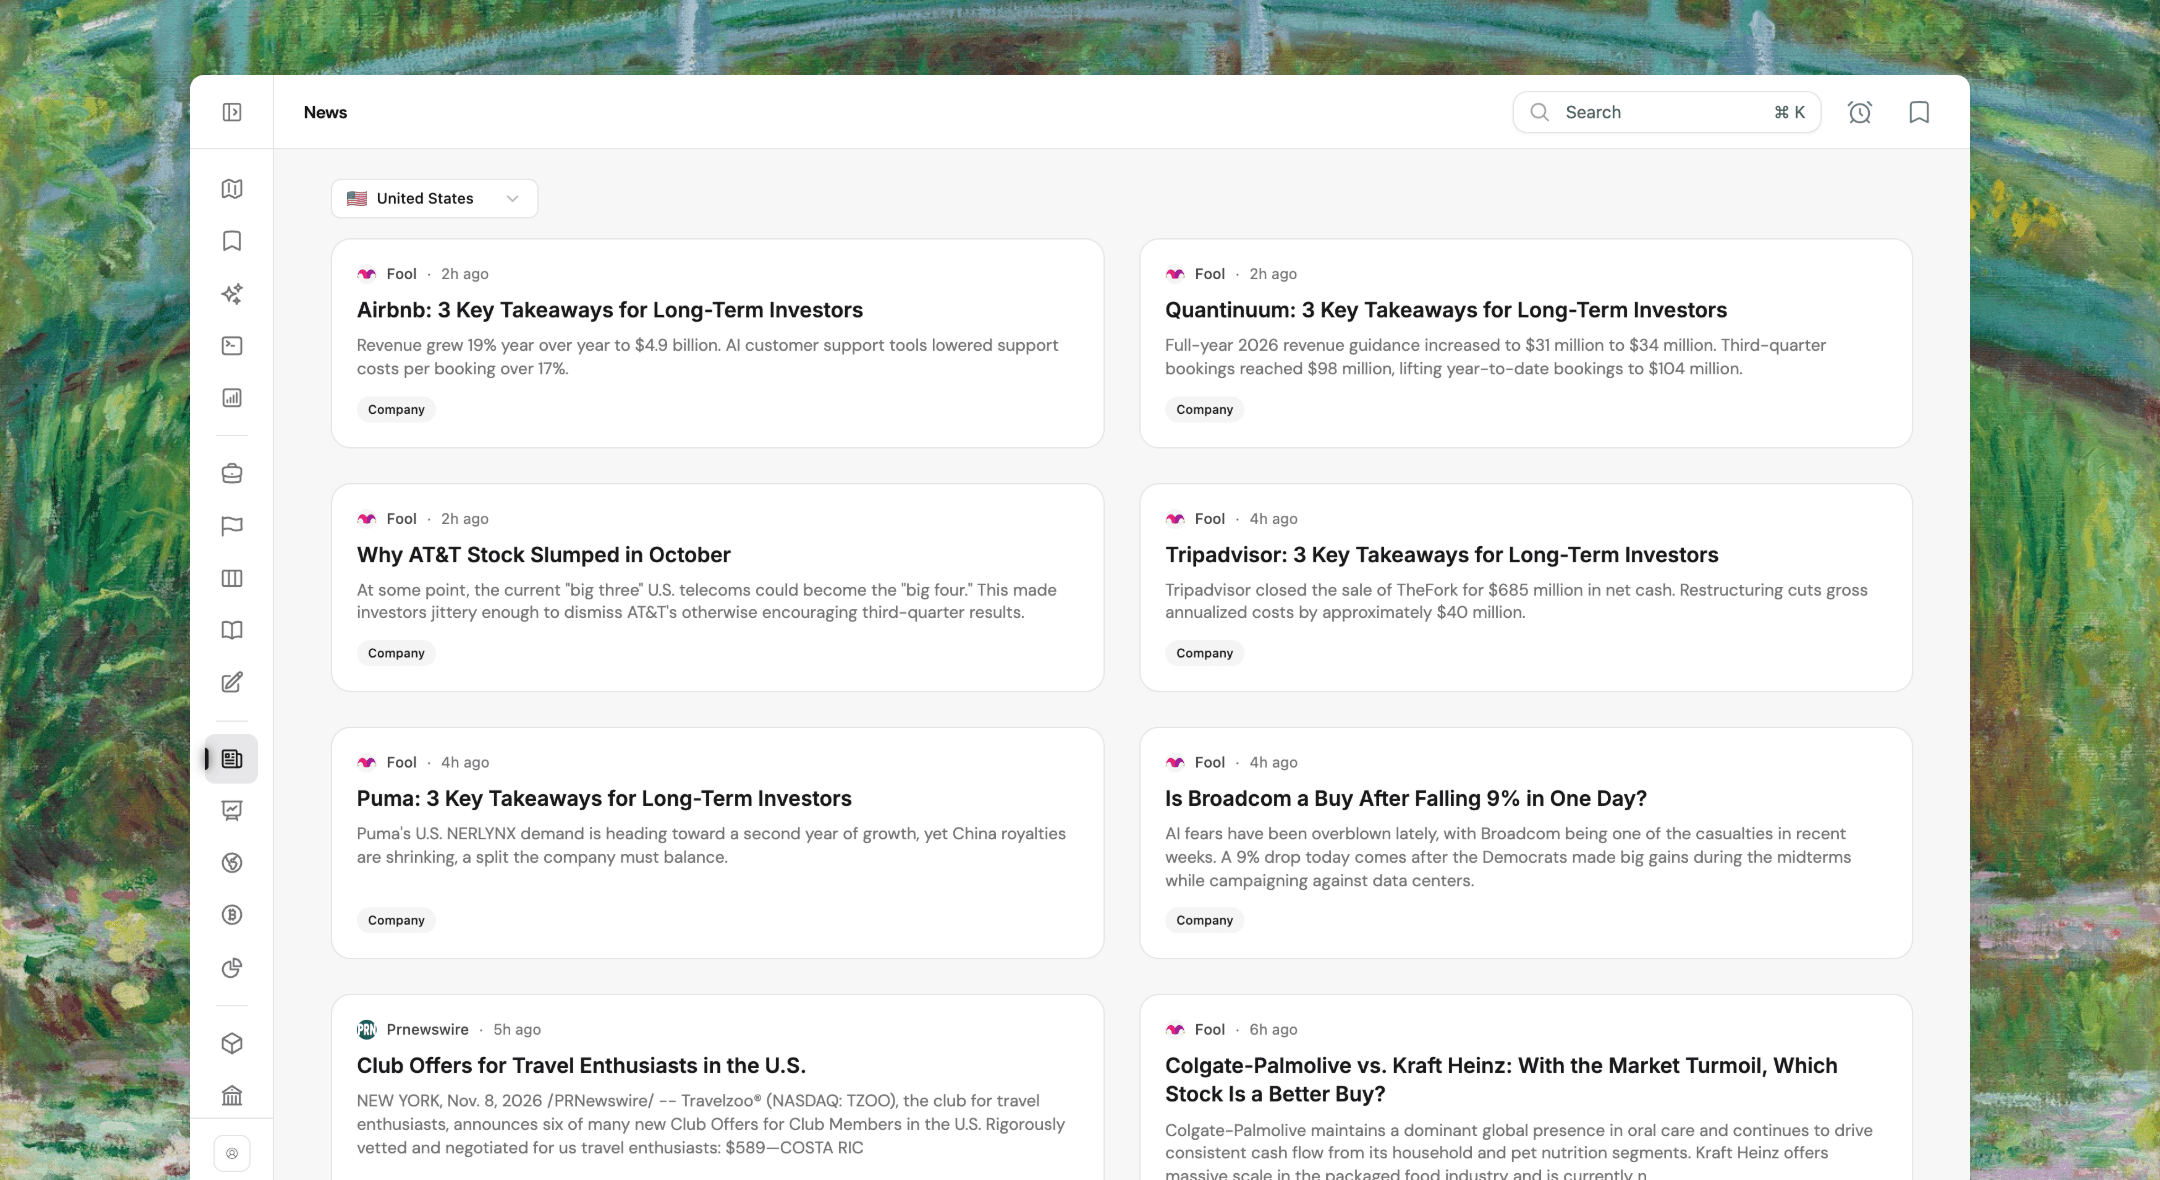
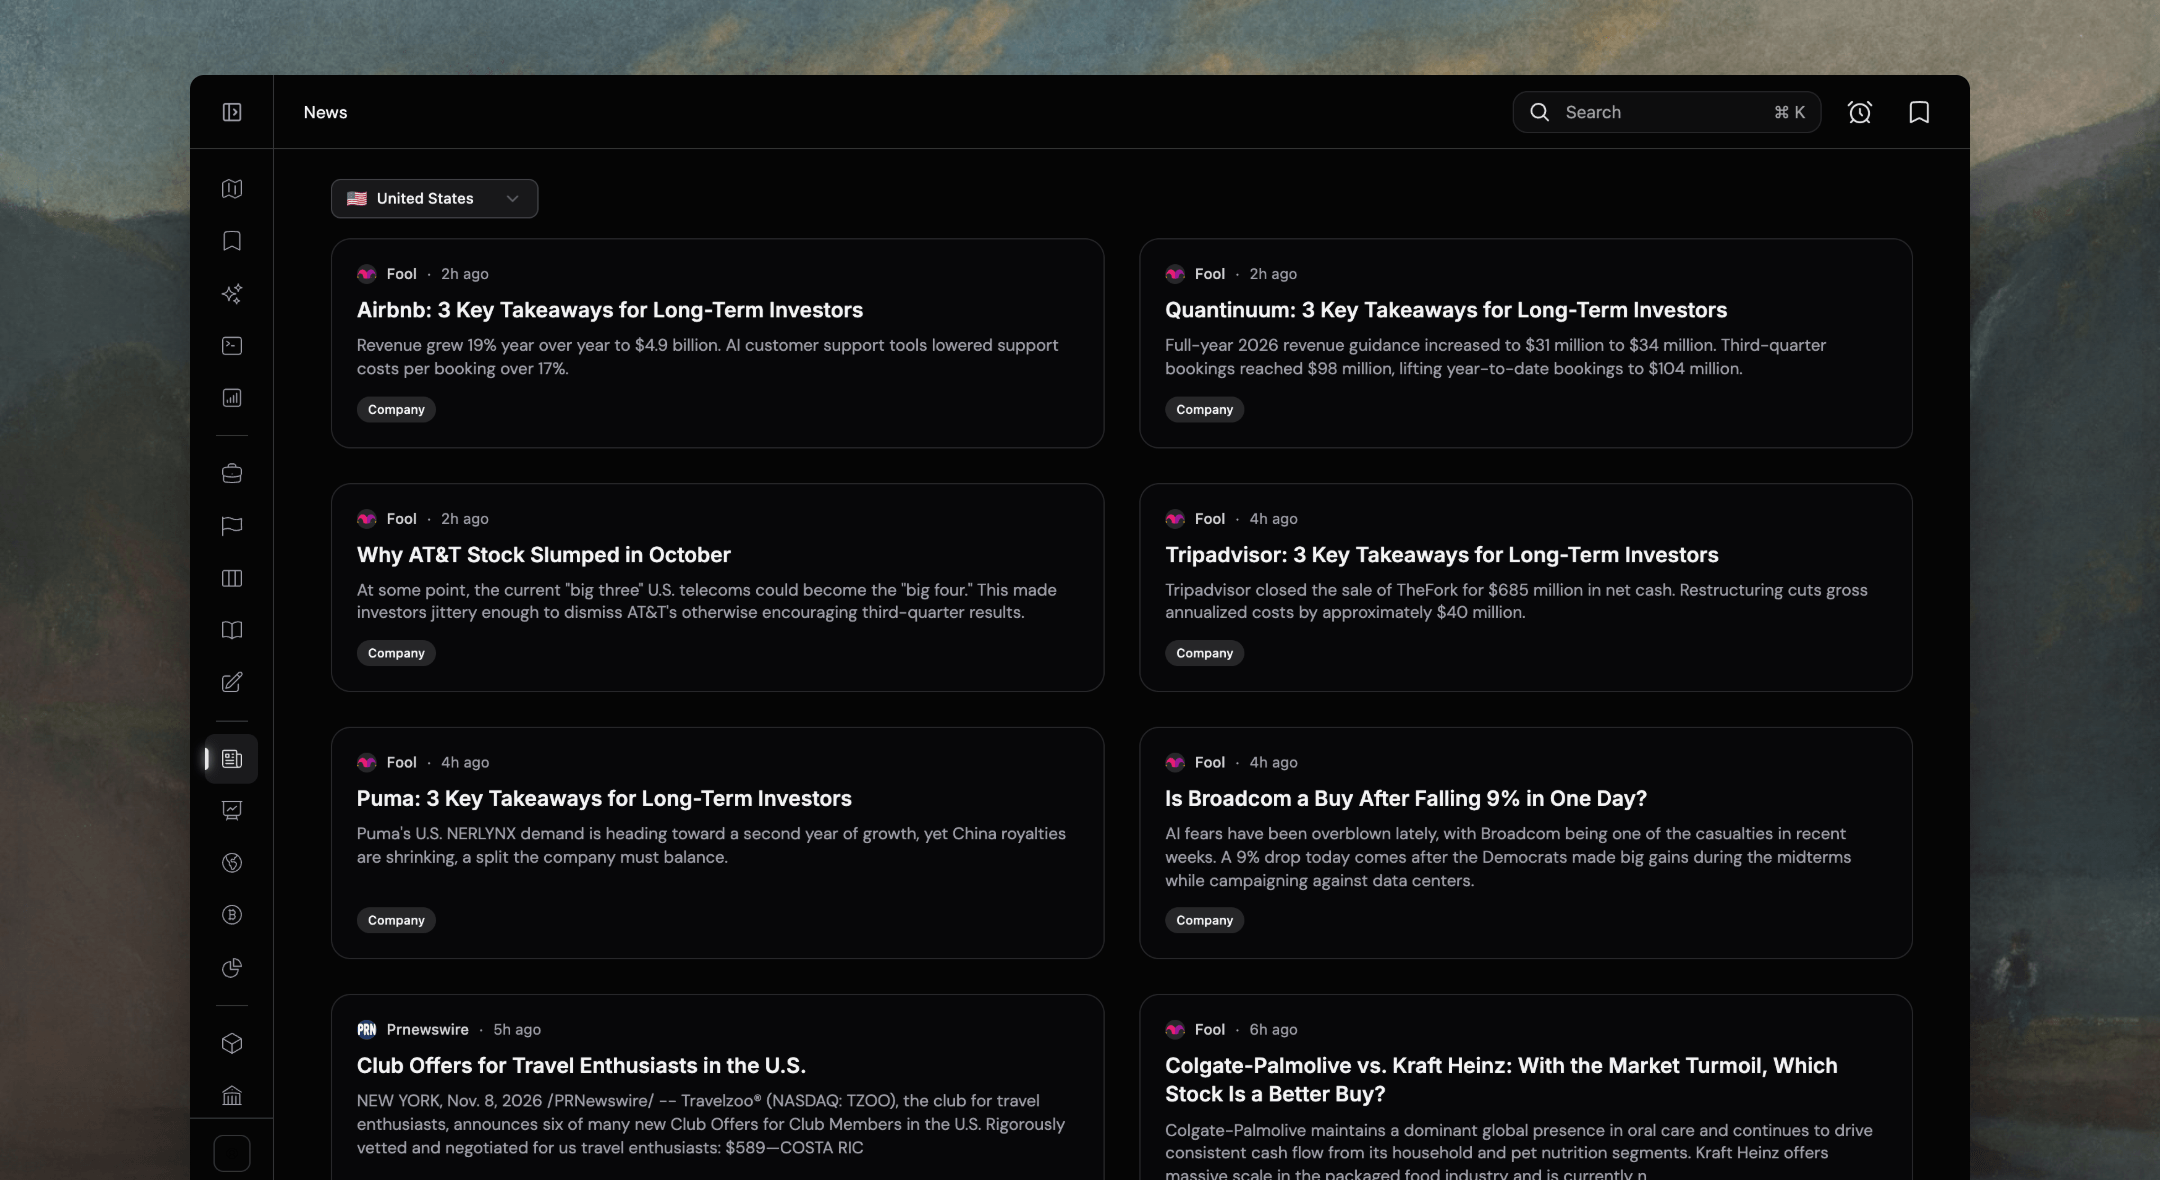
Pick a country and see the stories moving it, as they break.
The gist first
Every story with a short summary, so you can skim what matters.
On every company
Company and market news tagged, and each company’s news beside its numbers.
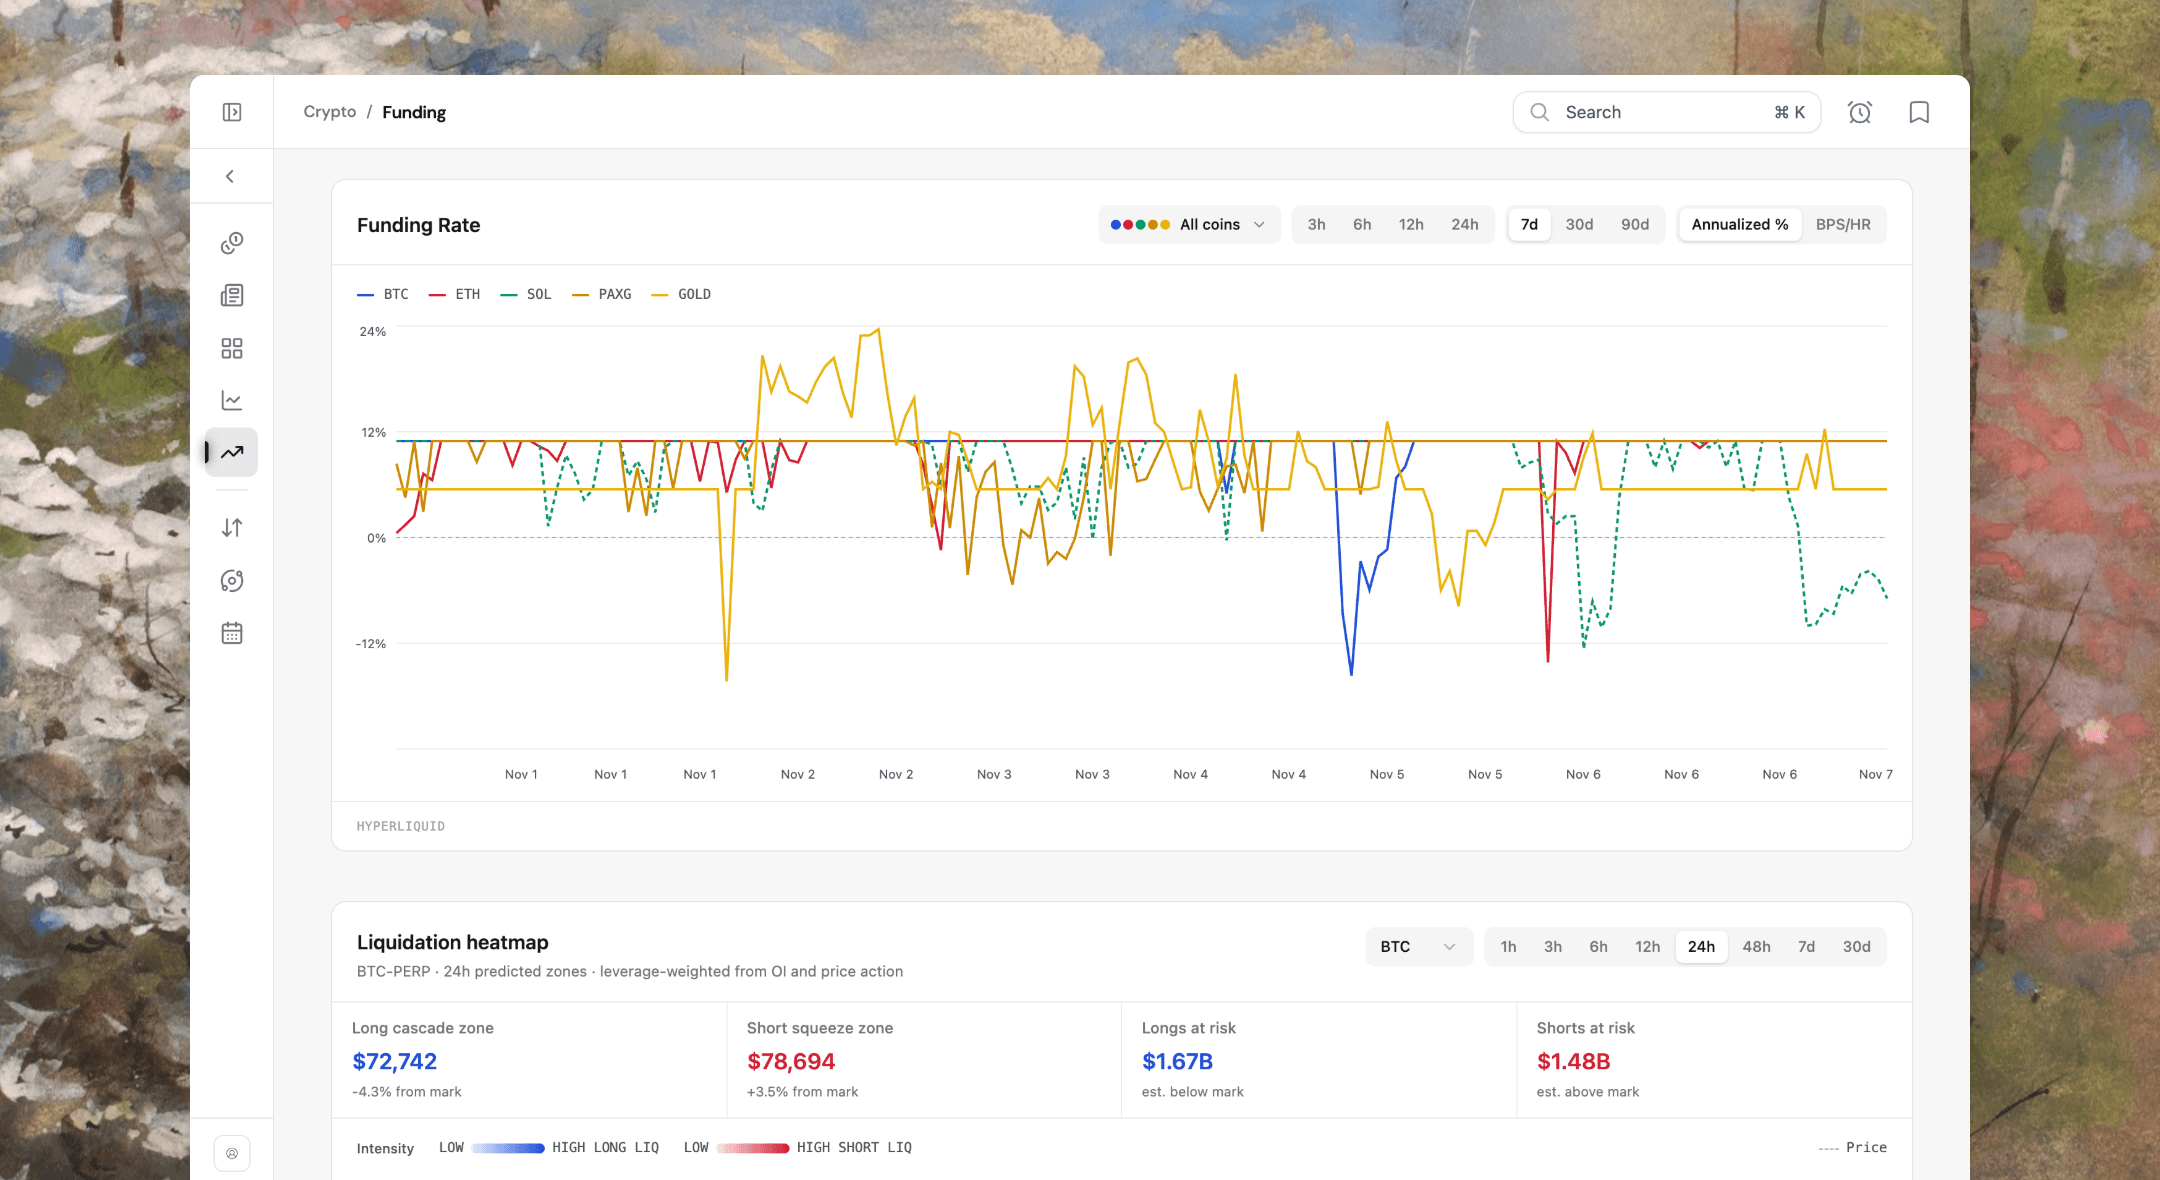
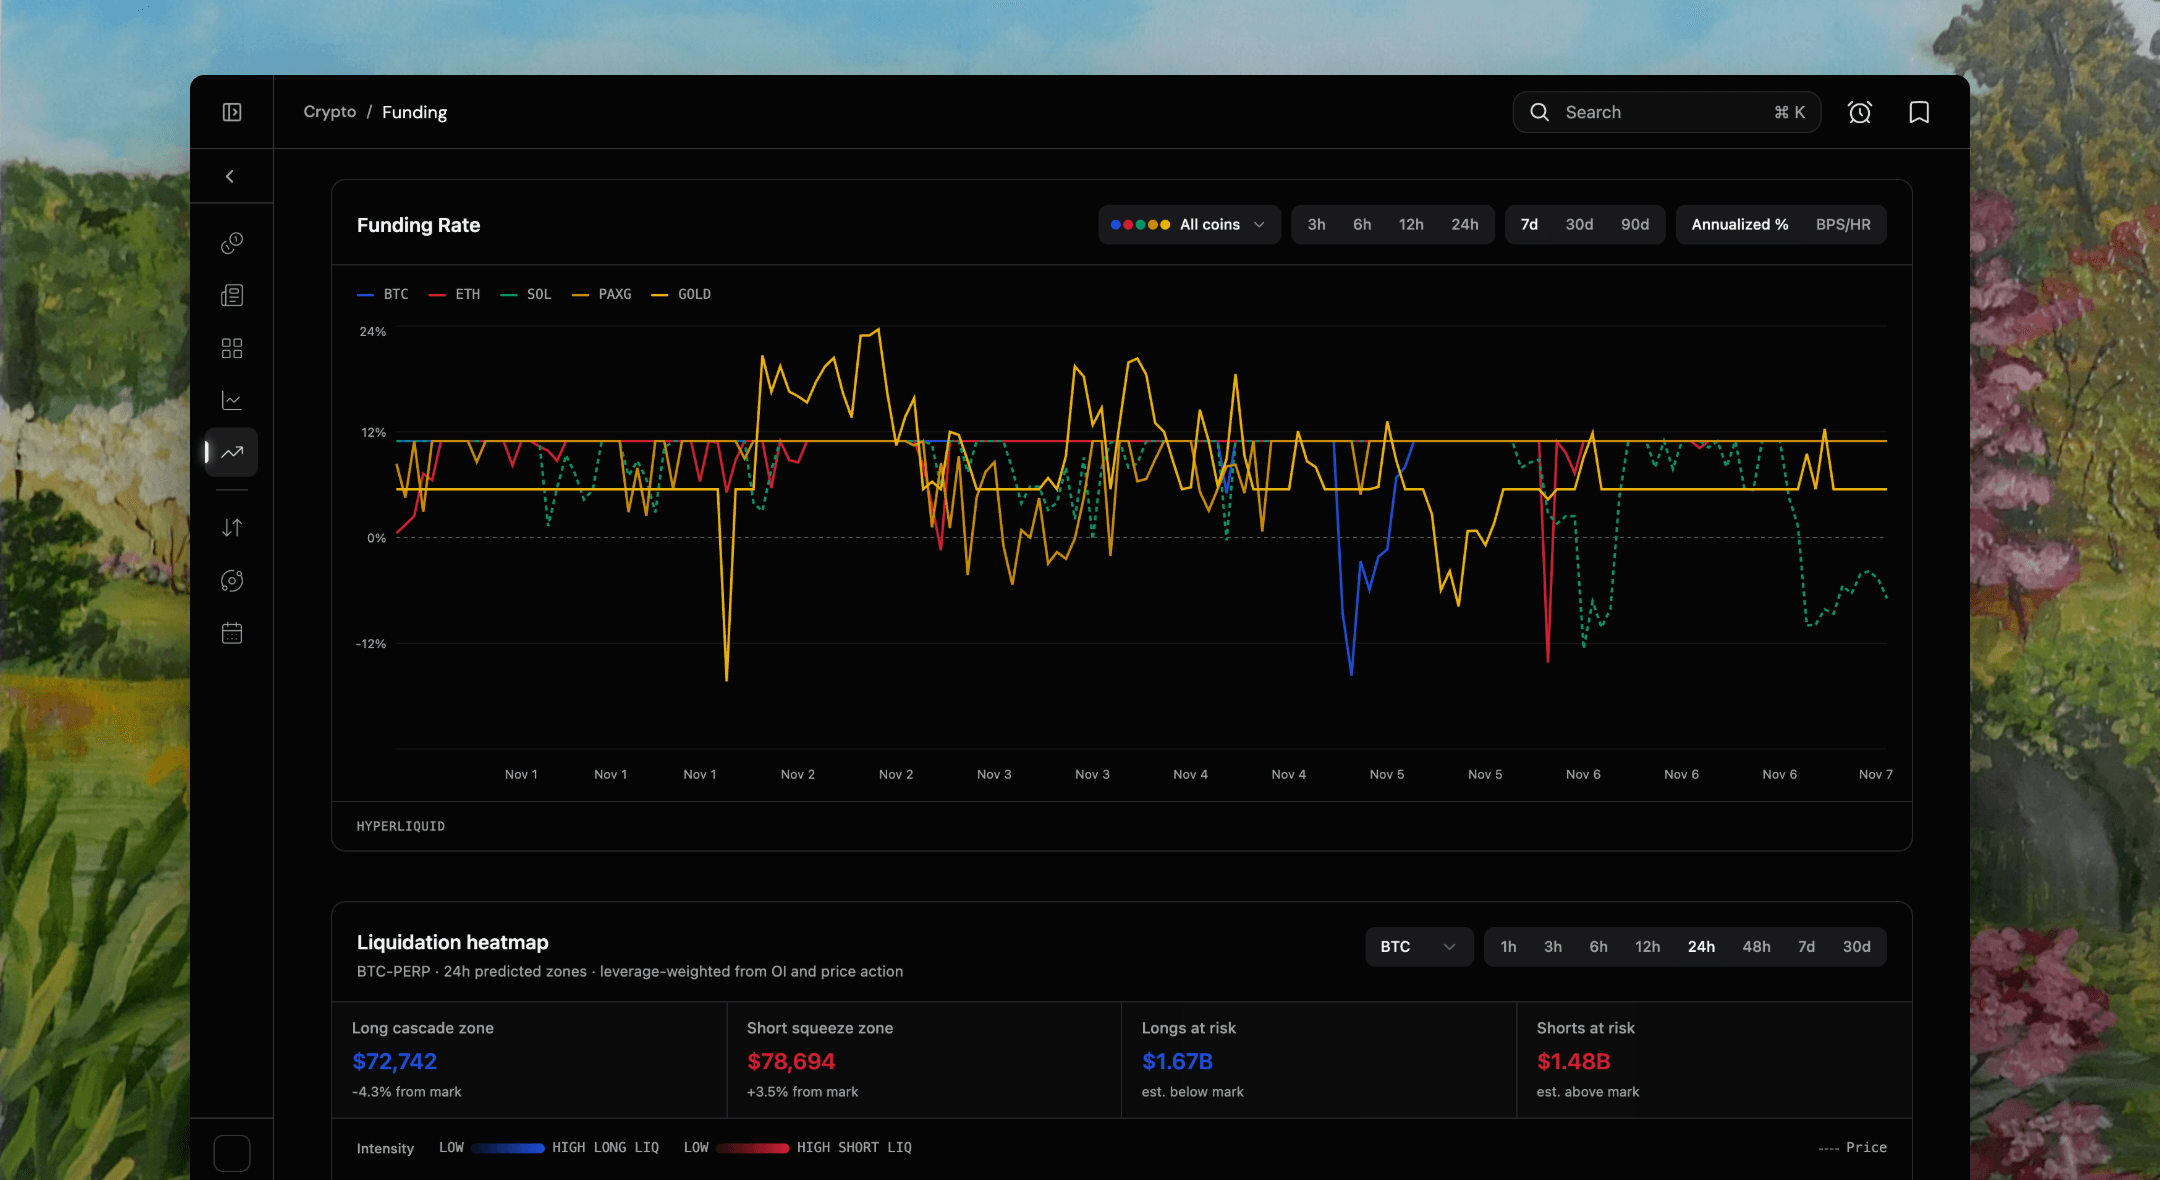
Funding and liquidations
Funding rates, a liquidation heatmap, open interest and spot-versus-perp basis.
Capital flows
Spot ETF flows, exchange netflow, stablecoin supply and company treasuries.
Cycle and calendar
MVRV Z-score, NUPL and realized price, plus token unlocks and options expiries.
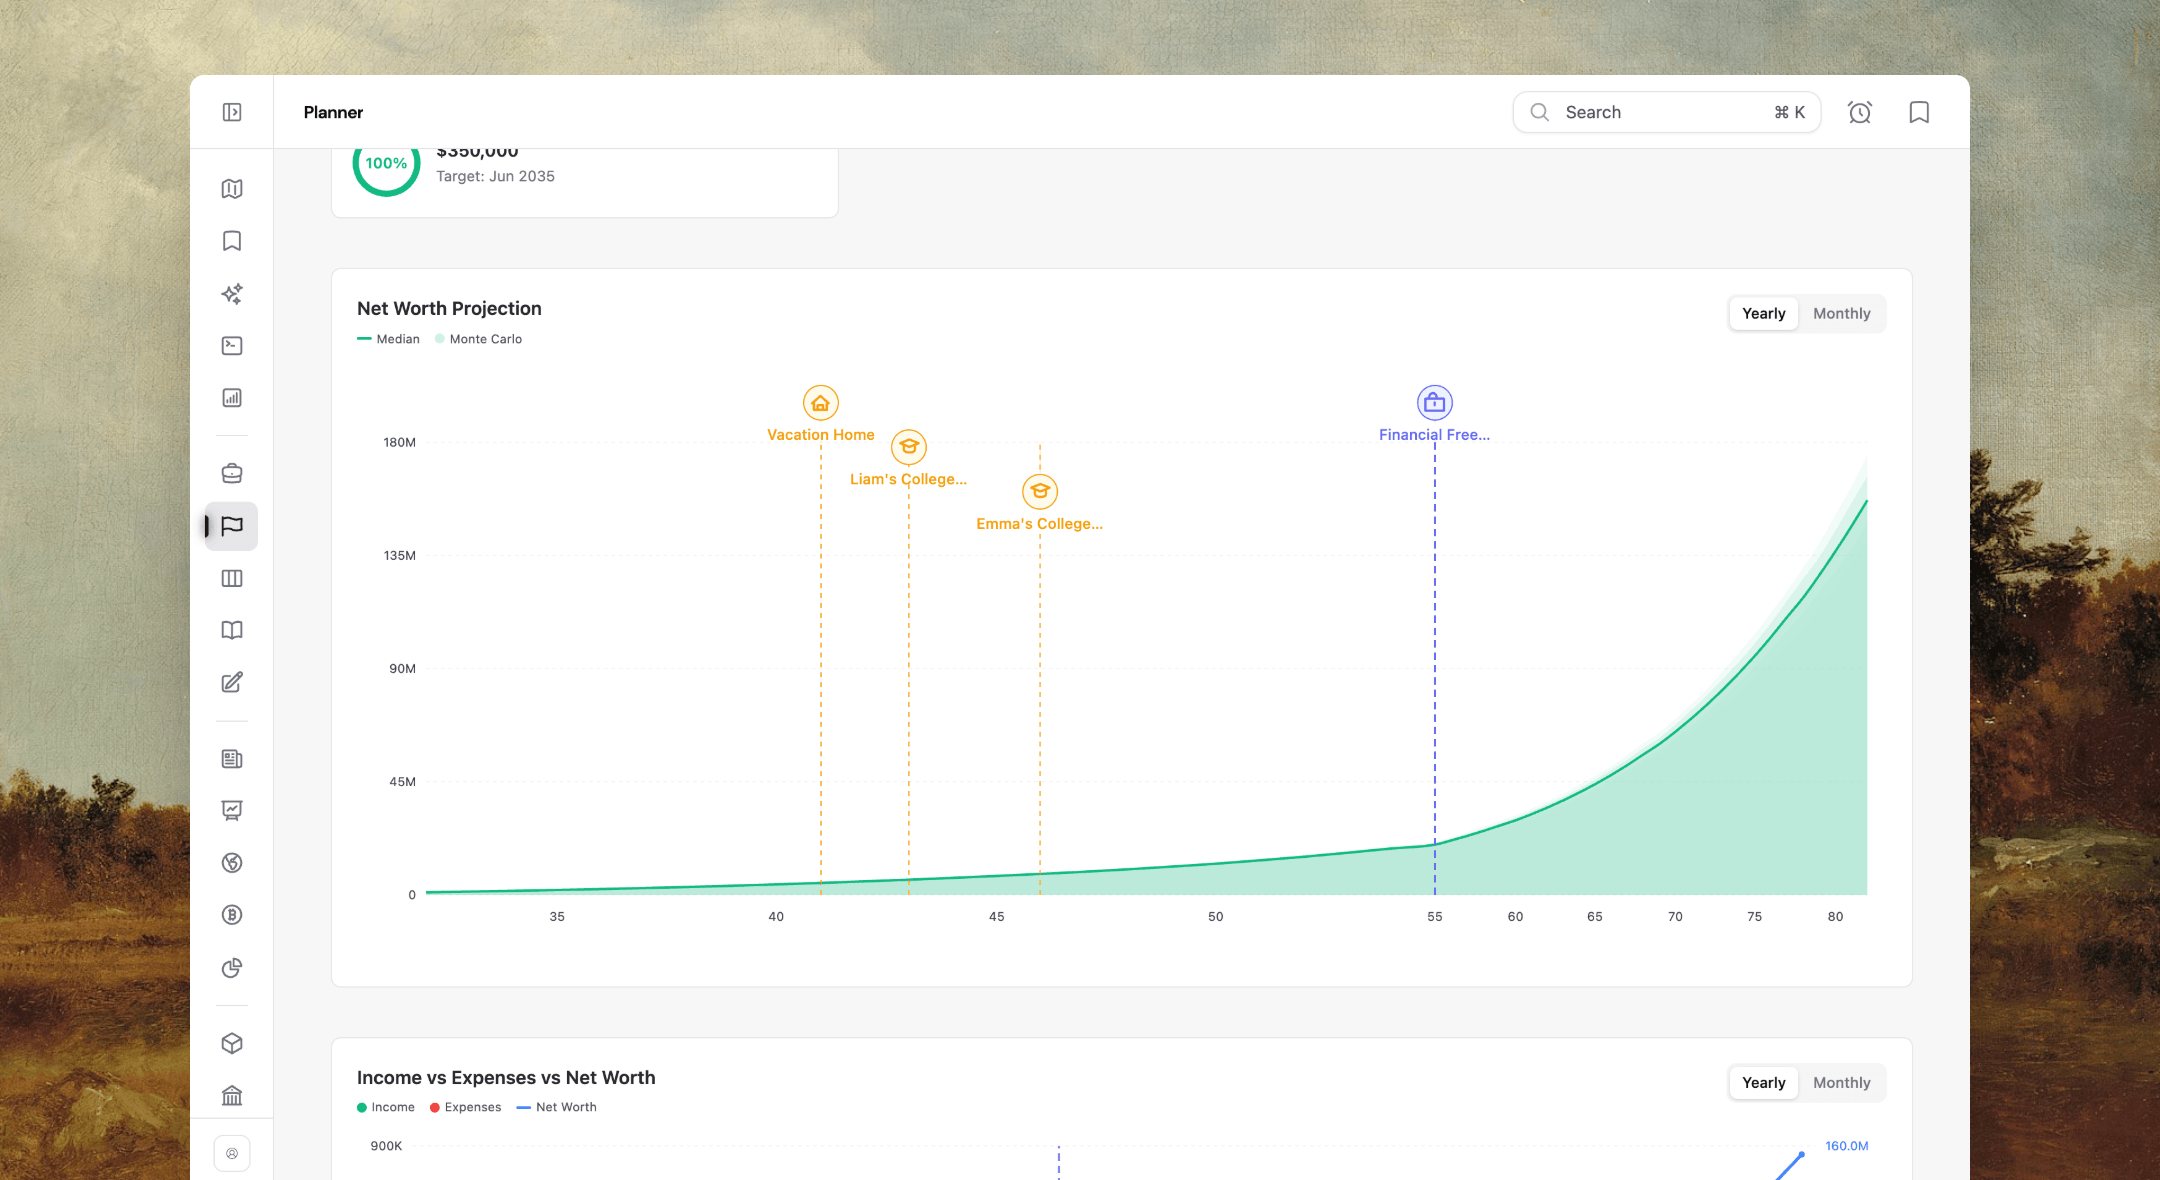
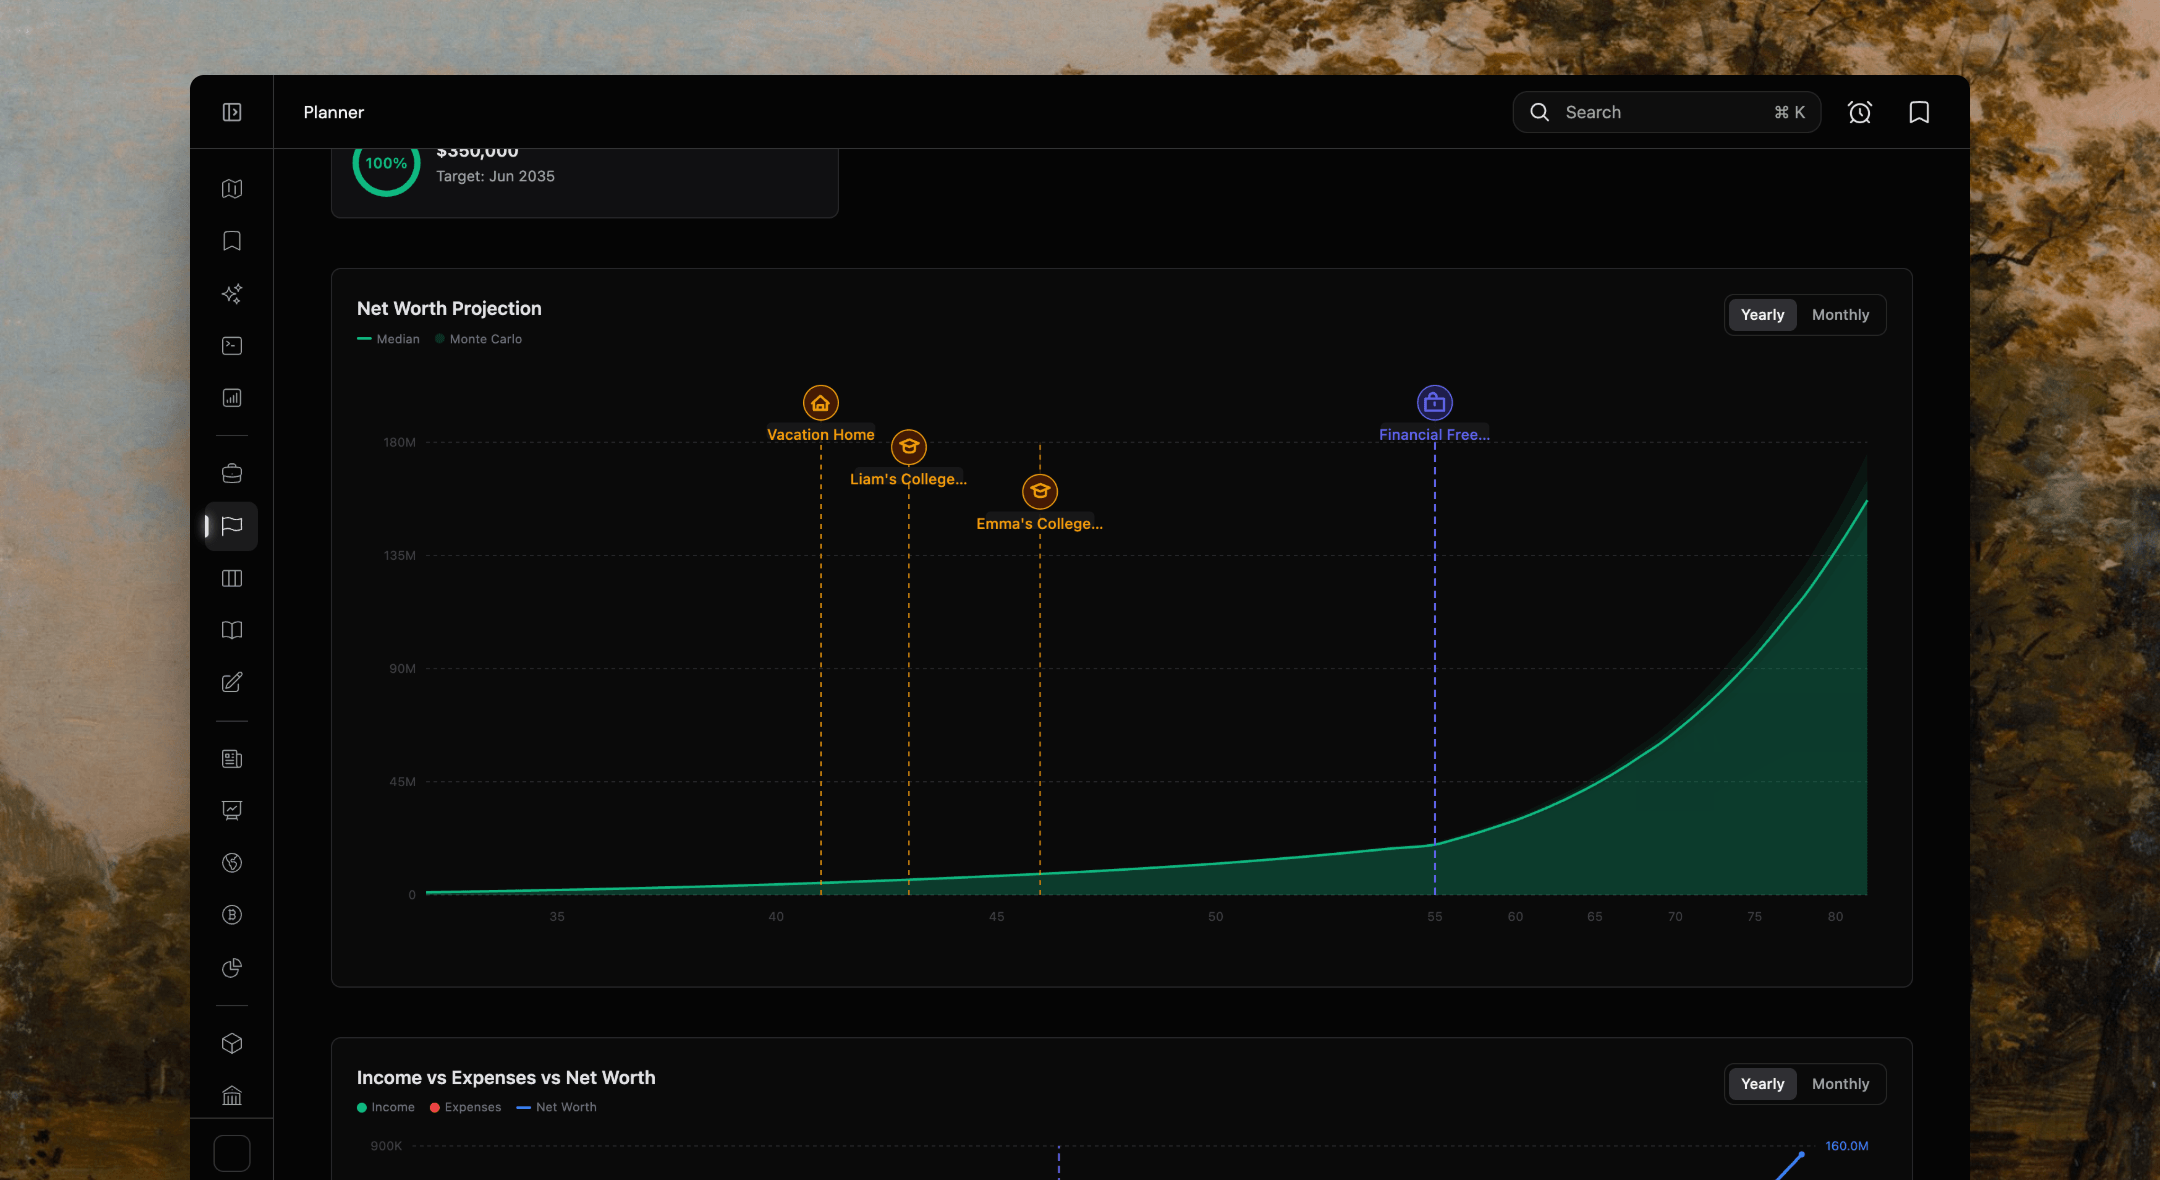
Net worth through retirement
A Monte Carlo projection with your goals on the timeline.
Cashflow and family
A Sankey of income and spending, with kids’ costs by age.
Goals that keep score
Every goal scored on track or off track against the plan.
P&L calendar
Daily, weekly and monthly P&L, with each period’s trades and win rate.
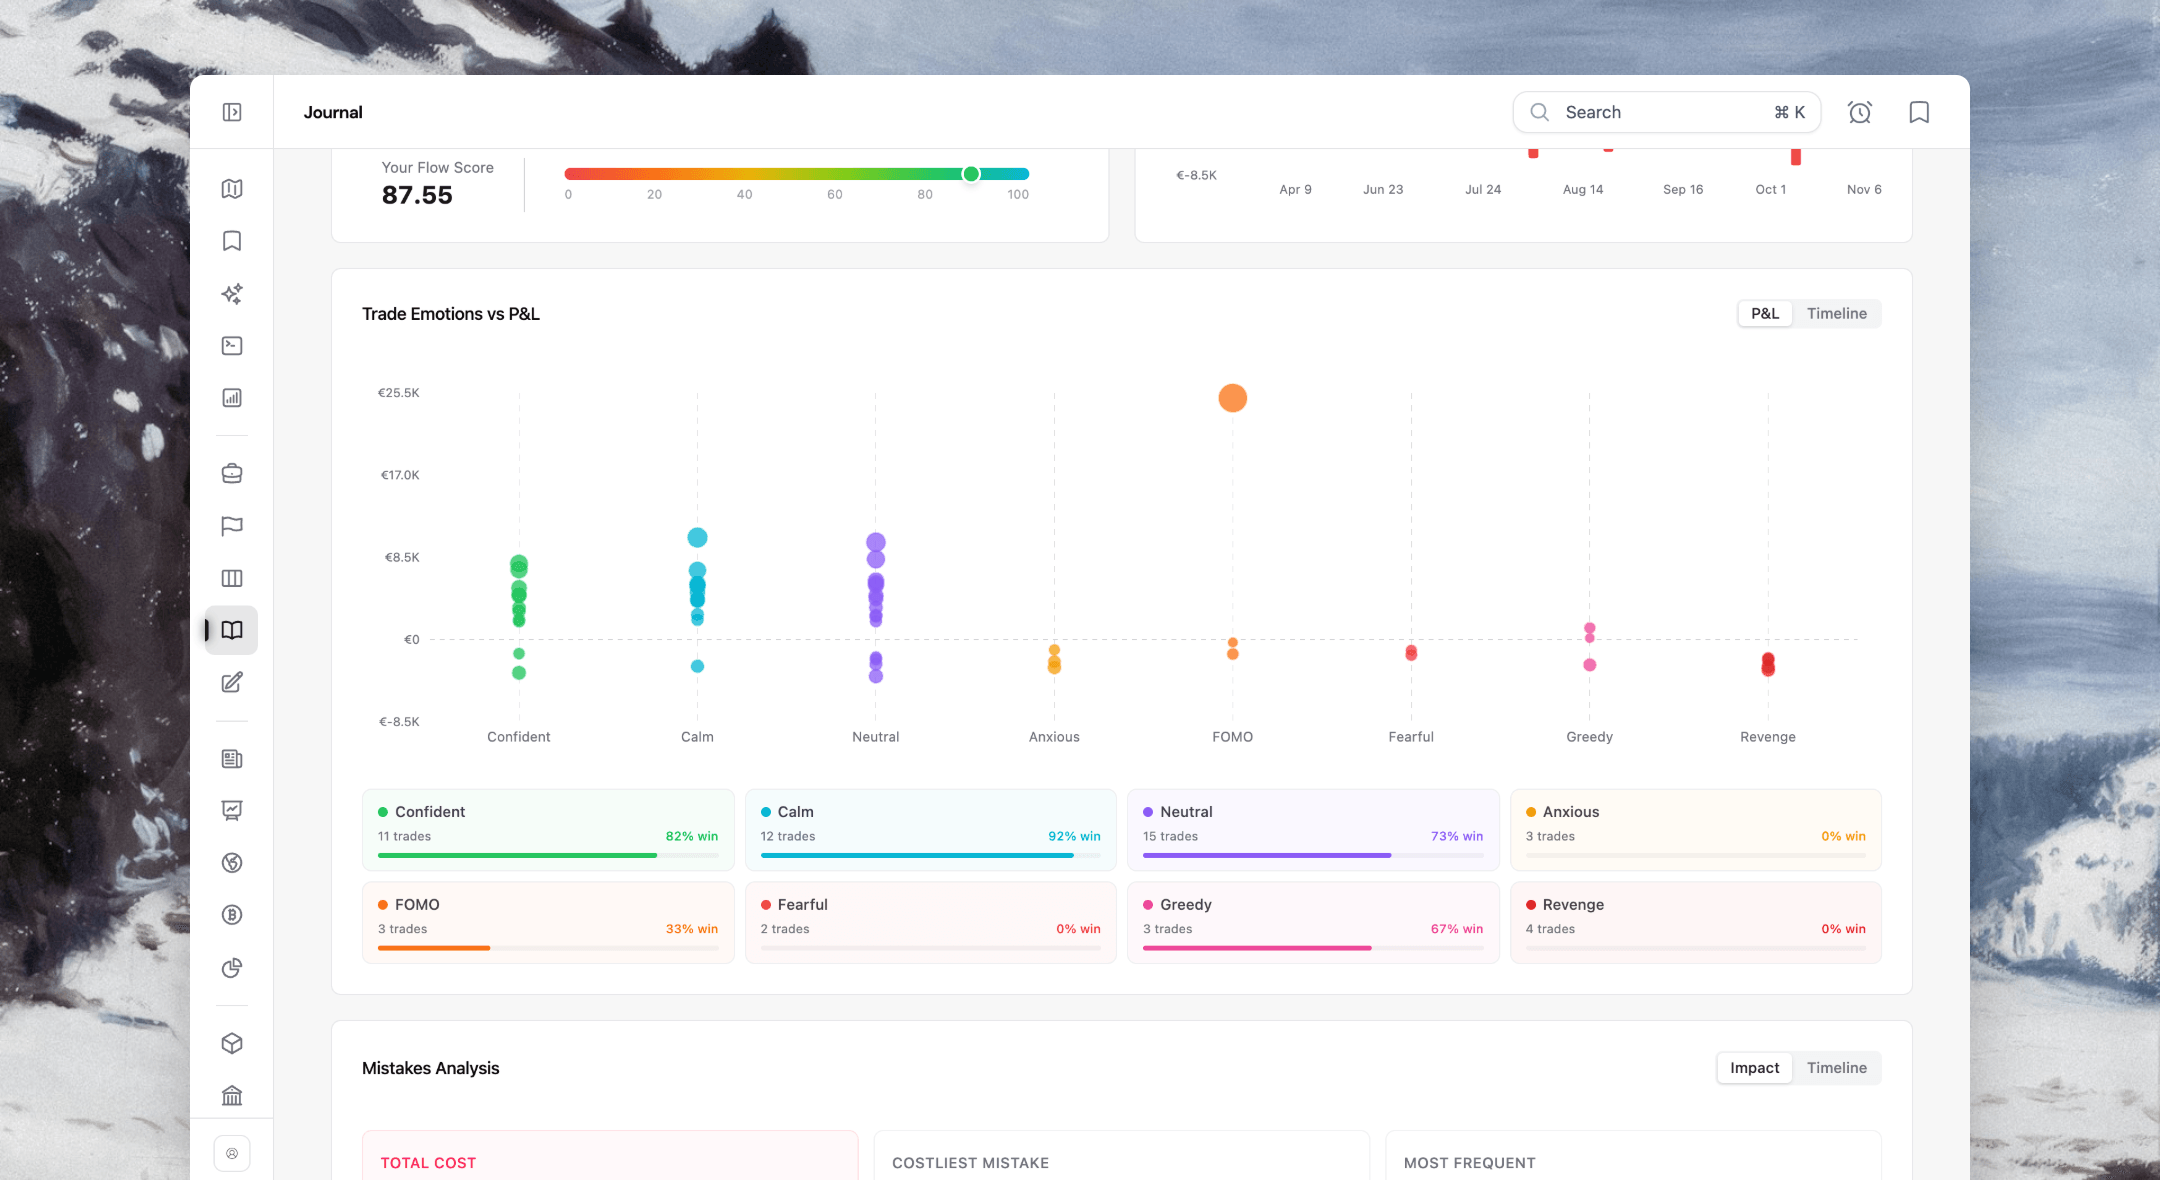
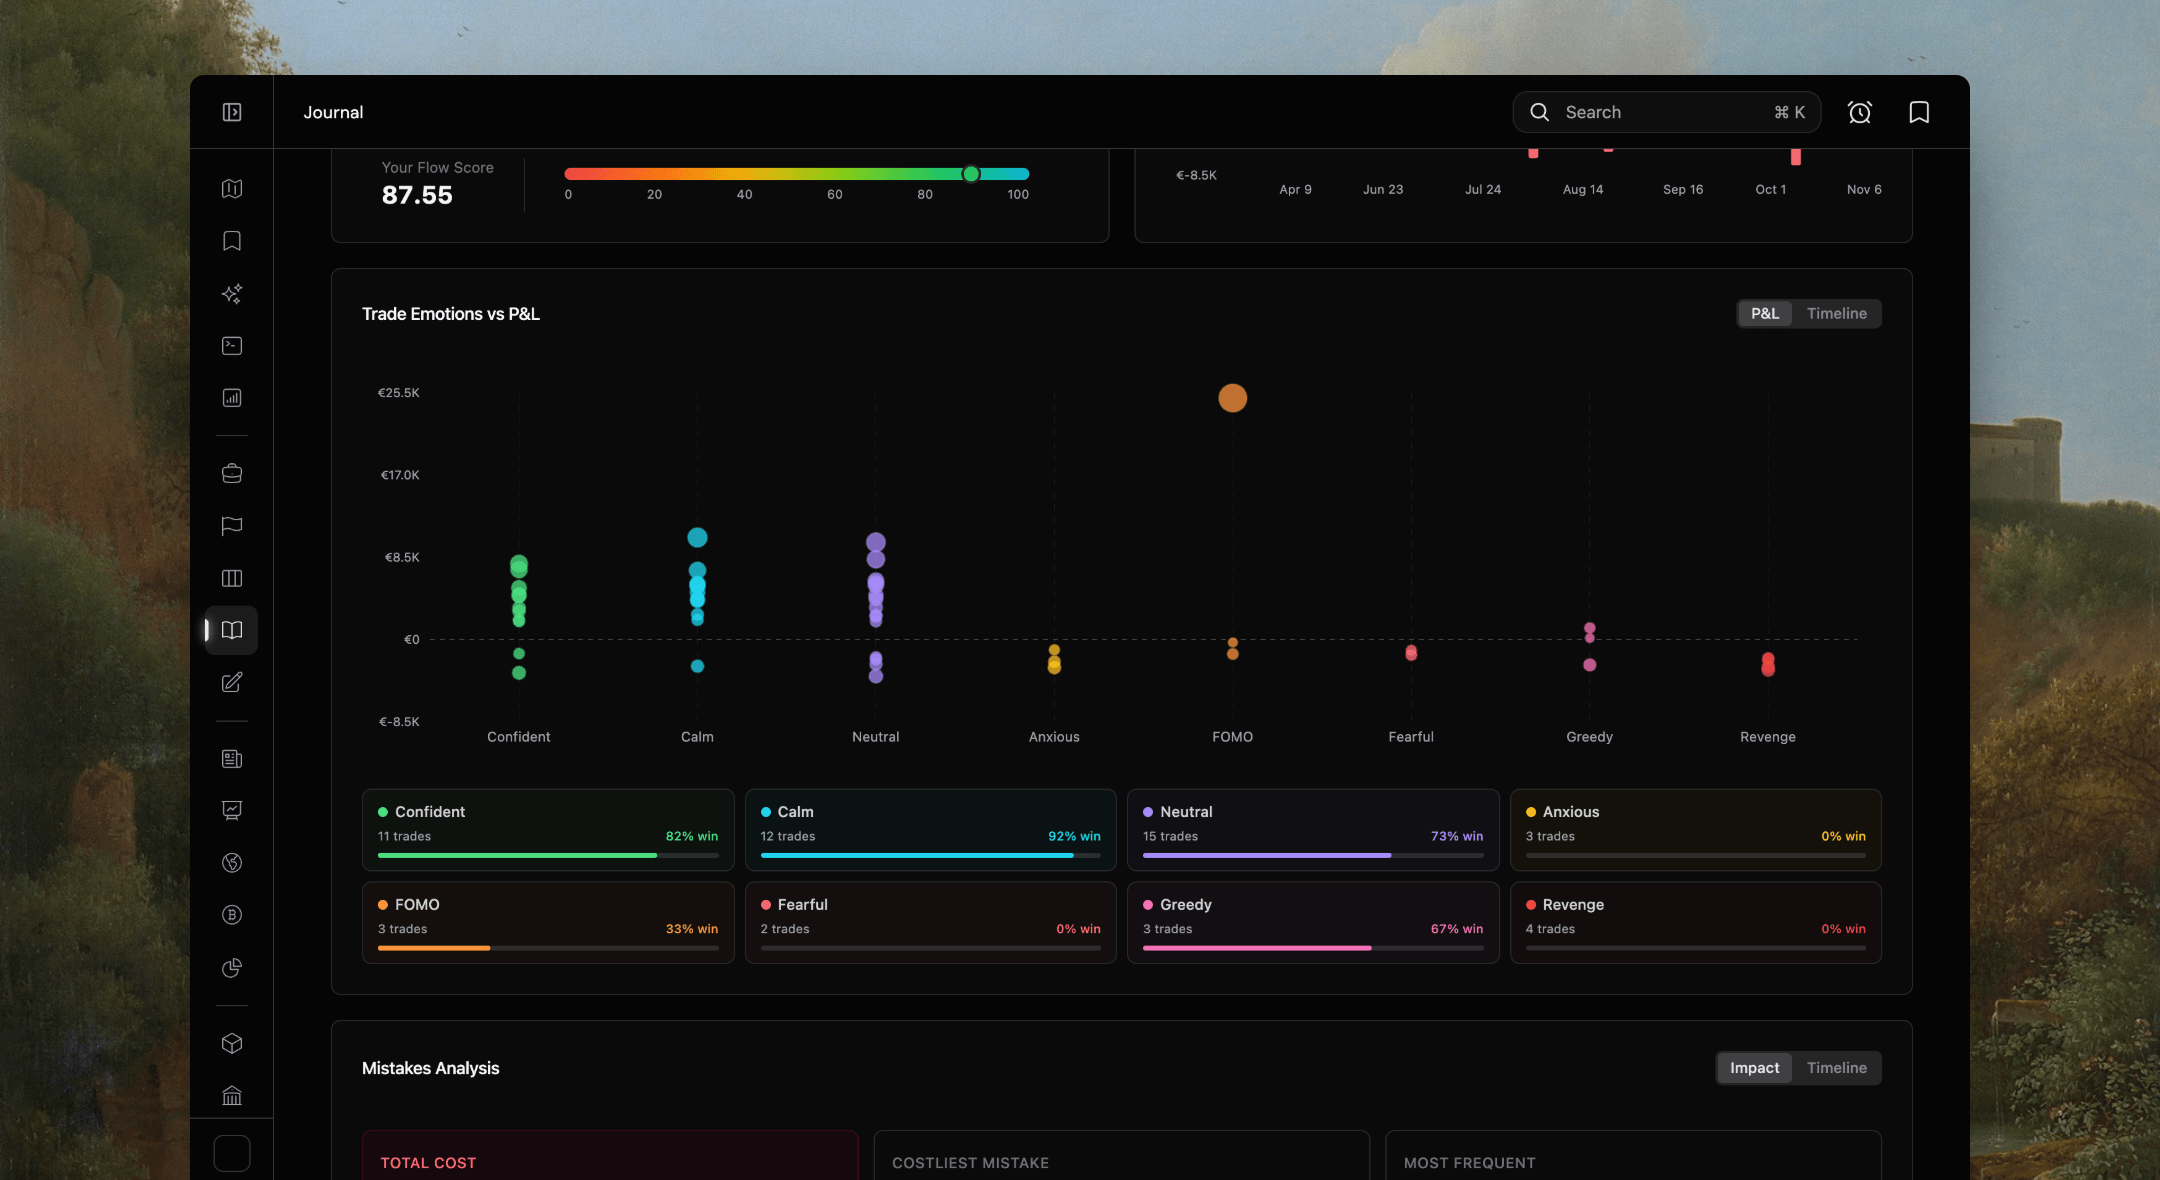
Emotions and mistakes
See which moods and mistakes made money, and which cost it.
Flow Score
Win rate, profit factor, drawdown, recovery and consistency in one score.
Describe the idea. Amsflow builds it.
Strategies, screens, alerts and research across 70,000+ global stocks, from one sentence. Then chart it, backtest it and track it in the same place.
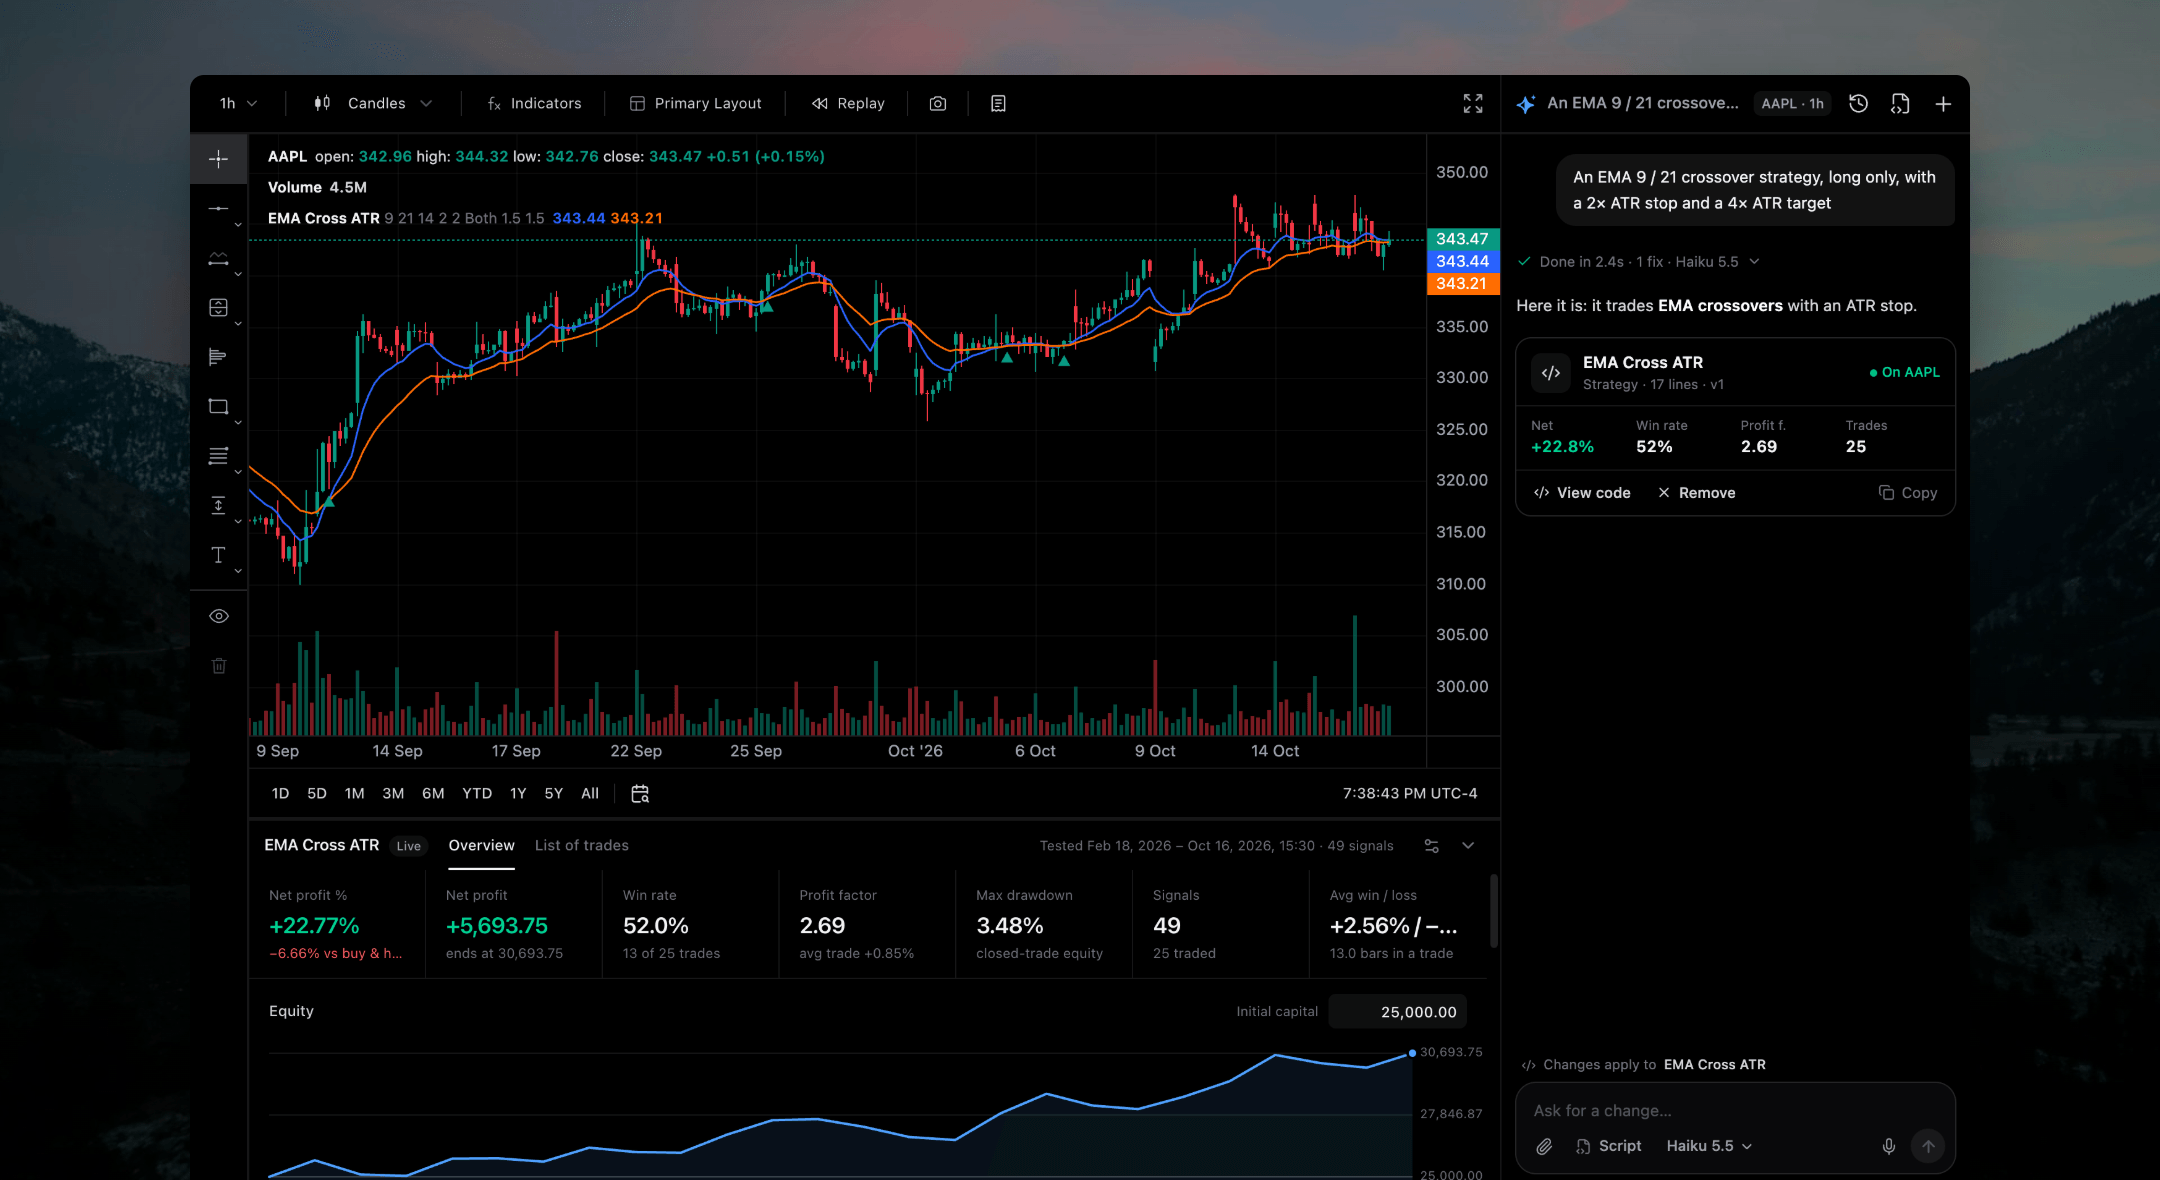
Written, checked and backtested in 2.4 seconds
Written, checked and backtested in 2.4 seconds
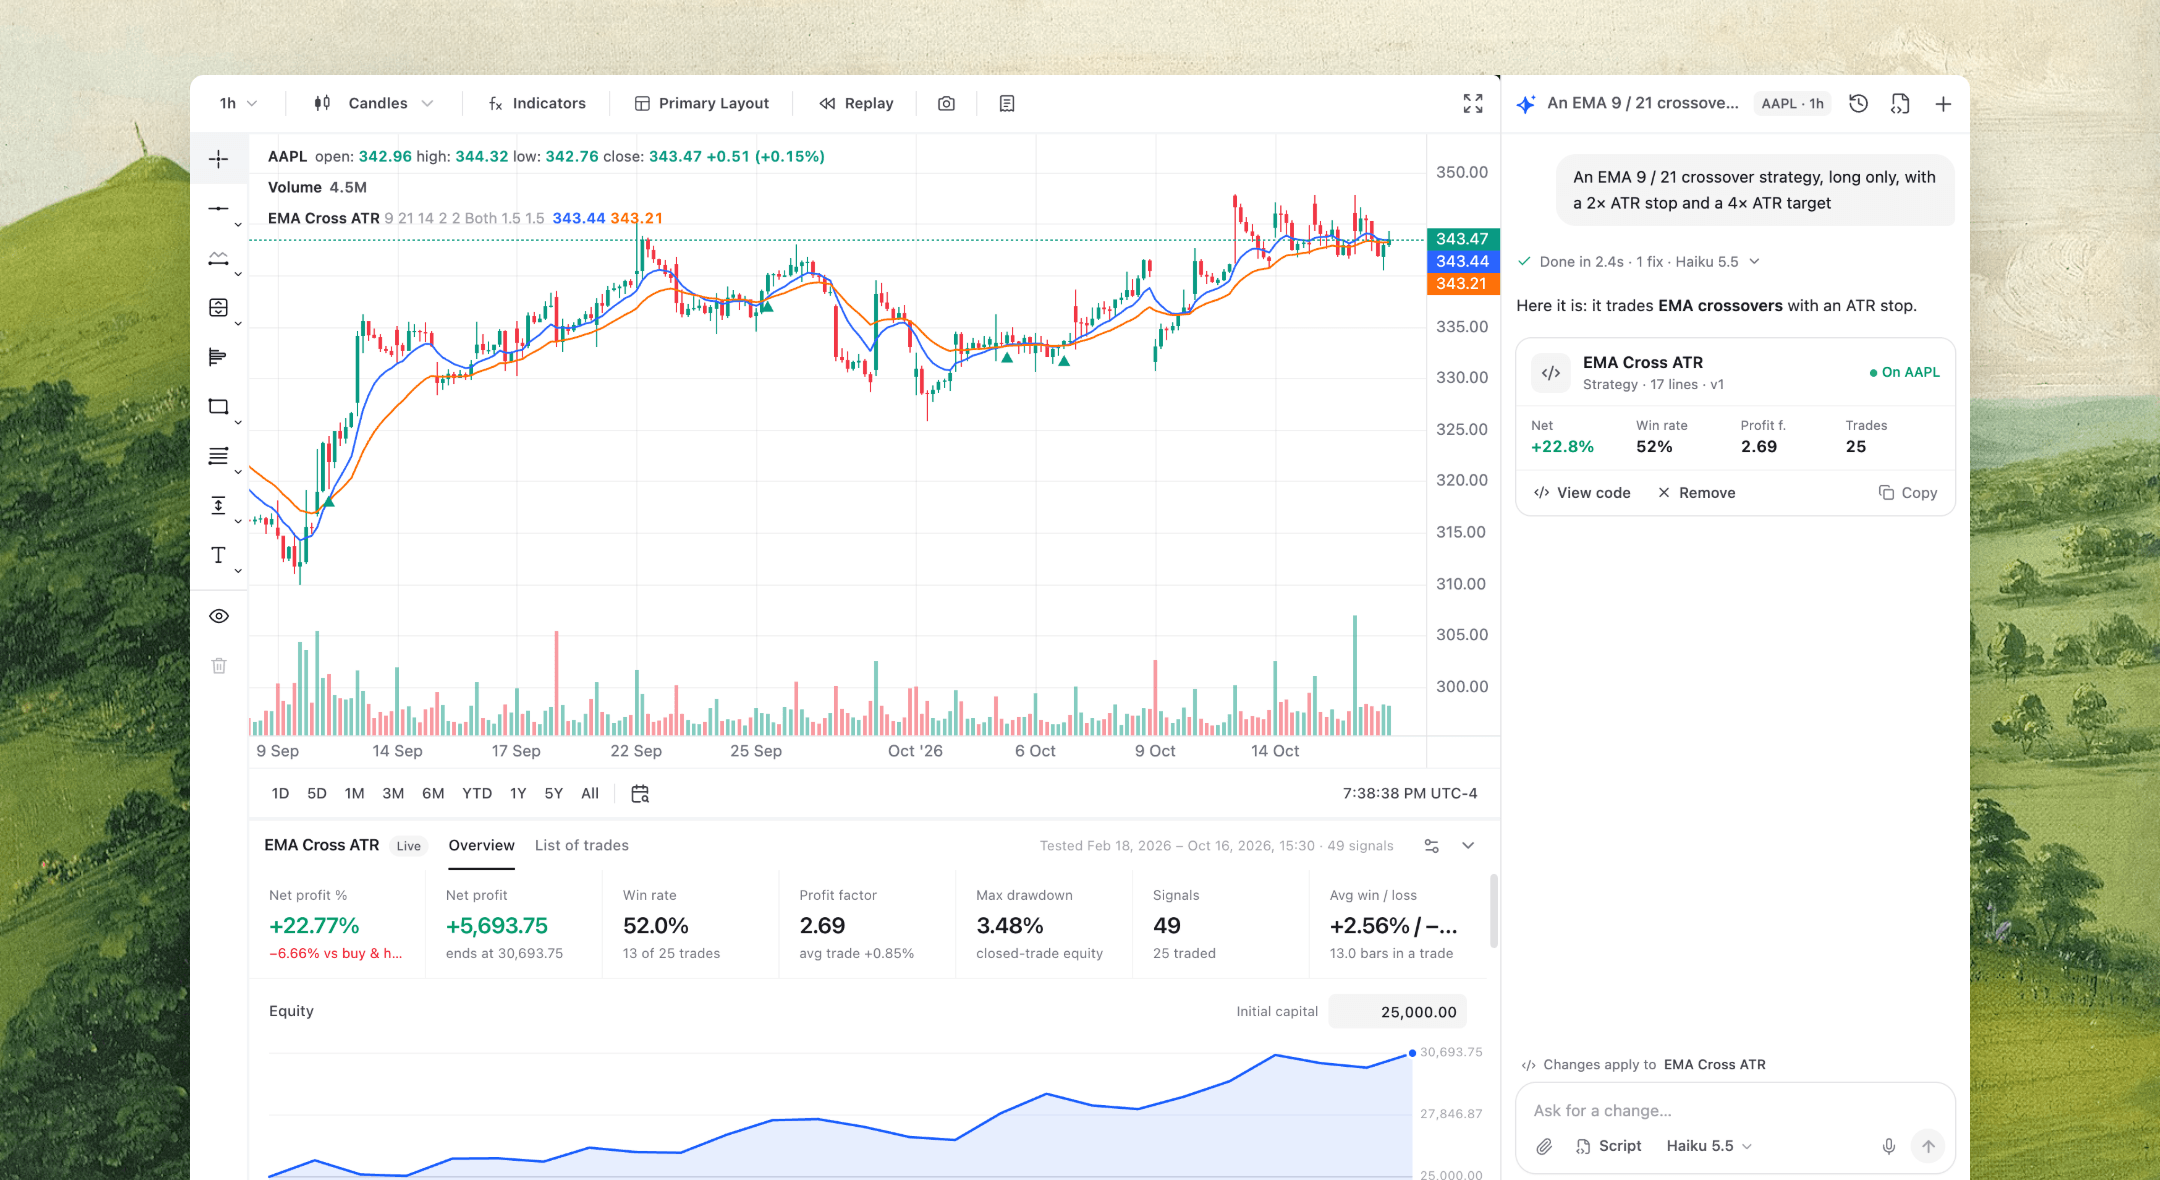
Most platforms show you the market. Amsflow lets you question it. Screen an idea, see it on the chart, test it on history and get told when it happens, on one set of data, in one place.
Flow Agent
Describe a strategy. Get it built, backtested and improved.
Flow Agent writes the script, fixes its own errors, tests it with no look-ahead, then reviews the backtest and refines the strategy for up to six rounds. All on a chart engine we built ourselves.
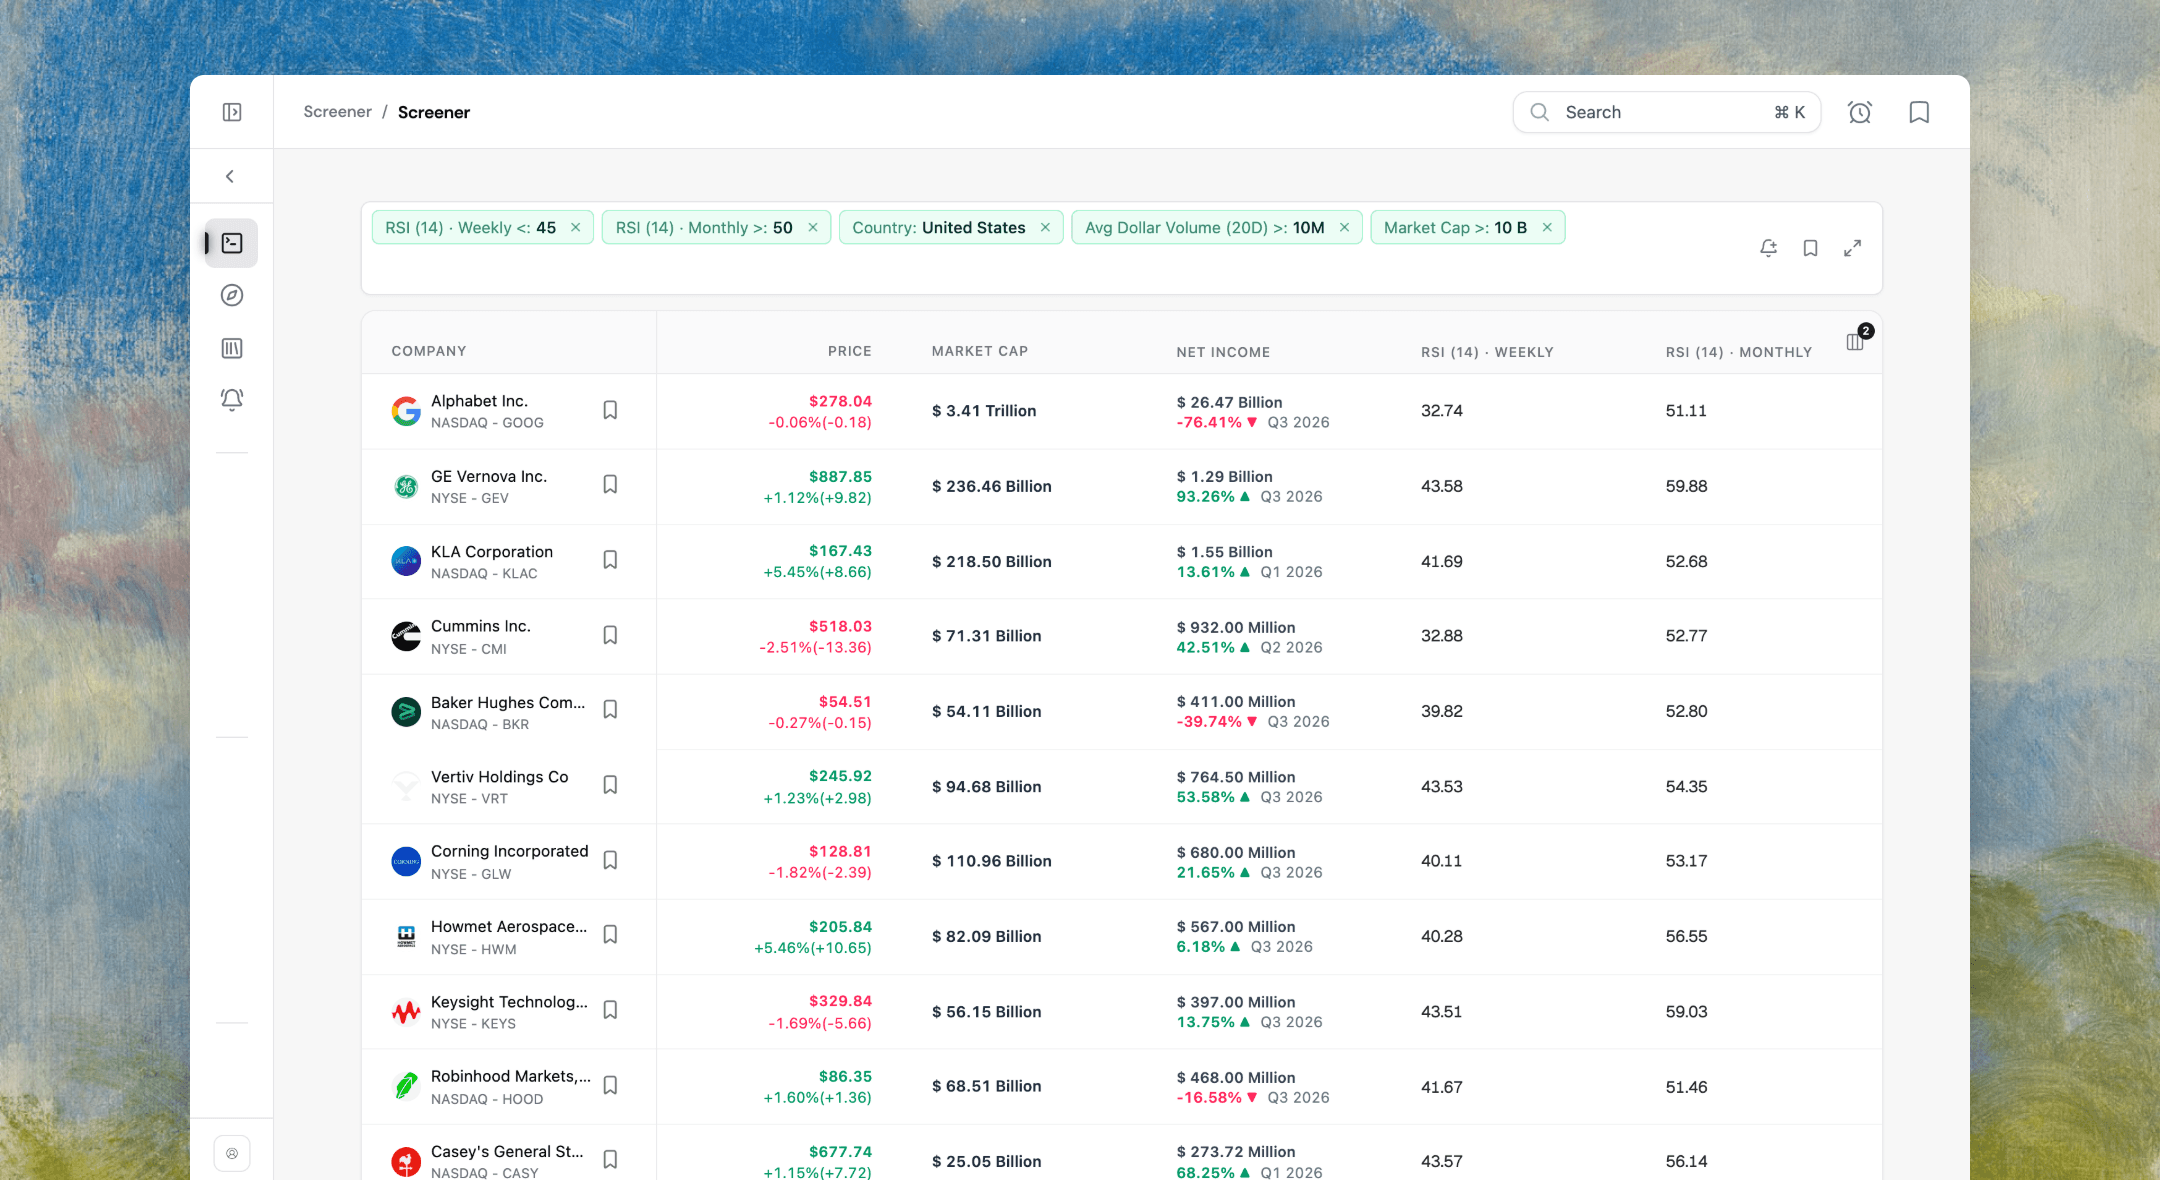
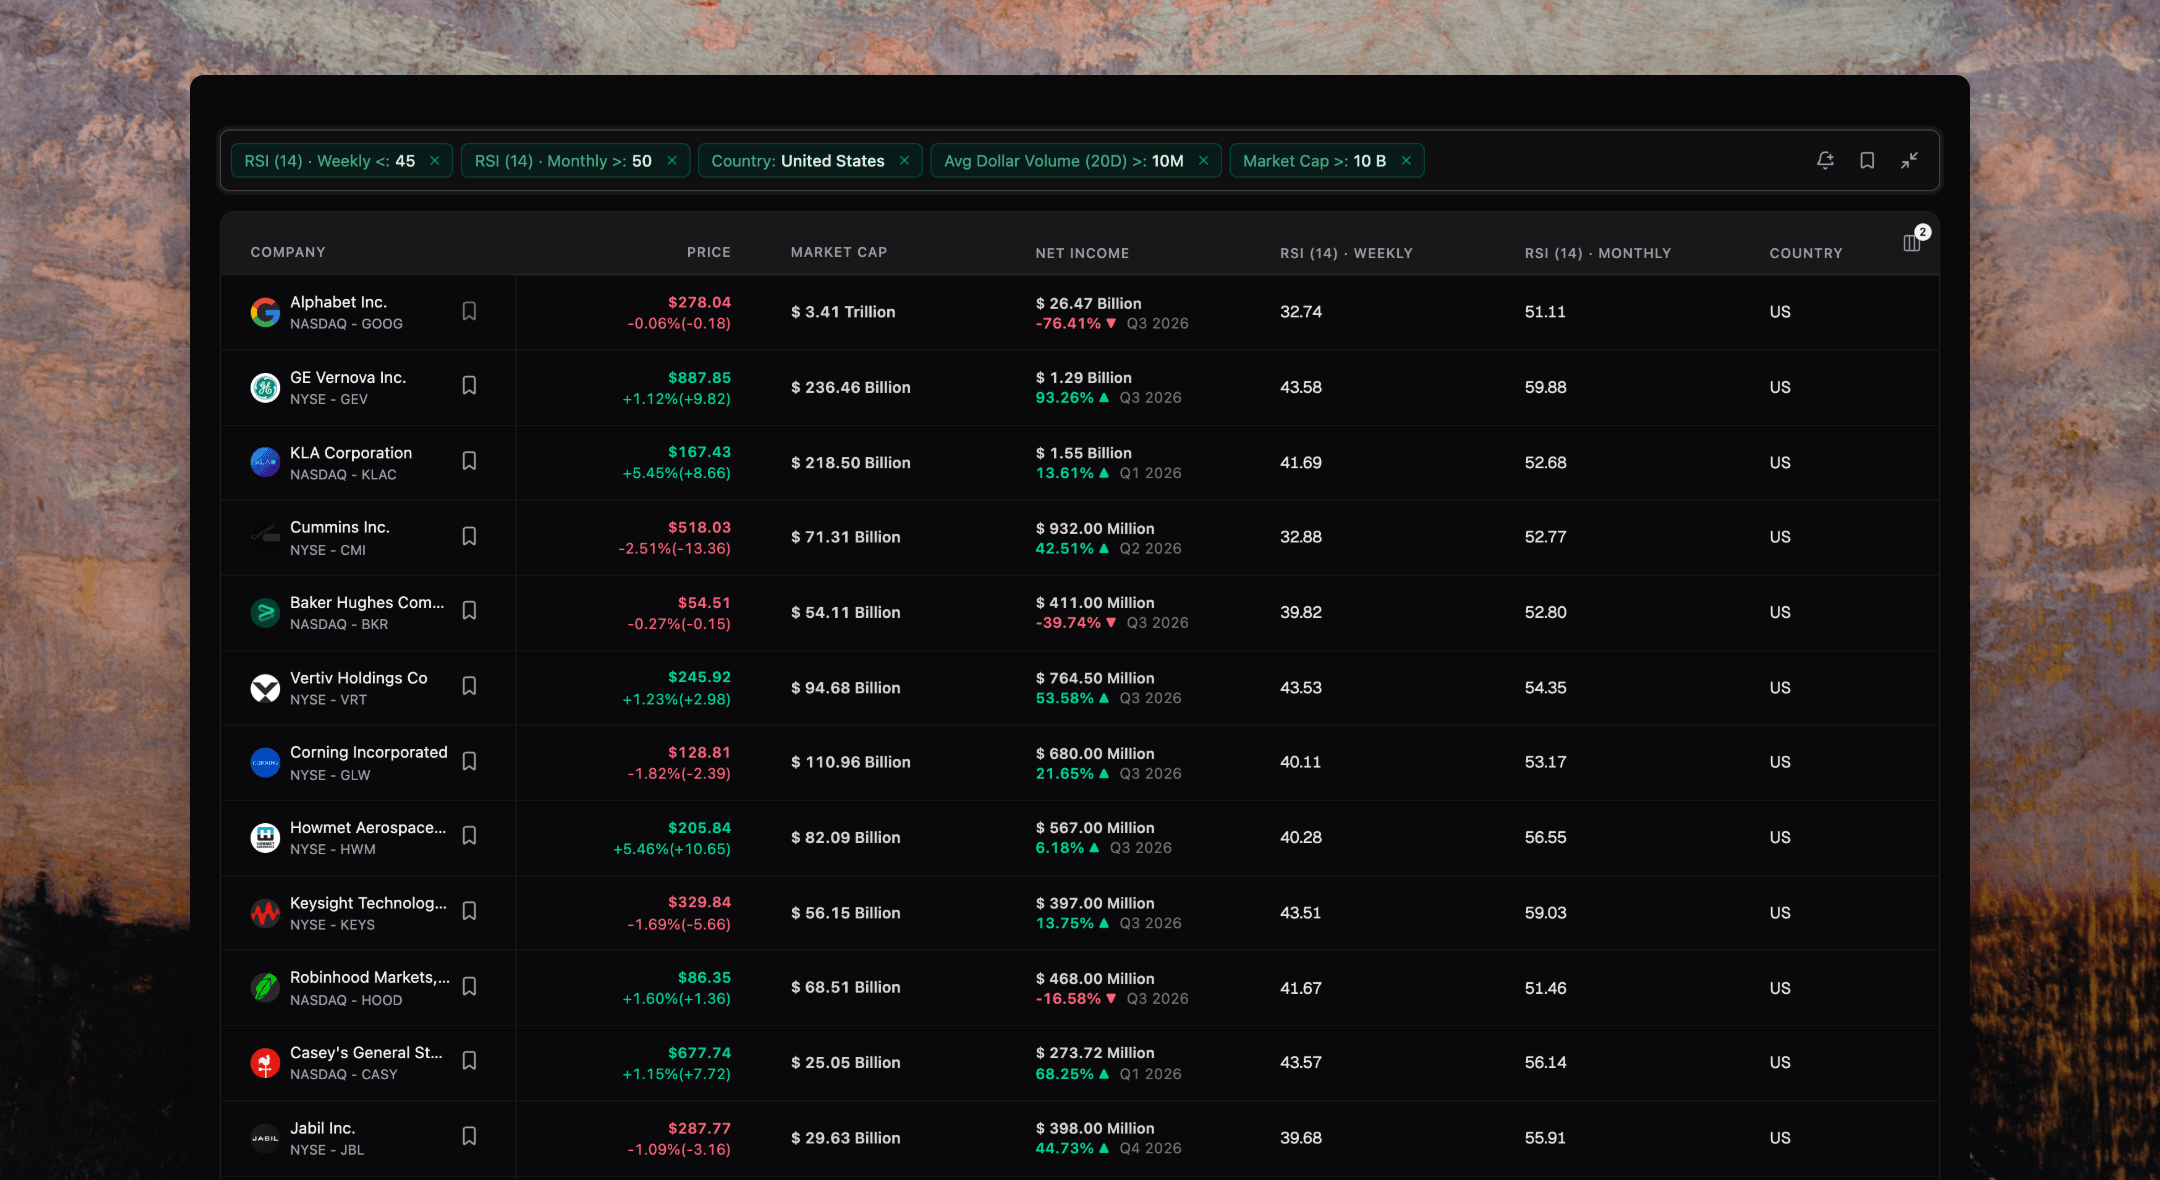
Screener 2.0
Screen for what other screeners can’t see.
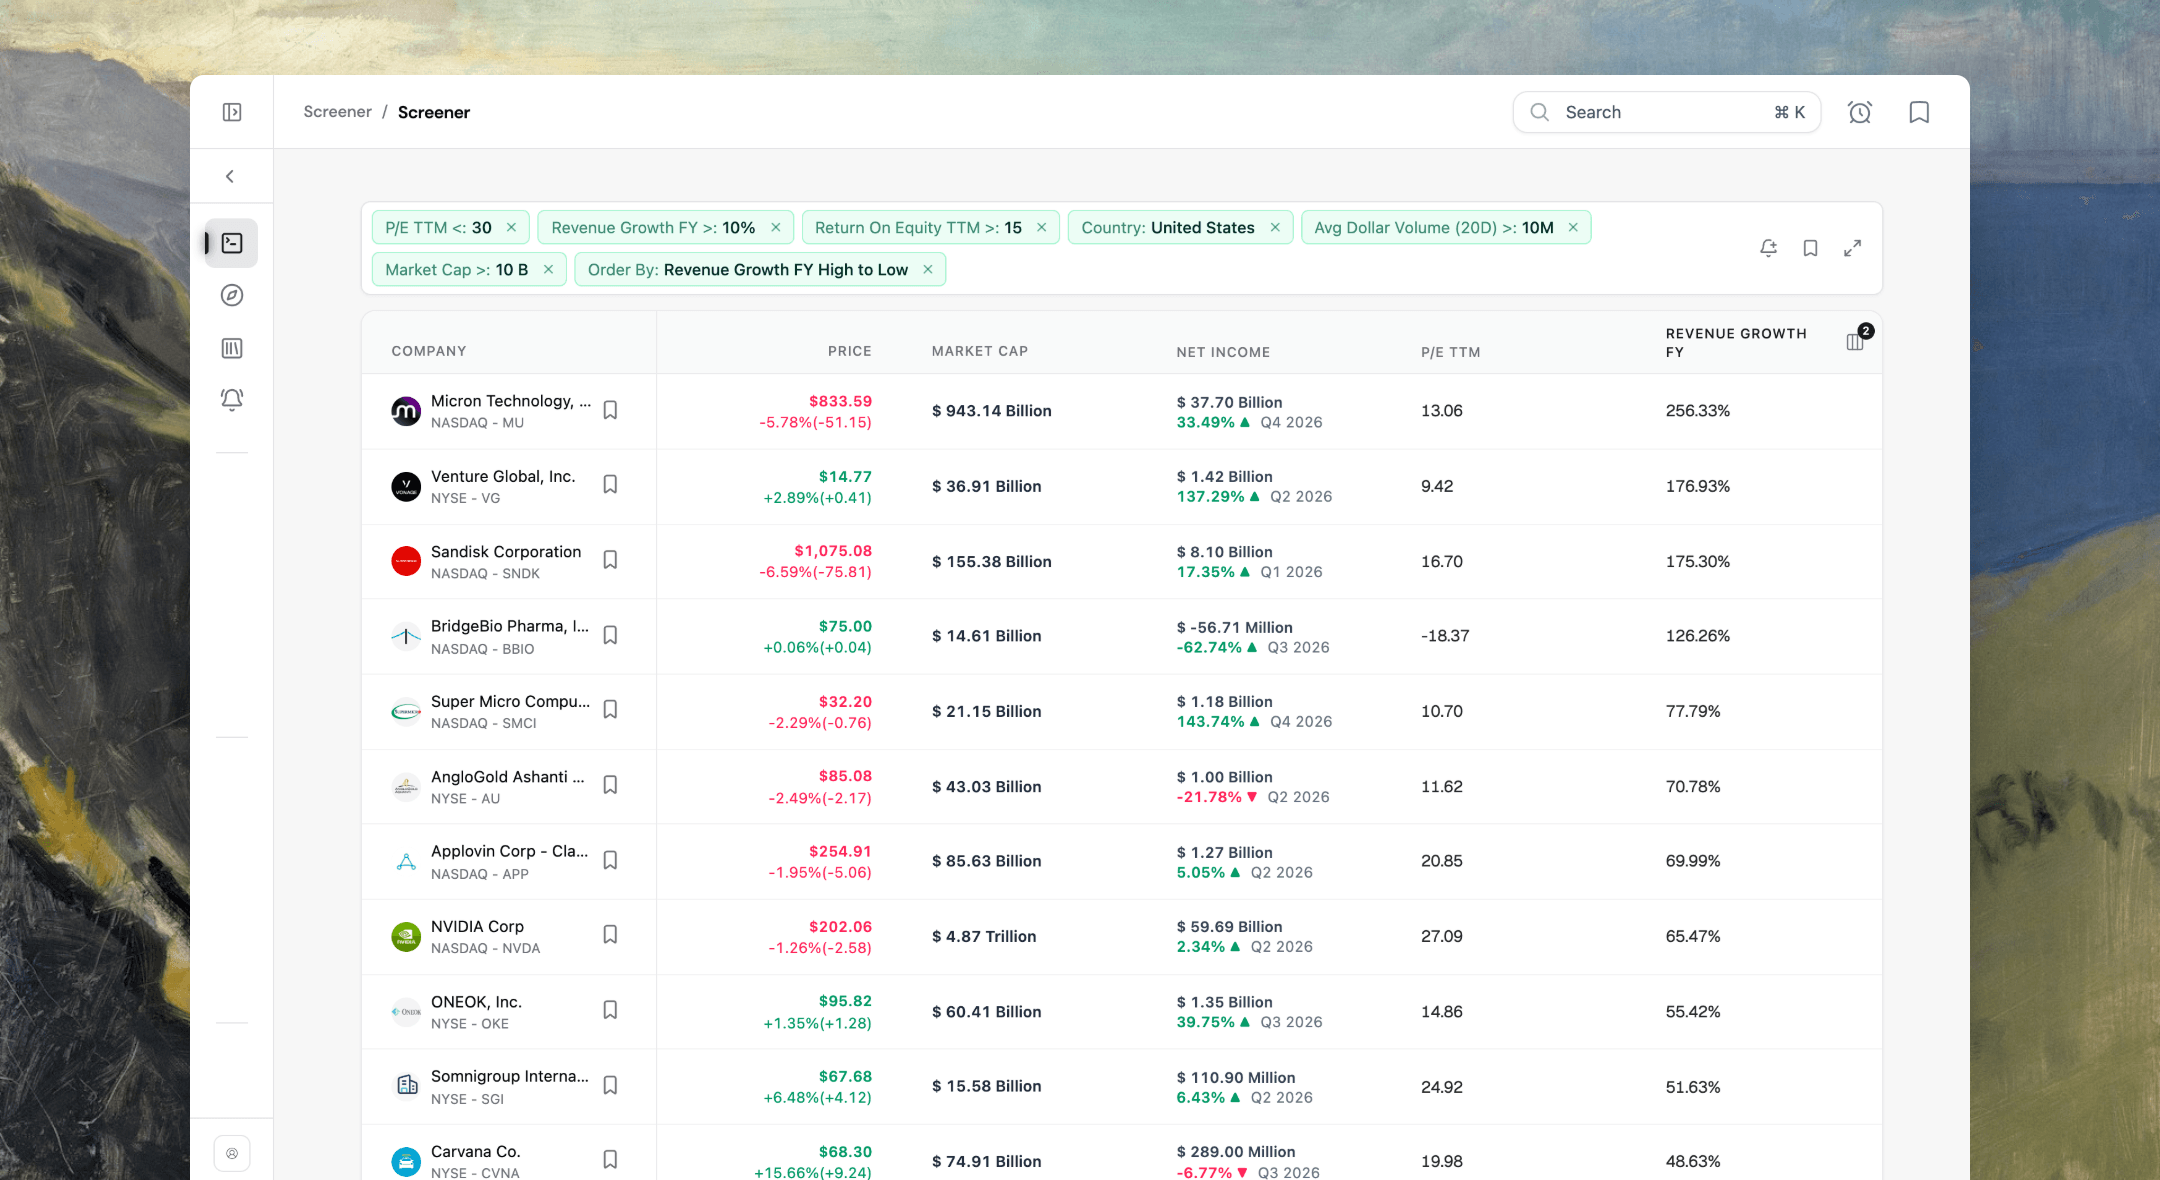
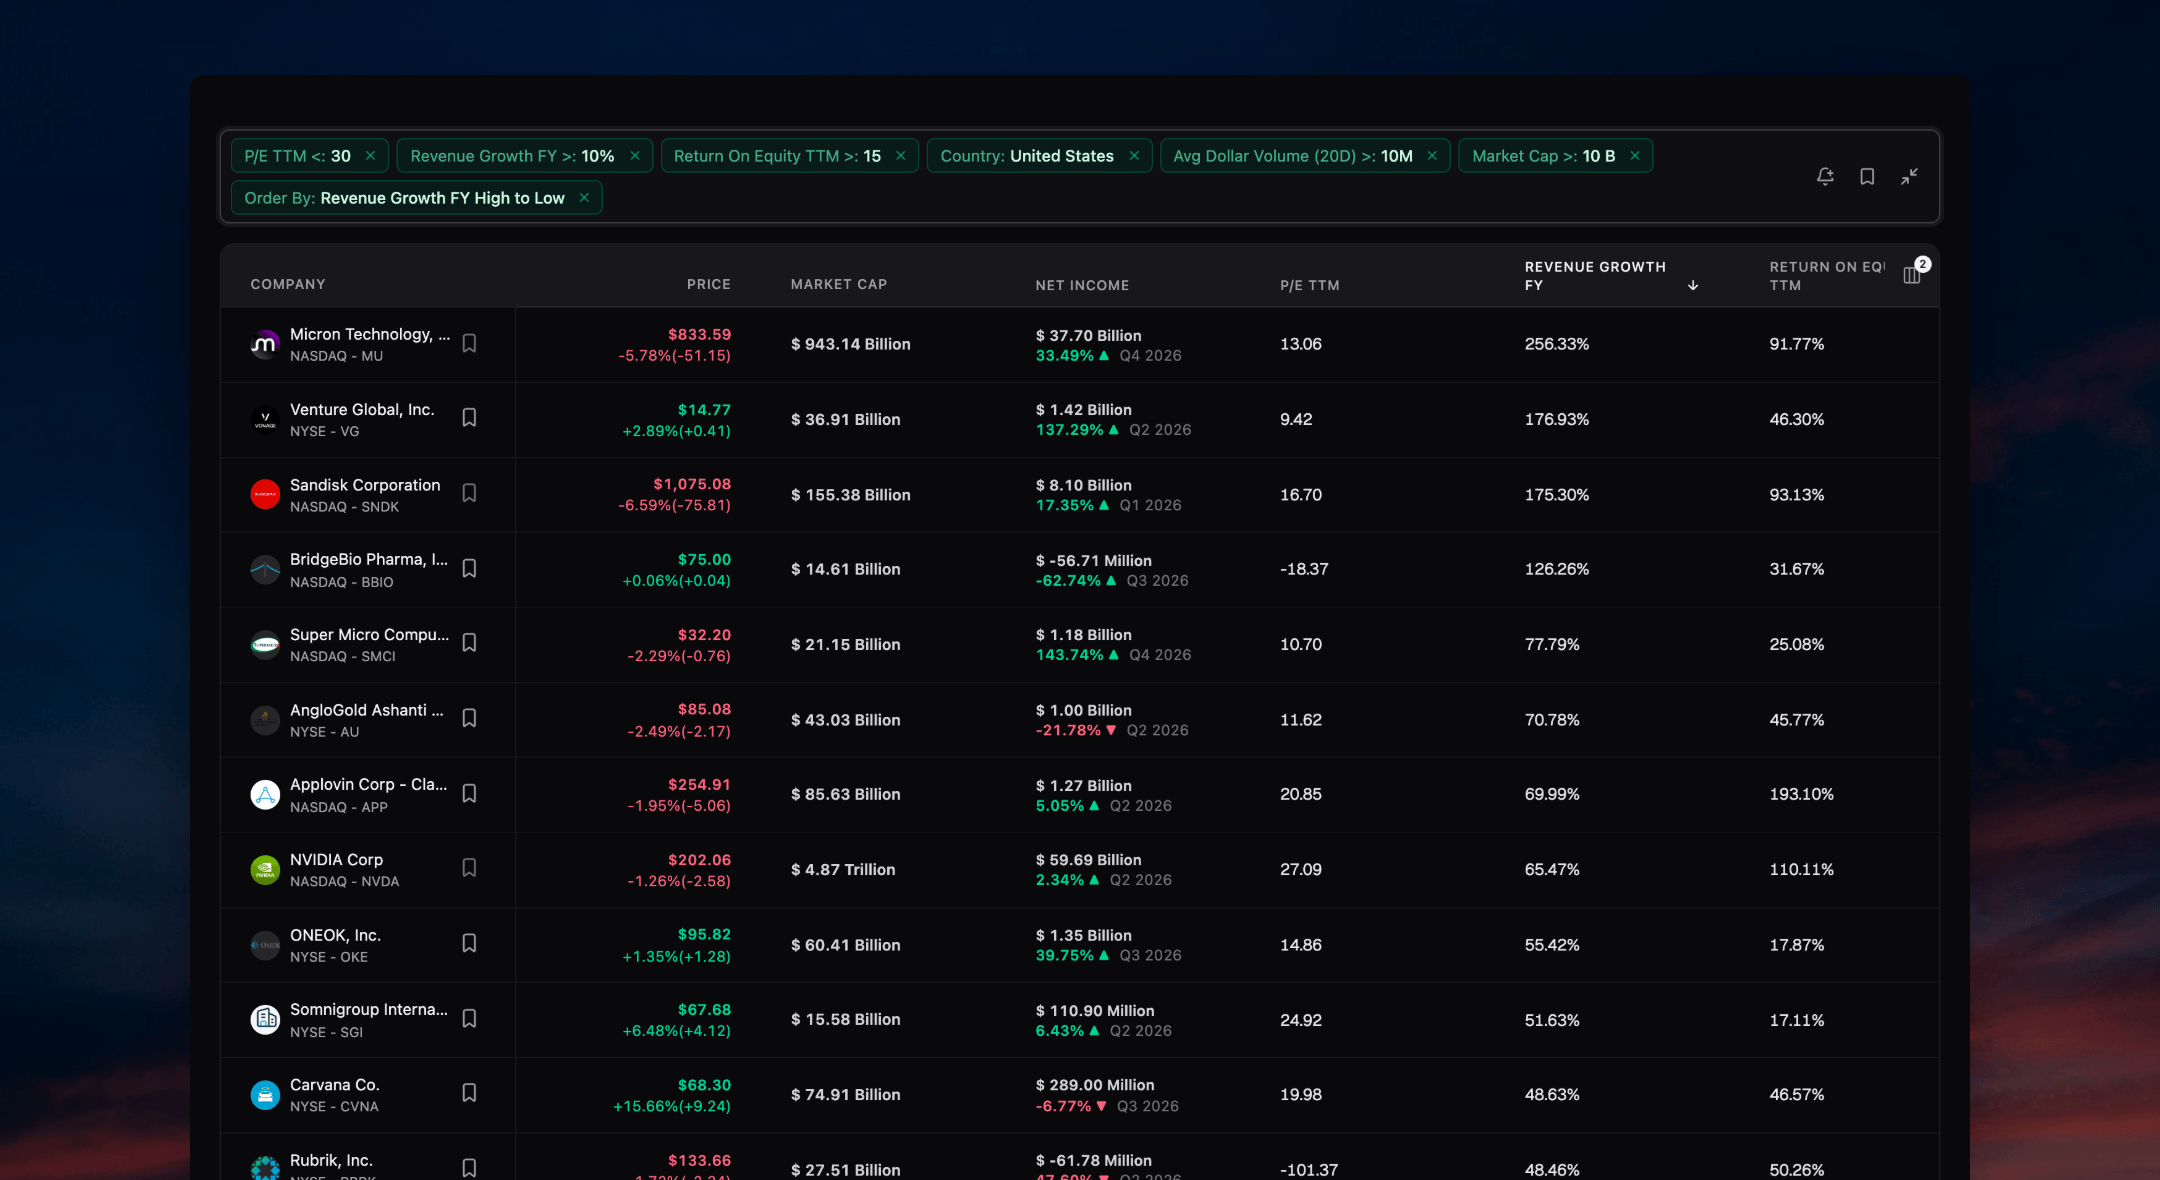
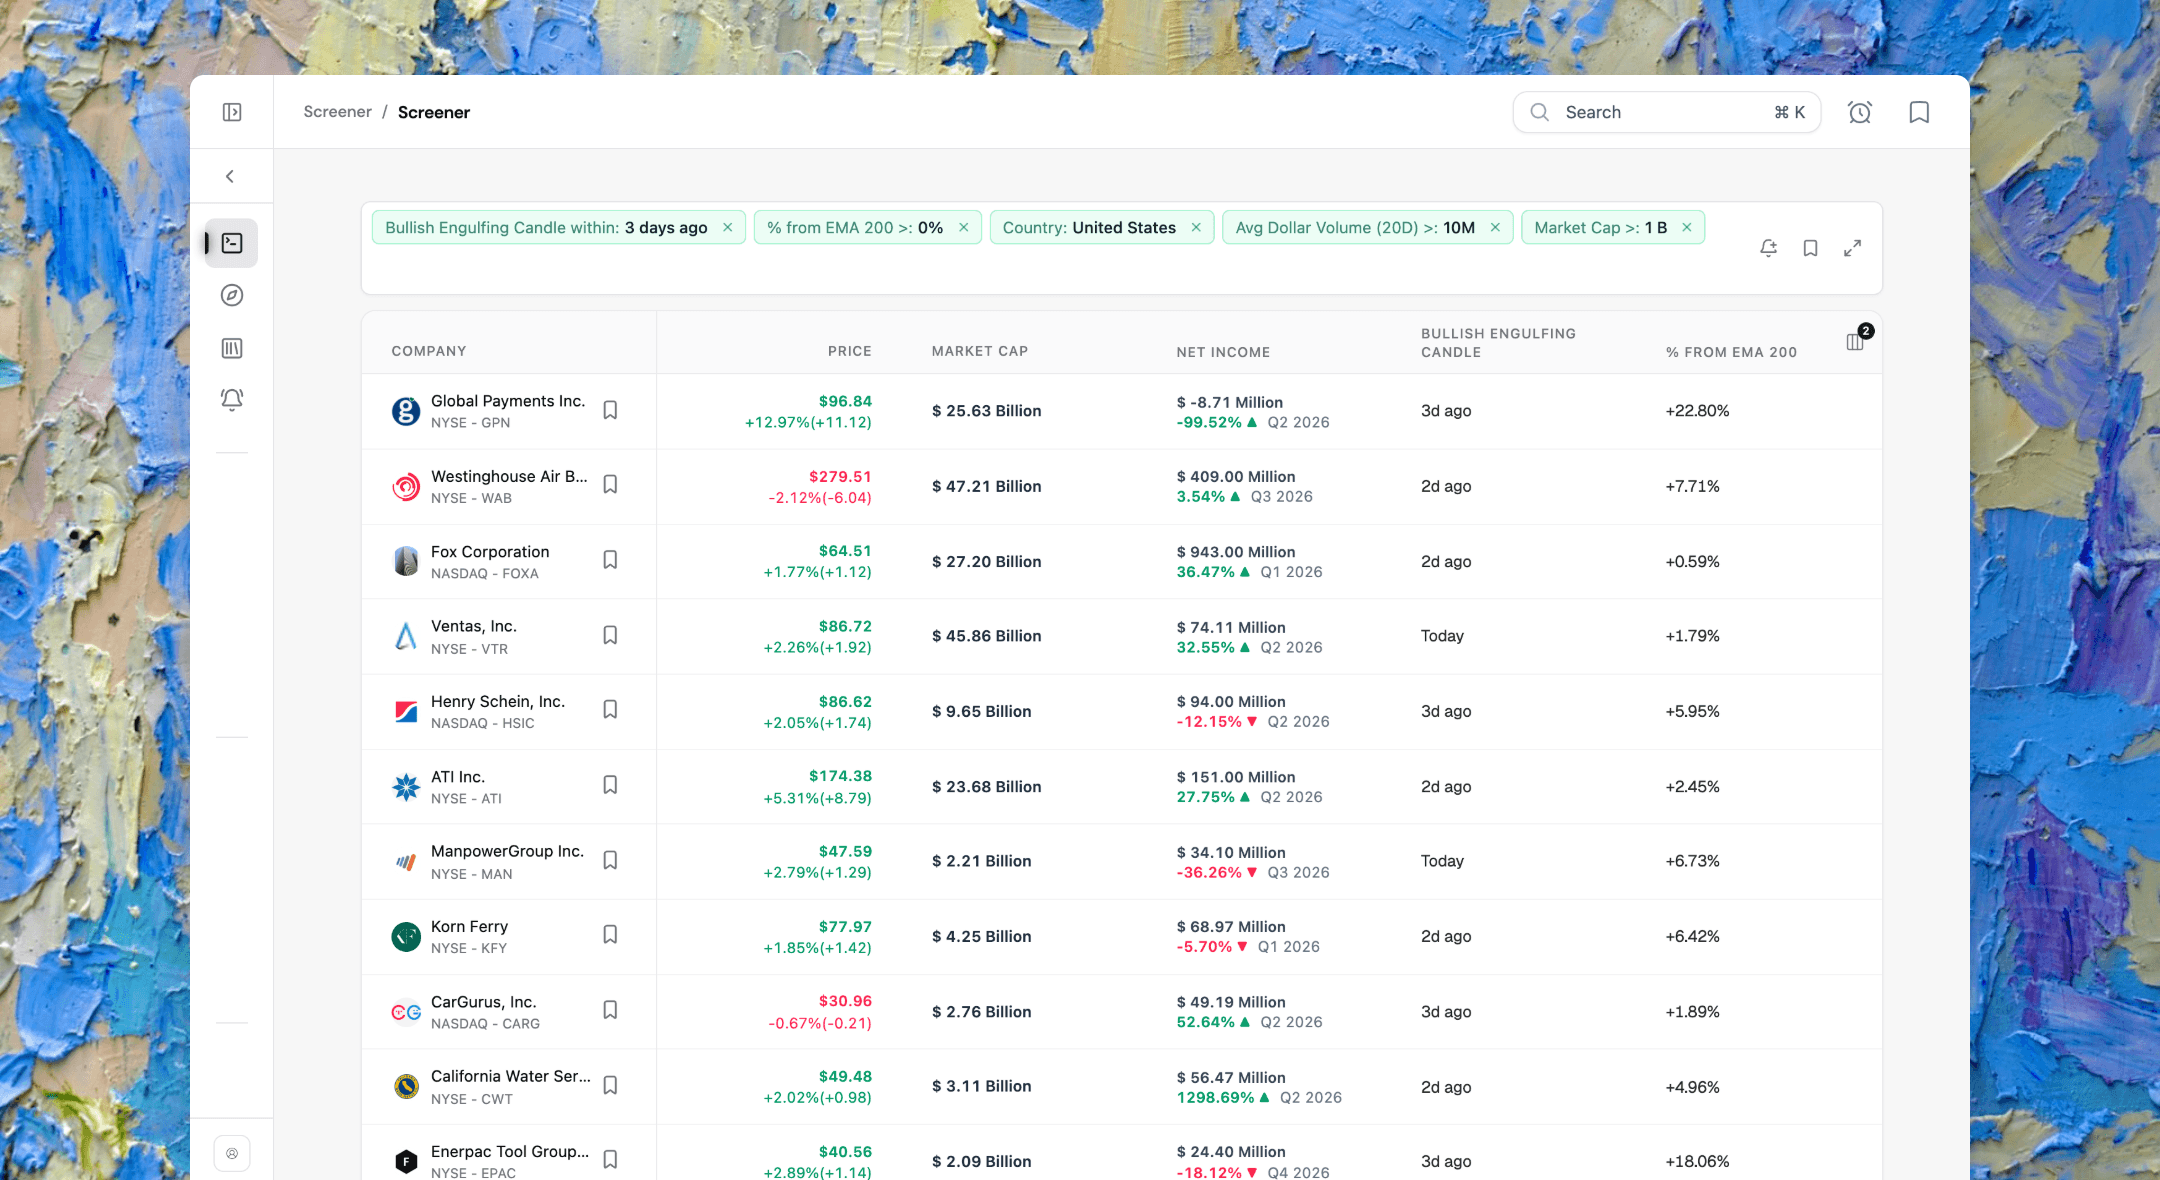
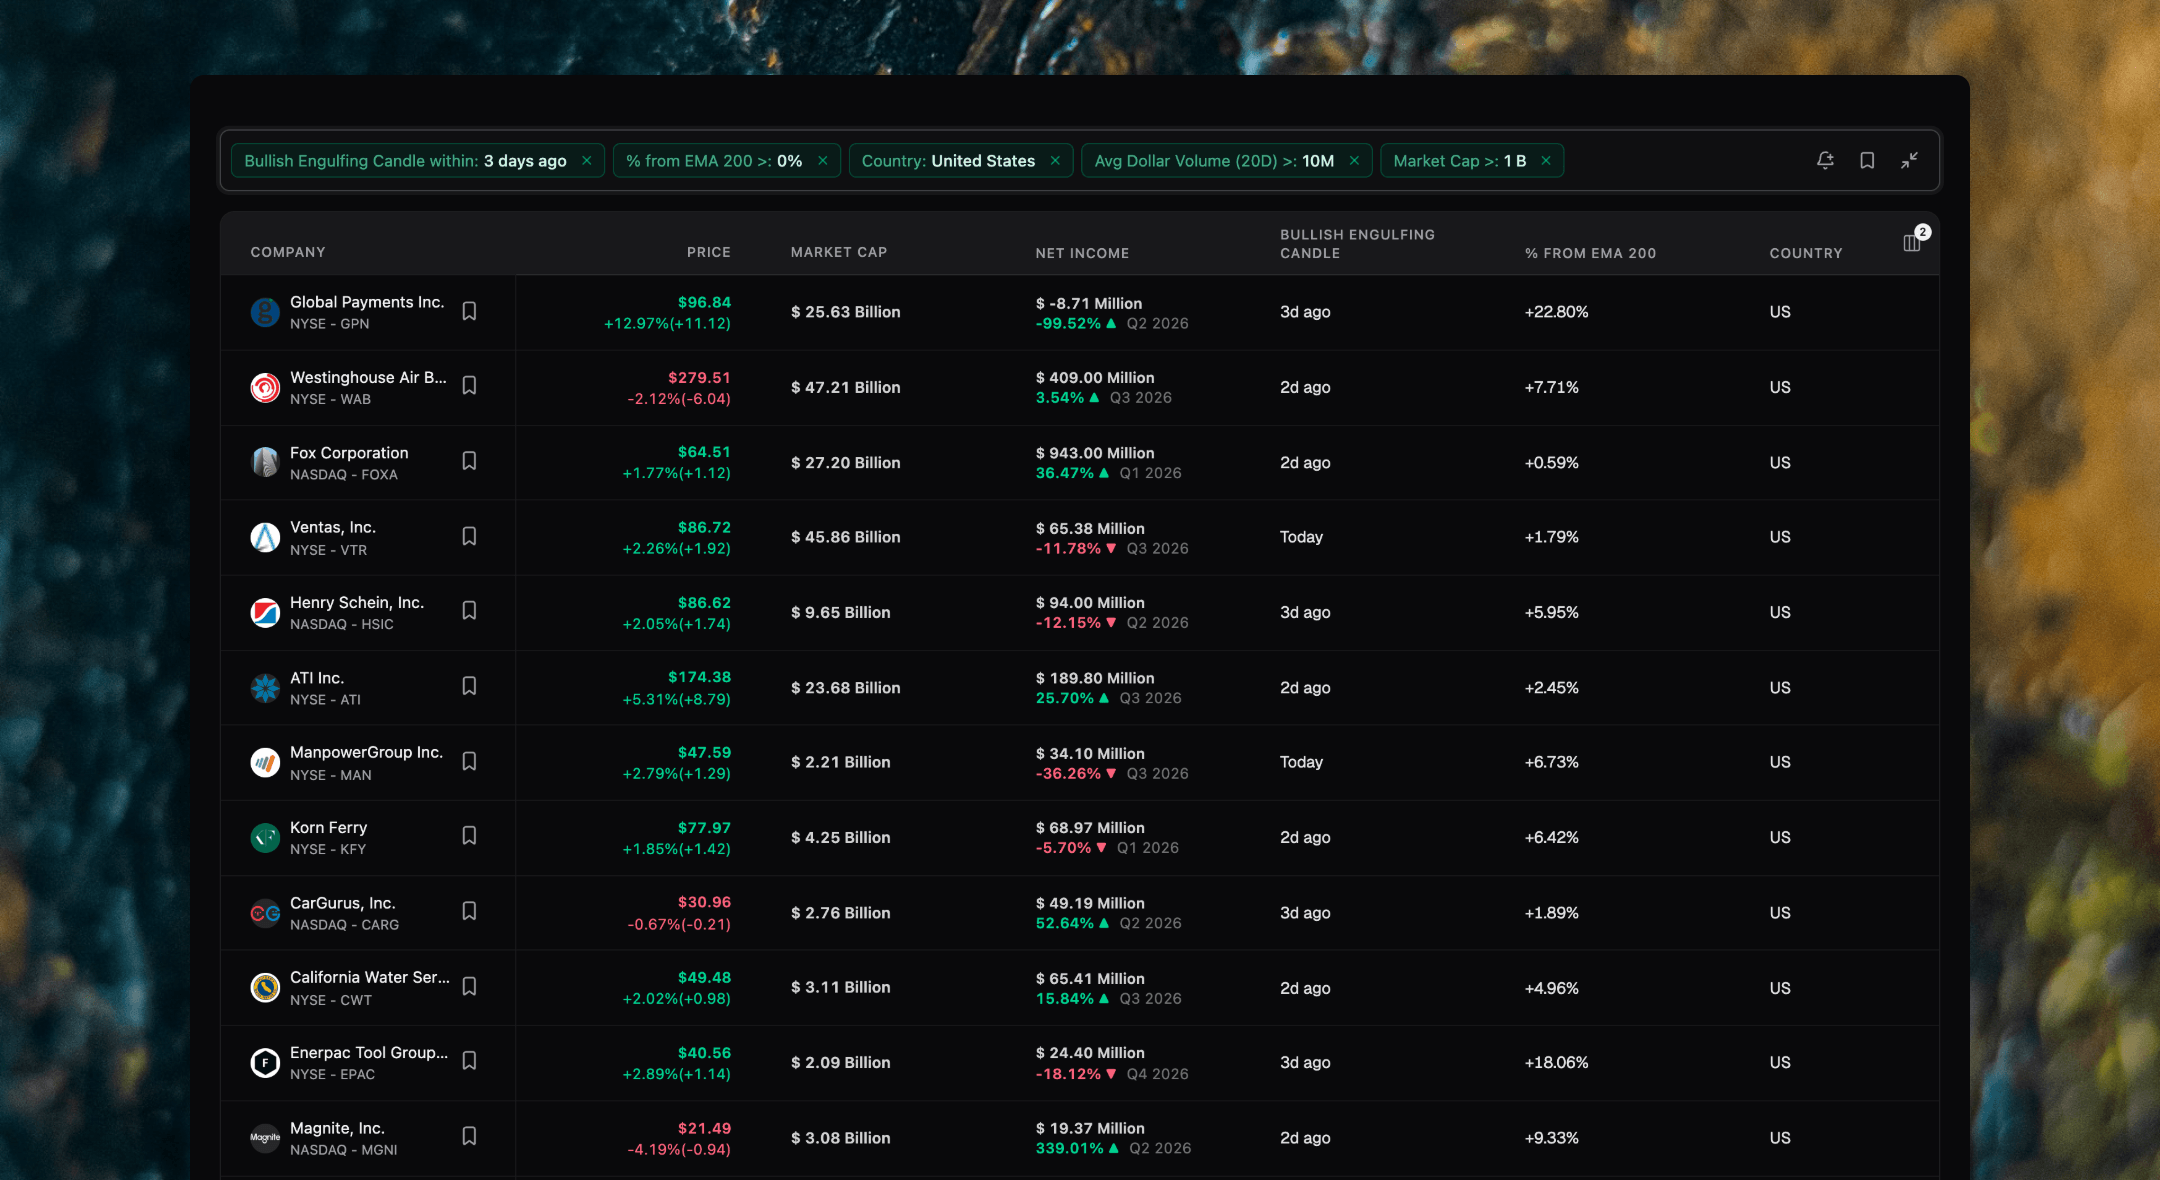
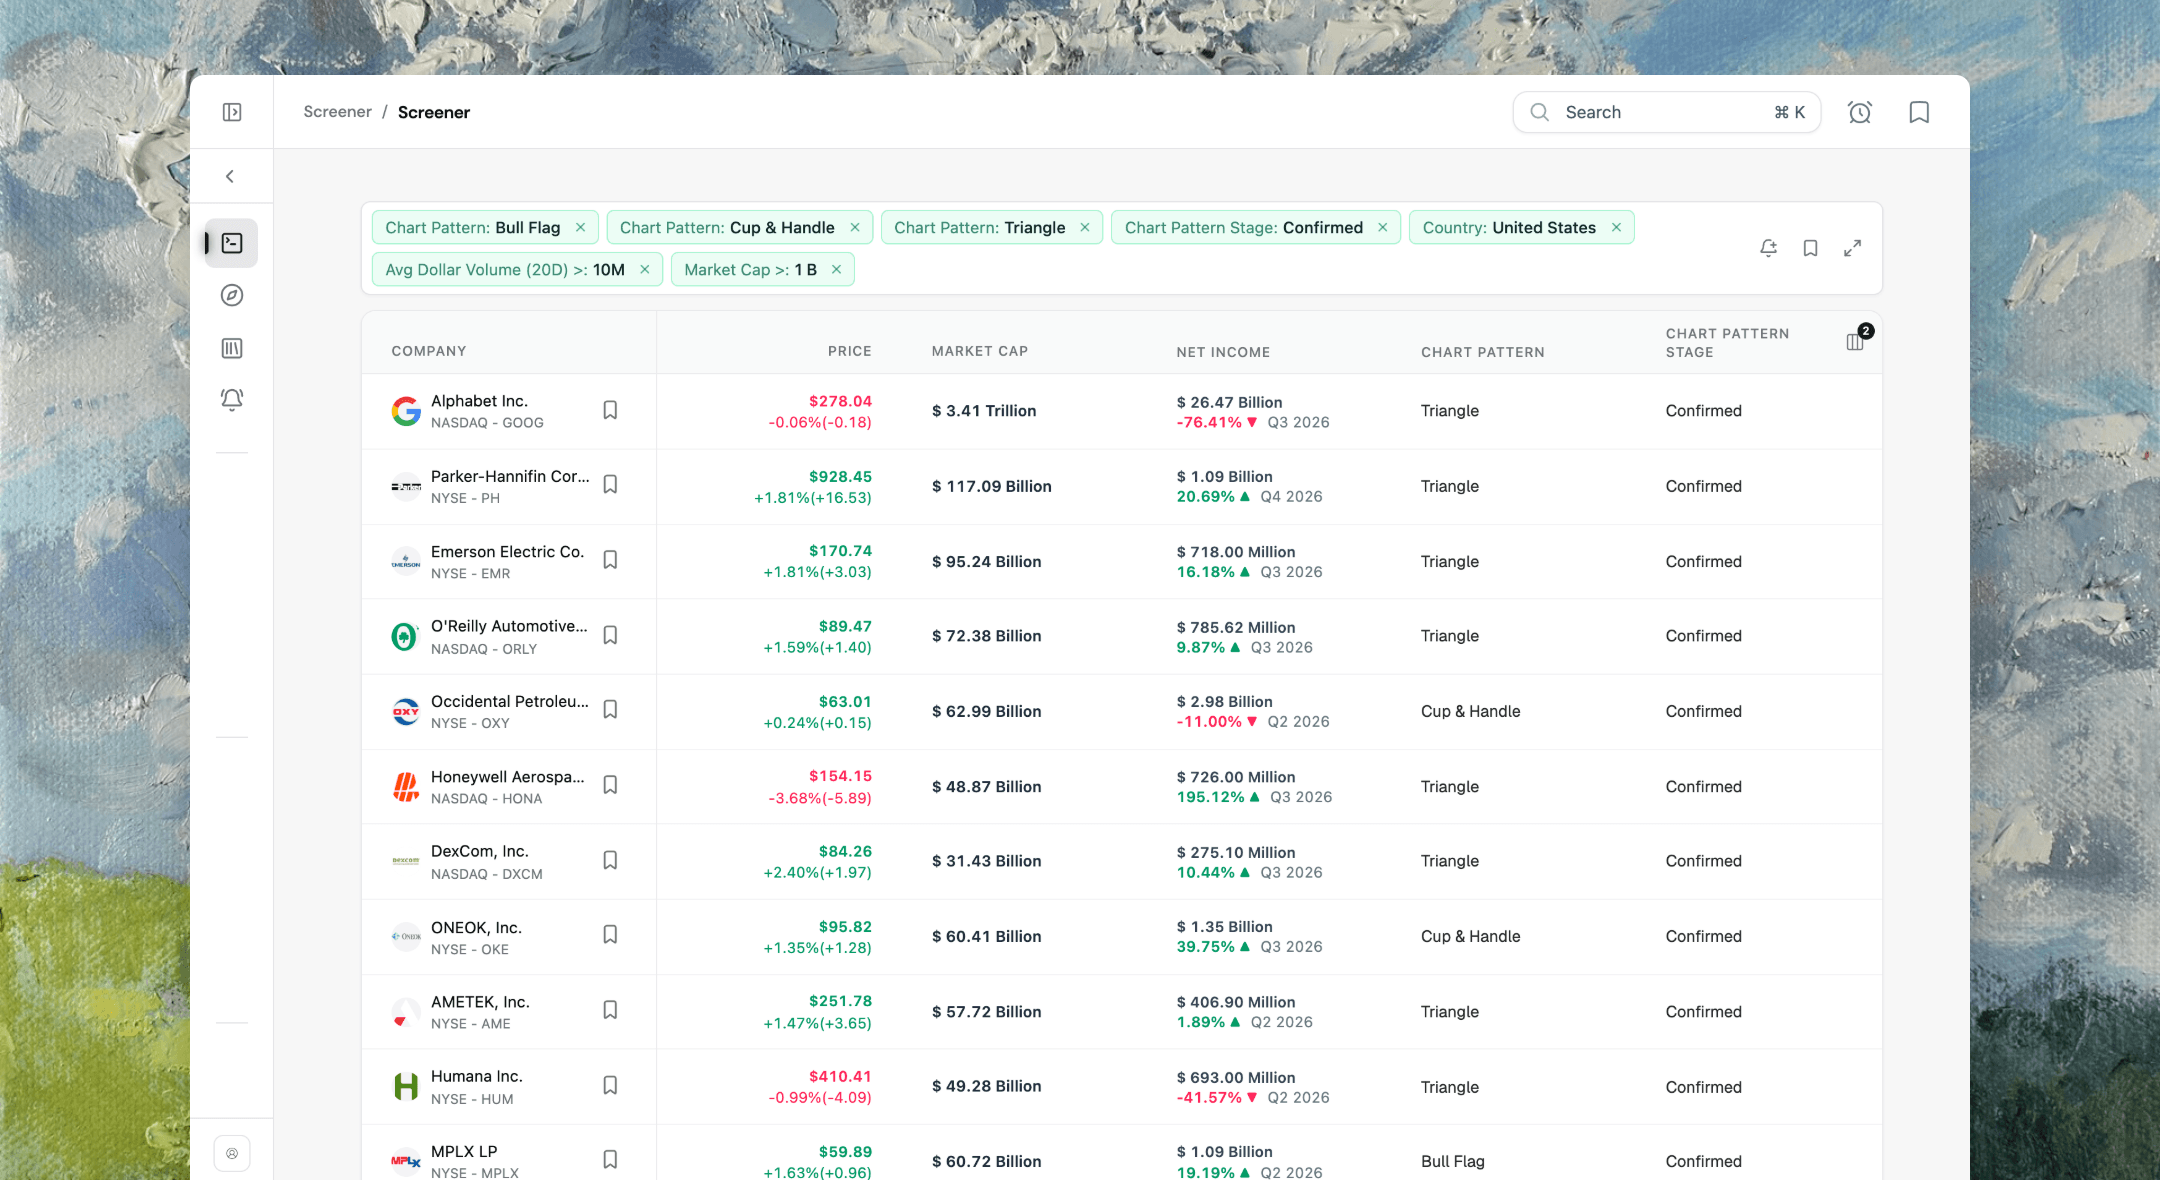
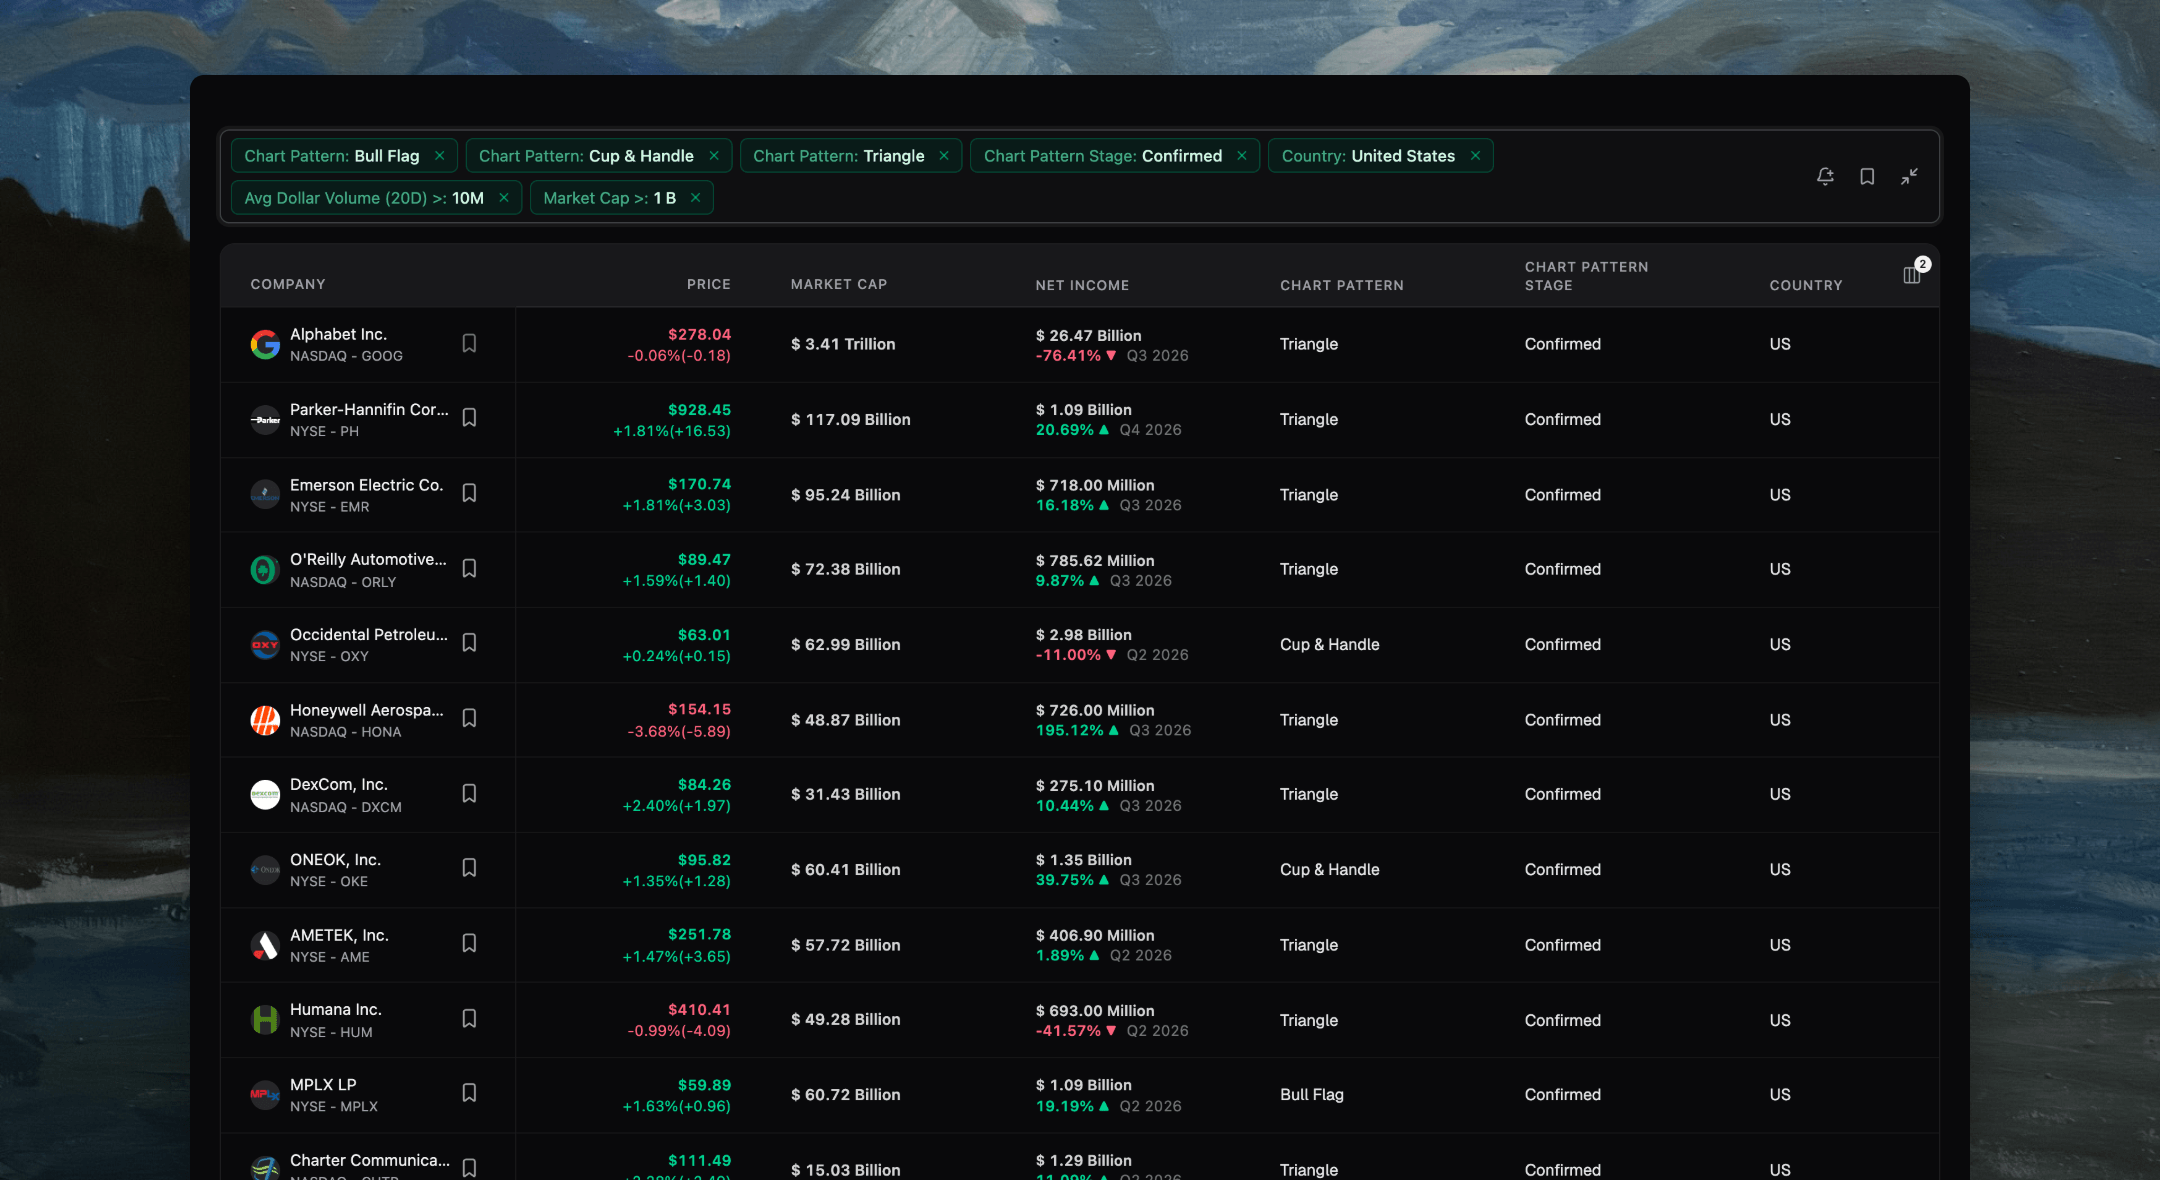
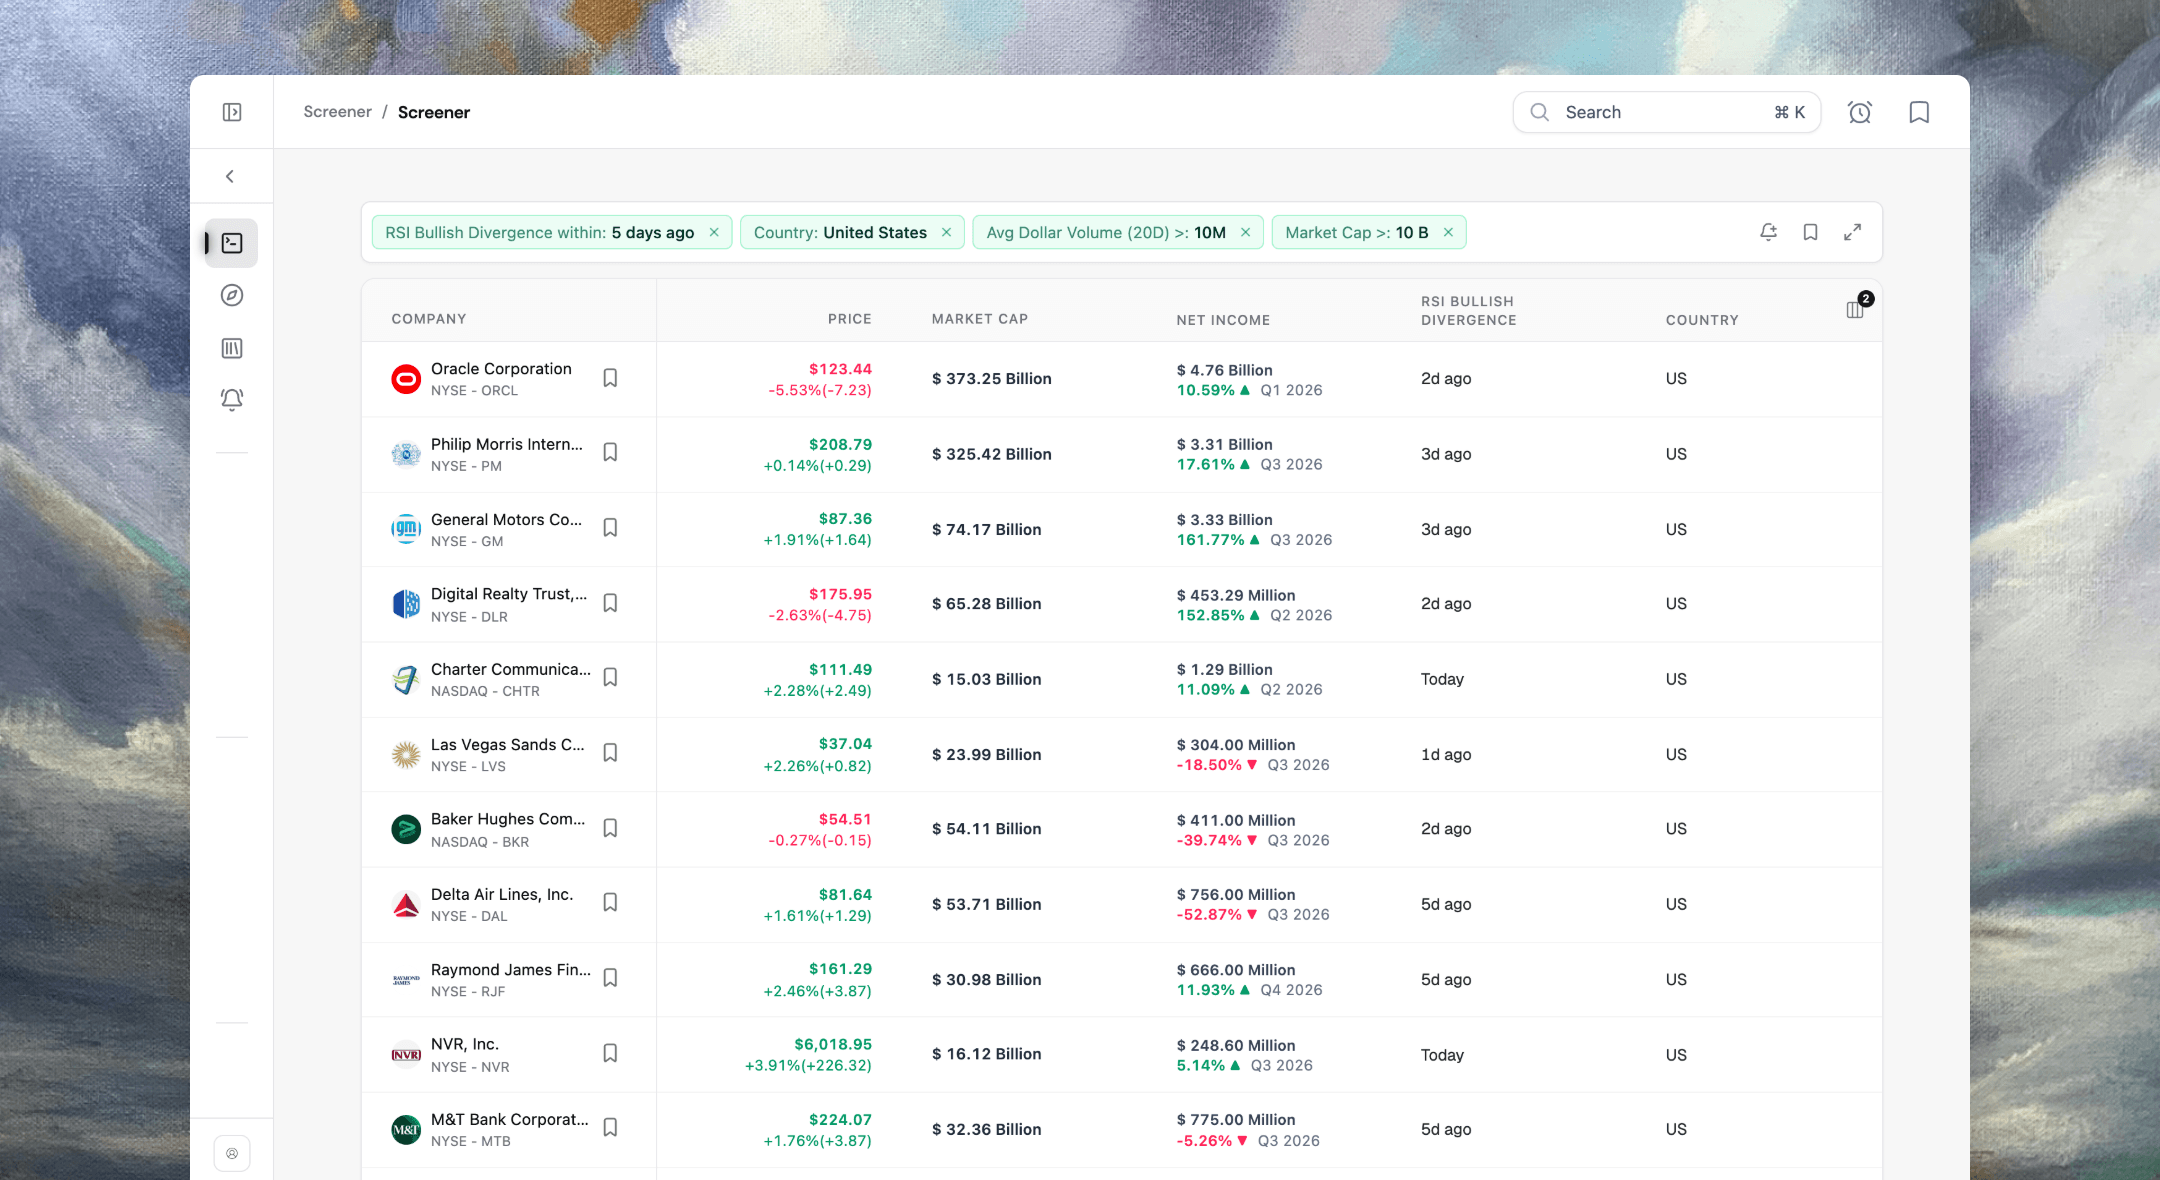
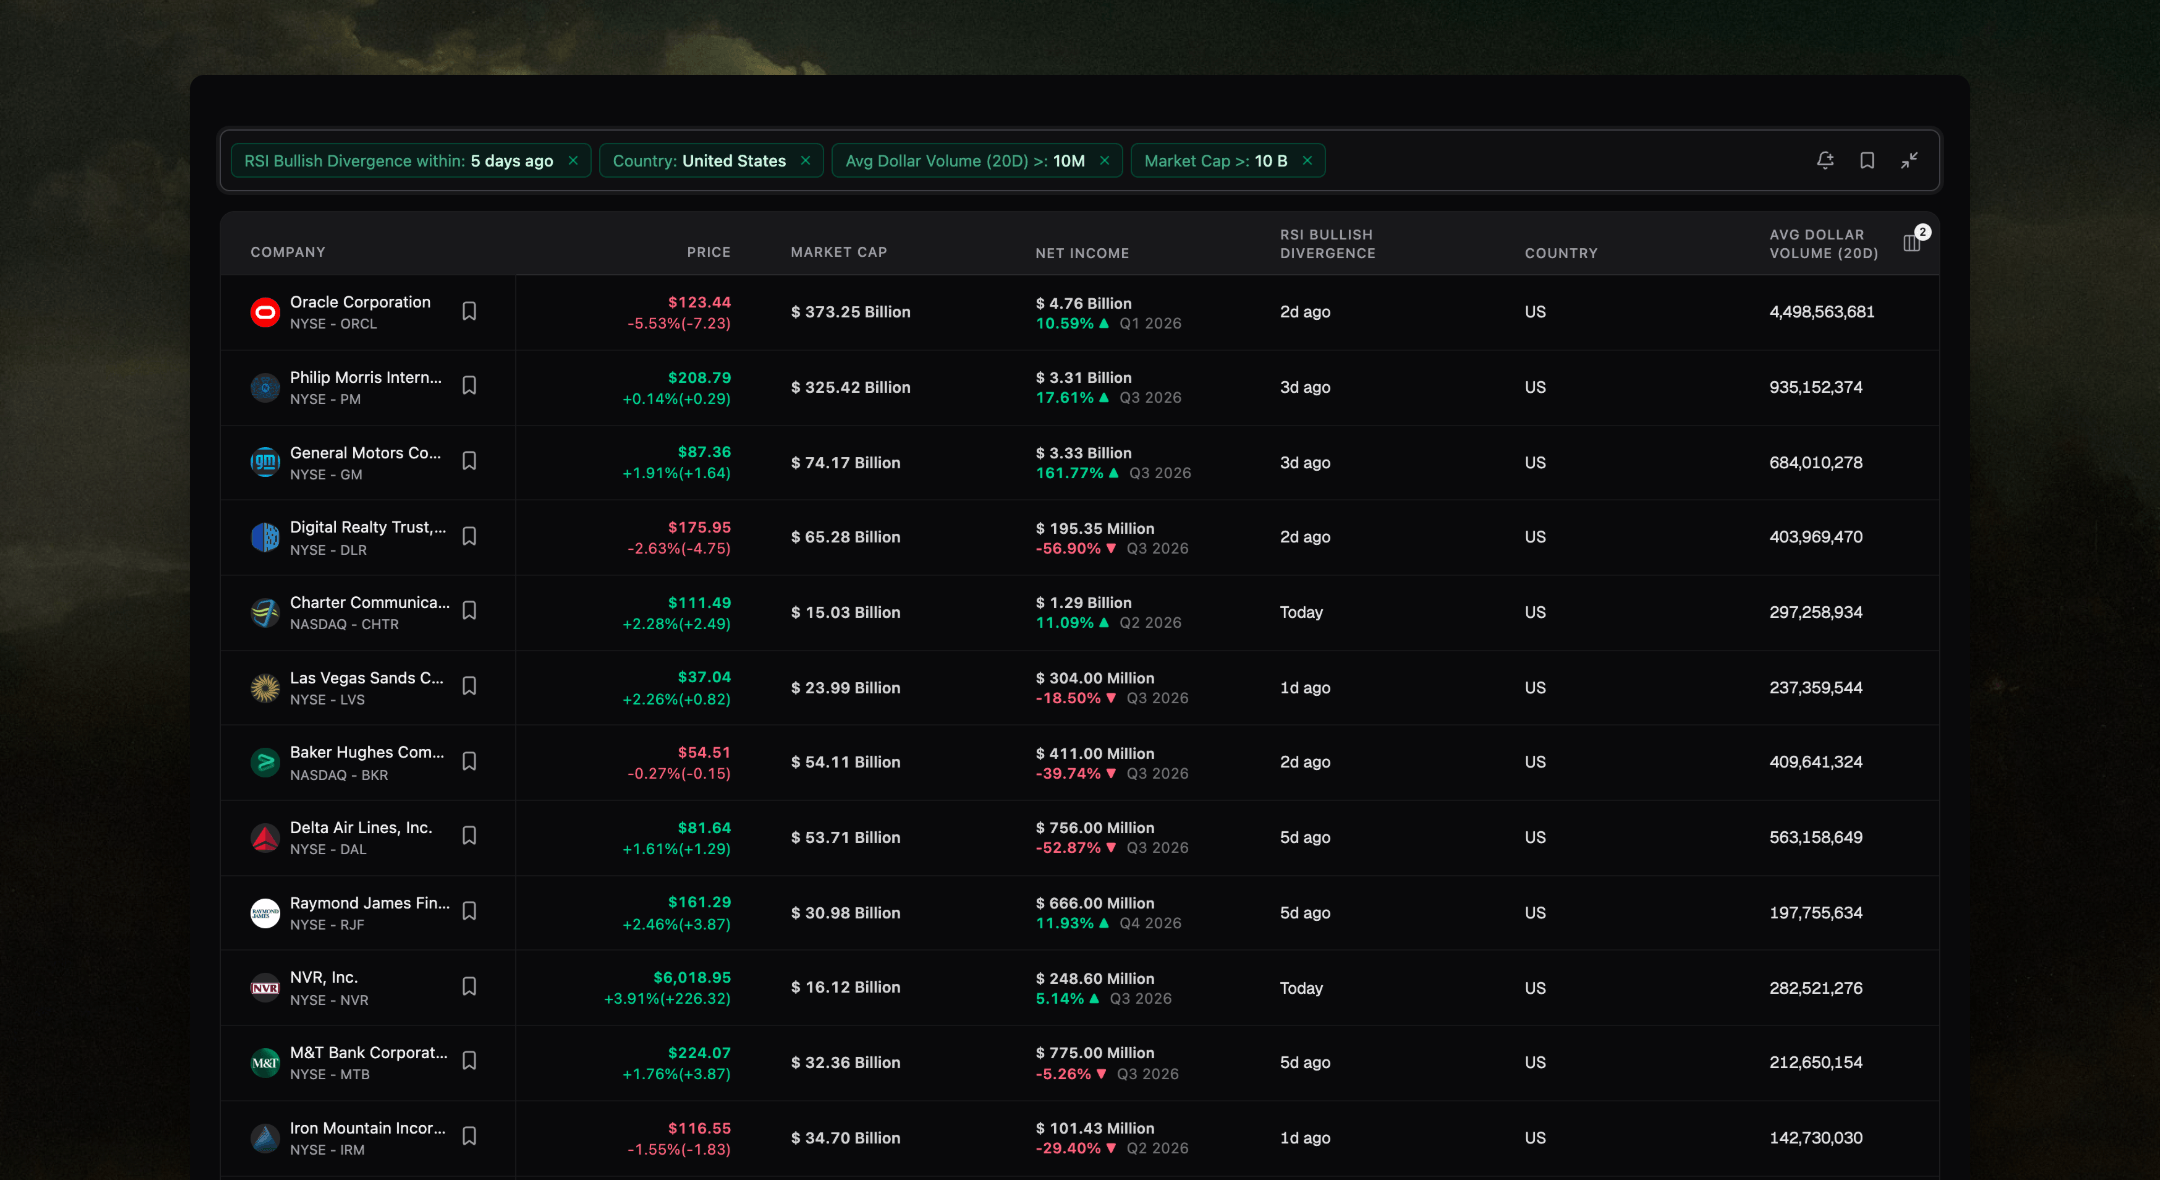
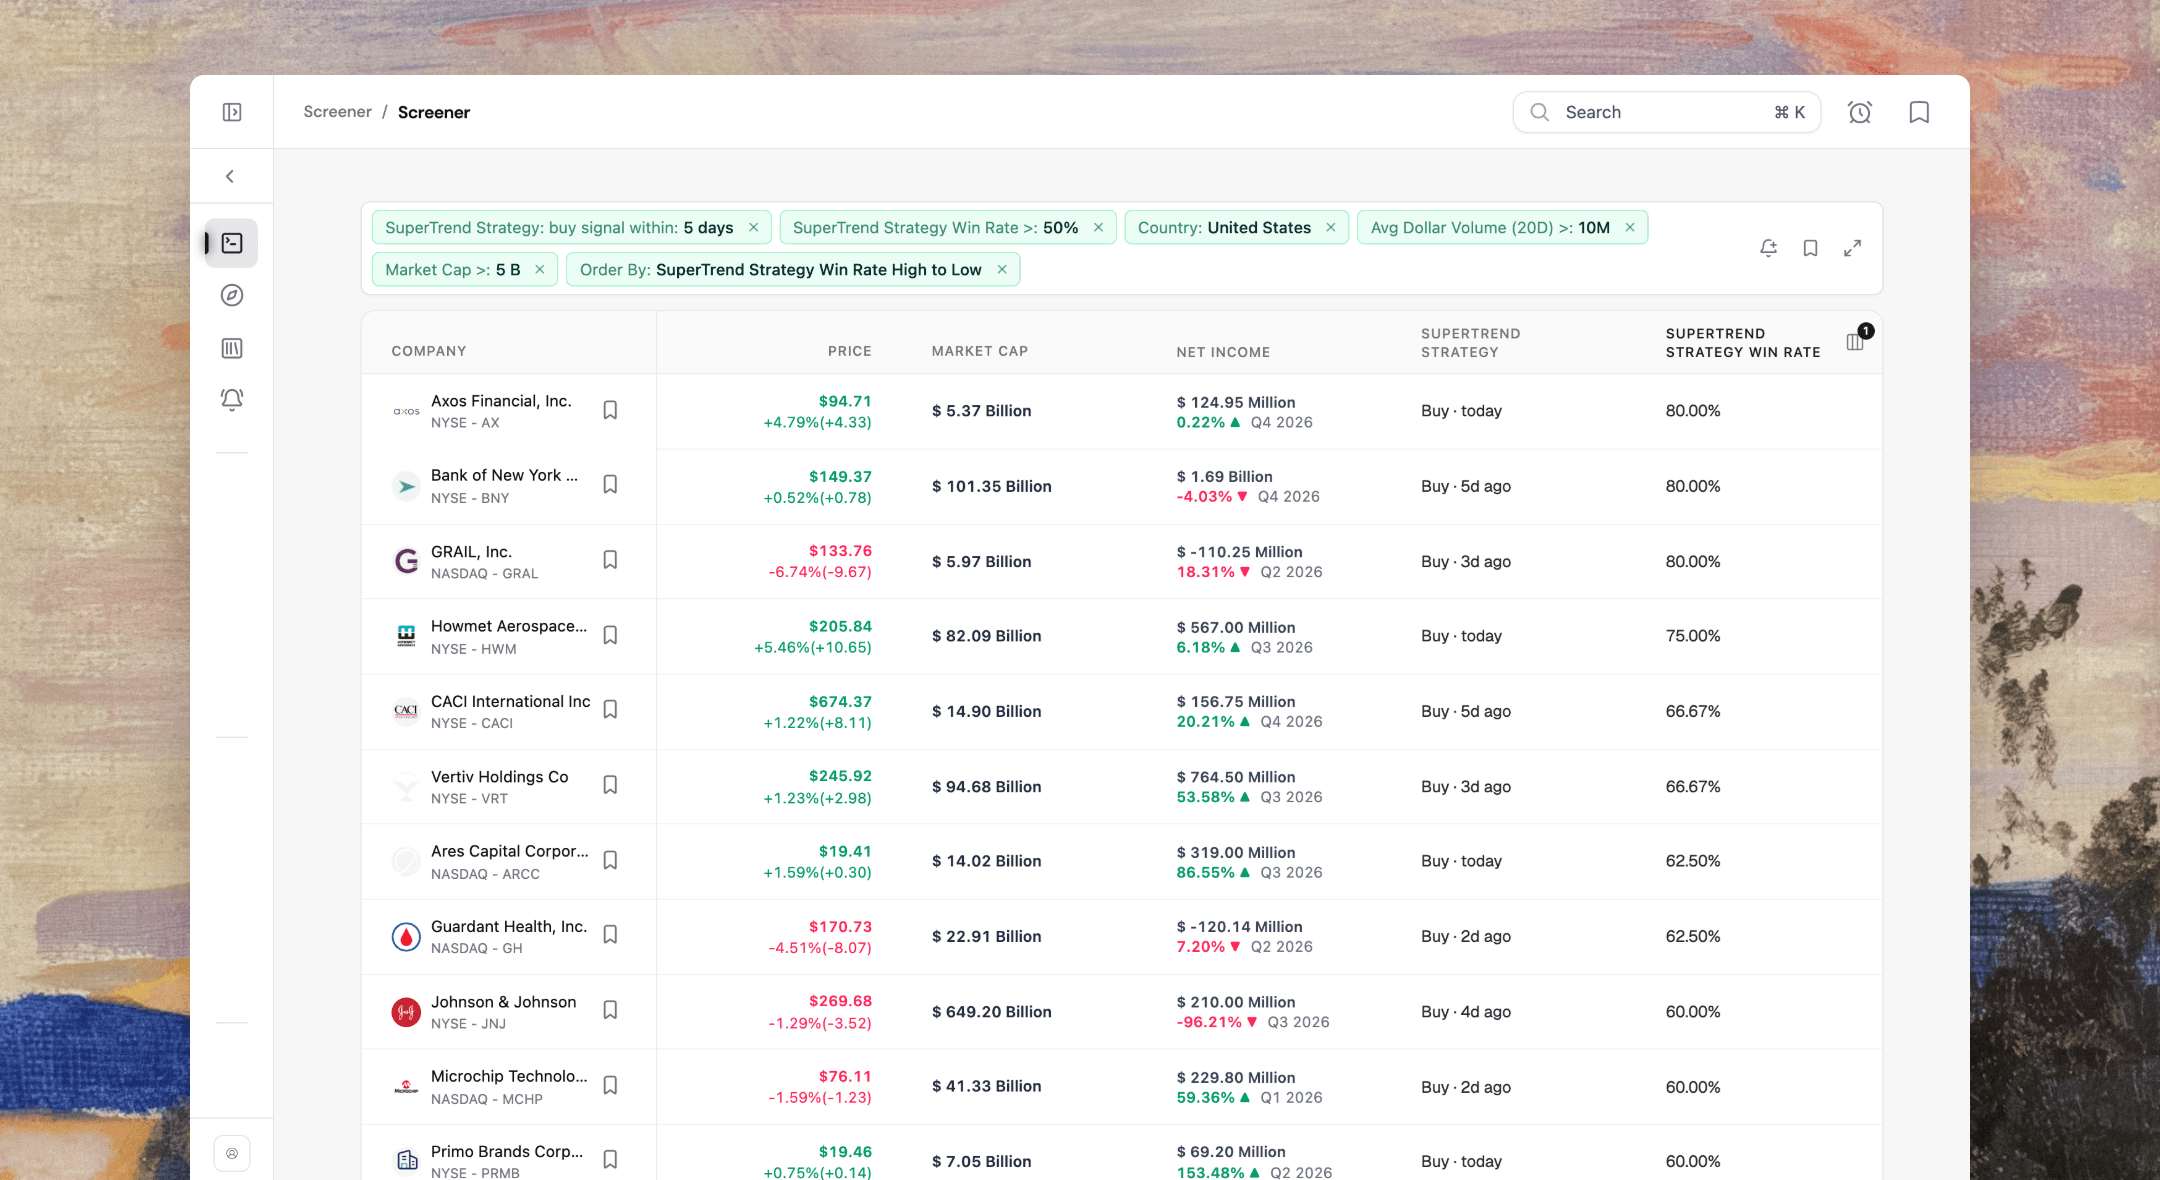
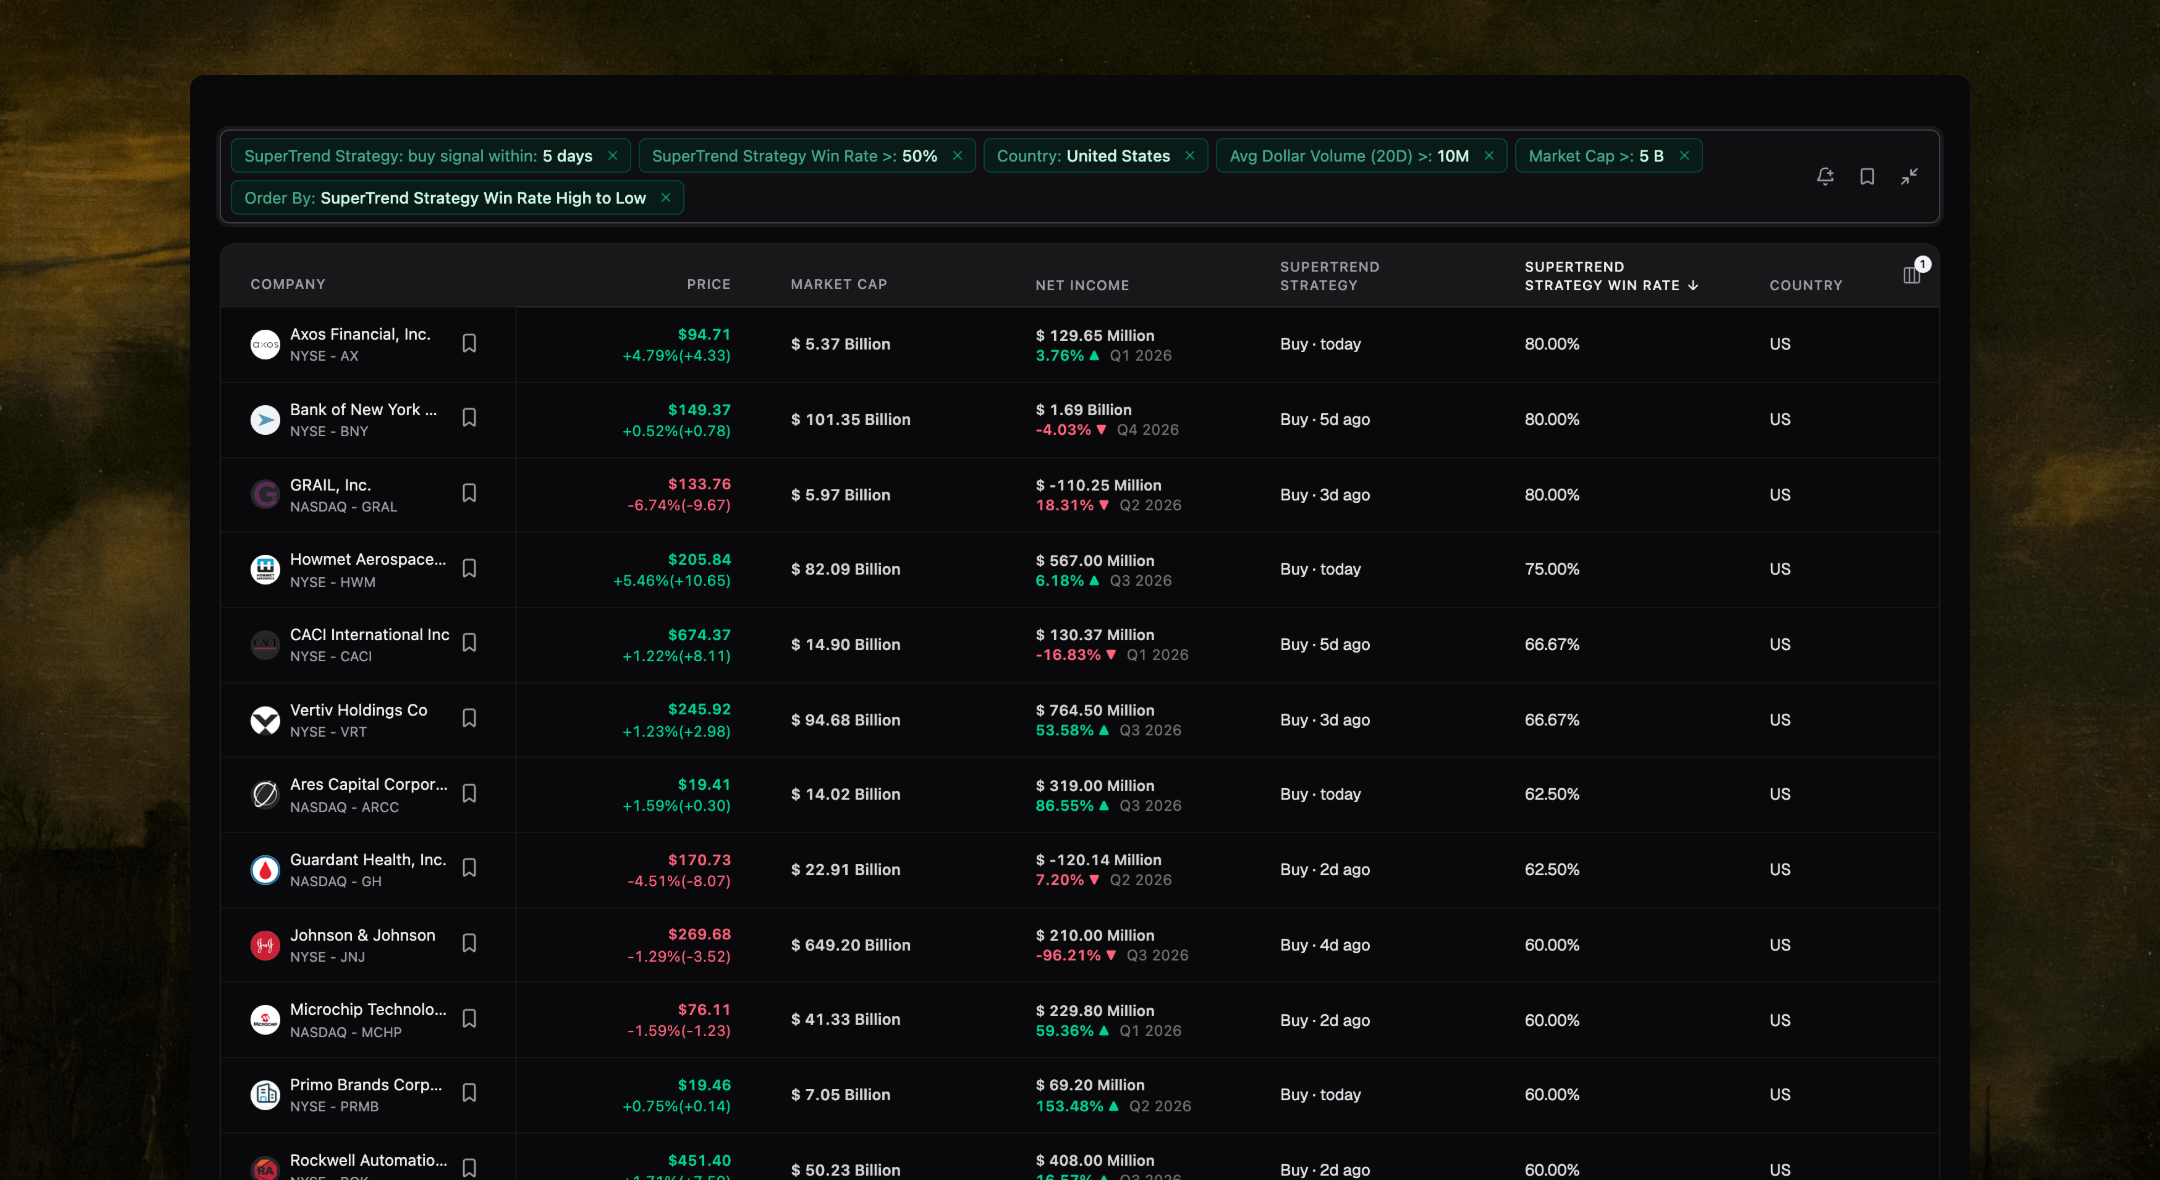
Mix fundamentals with candlestick and chart patterns, divergences and strategy signals, each with its backtested win rate. Every value comes from the same engine as the chart, so a screen and a chart never disagree.
Valuation
P/E, EV/EBITDA, price to sales and book, and free cash flow yield.
Profitability and growth
ROE, ROIC and margins, with revenue, earnings and cash flow growth.
Quarterly, annual and TTM
Each figure by quarter, fiscal year or trailing twelve months, with sector, industry and country.
45 indicators
RSI, MACD, Stochastic, CCI, ADX, Bollinger Bands, Ichimoku, WaveTrend and more.
Moving averages
Distance from the 10 to 200-day SMA and EMA, golden and death crosses, and the ribbon.
Crosses and flips
MACD crossing its signal, RSI crossing 50, SuperTrend turning, each within any number of days.
44 candlestick patterns
Engulfing, hammer, doji, morning and evening star, three white soldiers and more.
How recent
Today, or within any number of bars, so the setup is still fresh.
With the trend
Combine a candle with any filter, like a bullish engulfing above the 200-day EMA.
16 chart patterns
Flags, pennants, wedges, triangles, double tops, head and shoulders, cup and handle.
By stage
Forming, confirmed, target reached or failed: screen only the stage you trade.
Direction and recency
Bullish or bearish patterns, found within any number of bars.
Eight oscillators
RSI, MACD, Stochastic, CCI, MFI, OBV, the Awesome Oscillator and Momentum.
Regular and hidden
Bullish and bearish, 32 divergence filters in all.
Bars ago
Divergences that formed in the last few days, on daily, weekly or monthly bars.
37 strategies
Crossovers, SuperTrend, Turtle and Darvas, RSI(2), squeeze and 52-week breakouts and more.
Backtested win rate
Every strategy with its win rate on the stock’s own history.
Fresh signals
Bullish or bearish signals within any number of days, sorted by win rate.
Three timeframes
Indicators, patterns, divergences and strategy signals on daily, weekly and monthly bars.
Mix them in one screen
A weekly uptrend with a daily pullback, or a monthly RSI with a weekly candle.
Counted in weeks and months
Recency follows the timeframe: within two weeks, or this month.
Charting
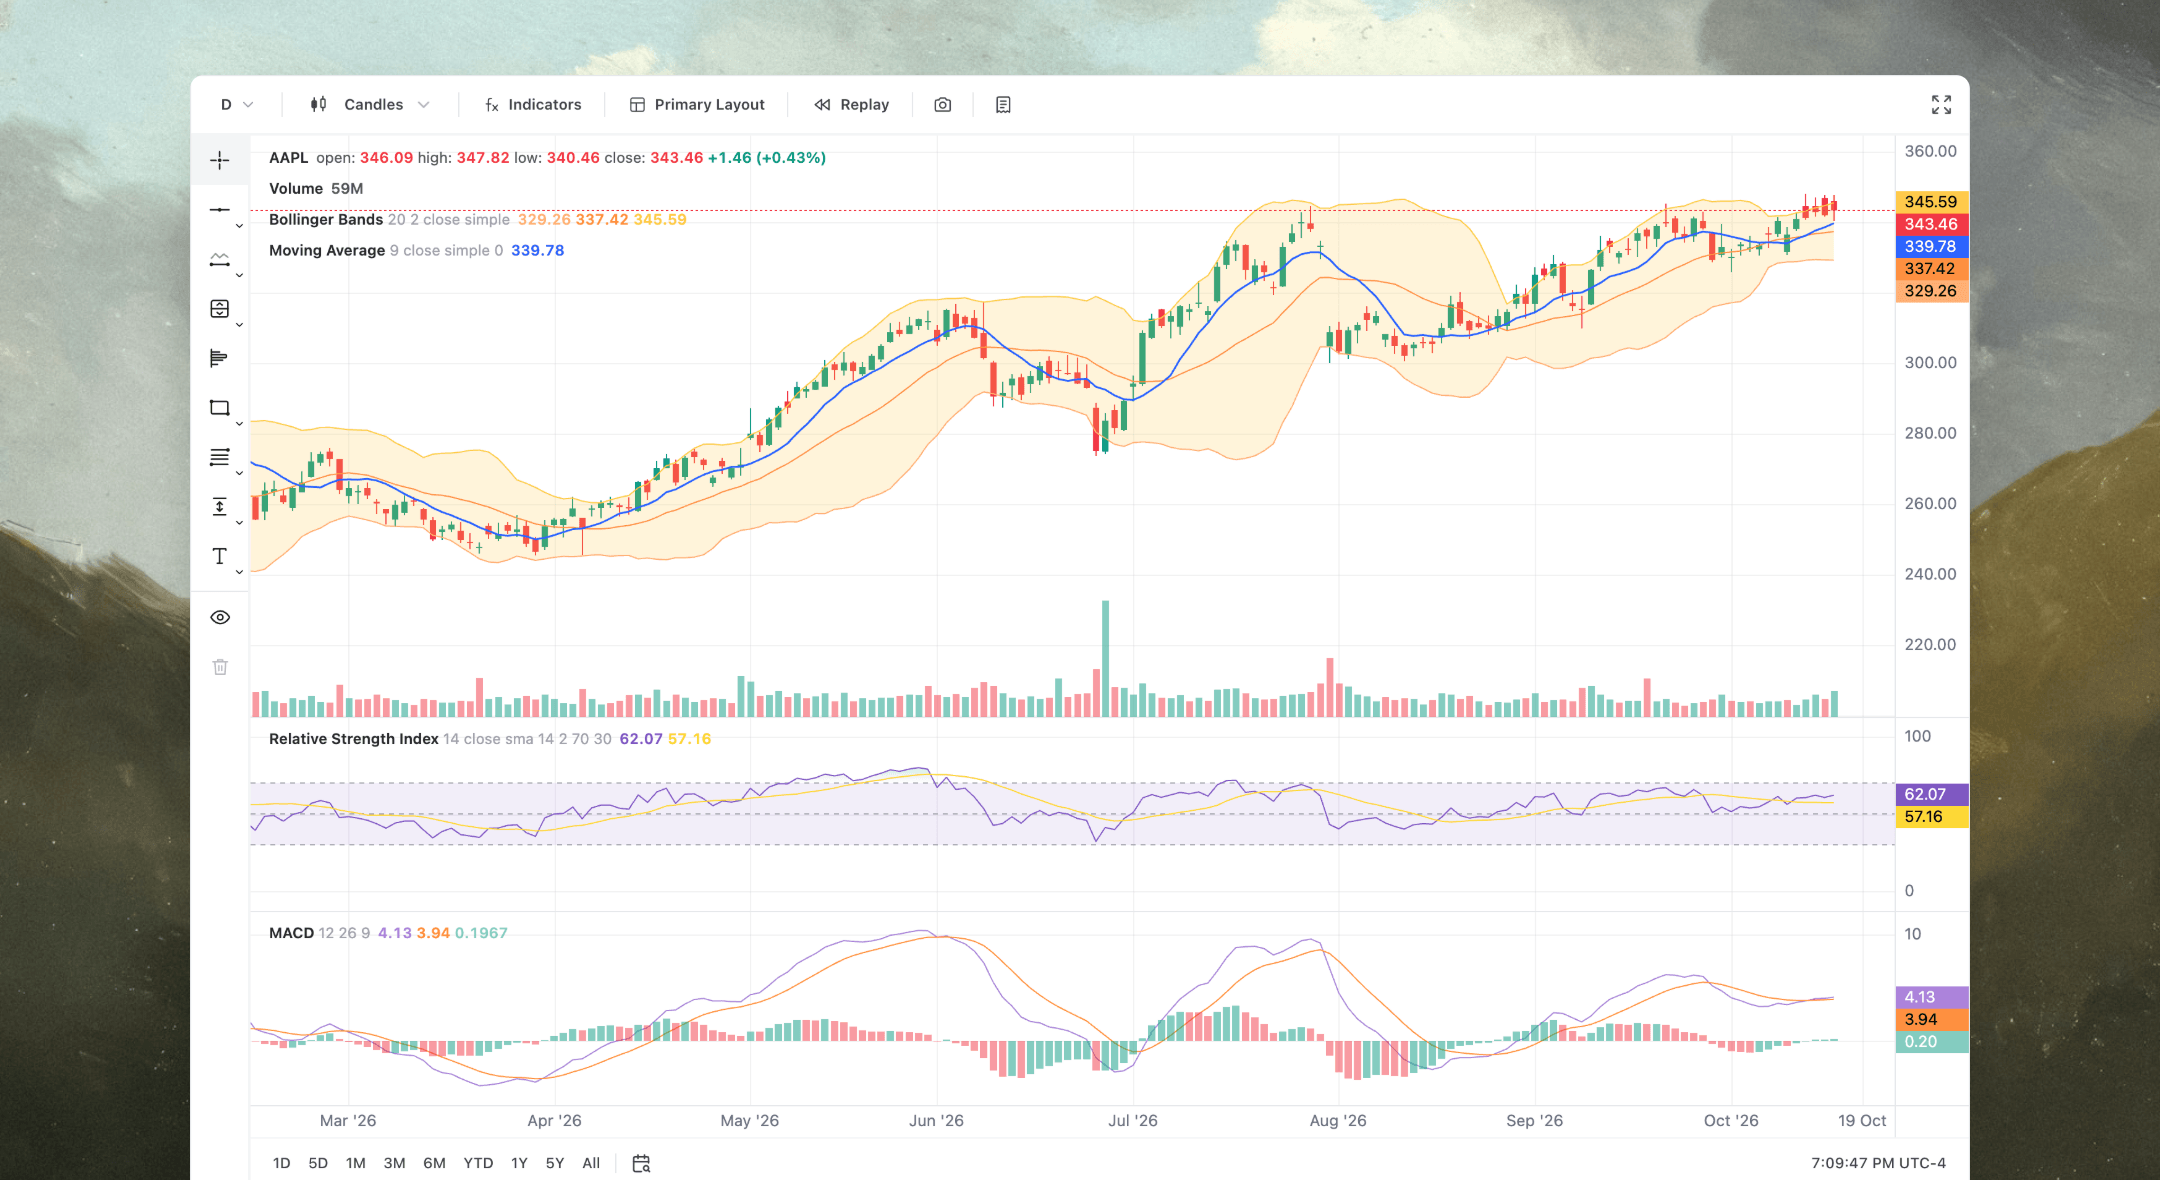
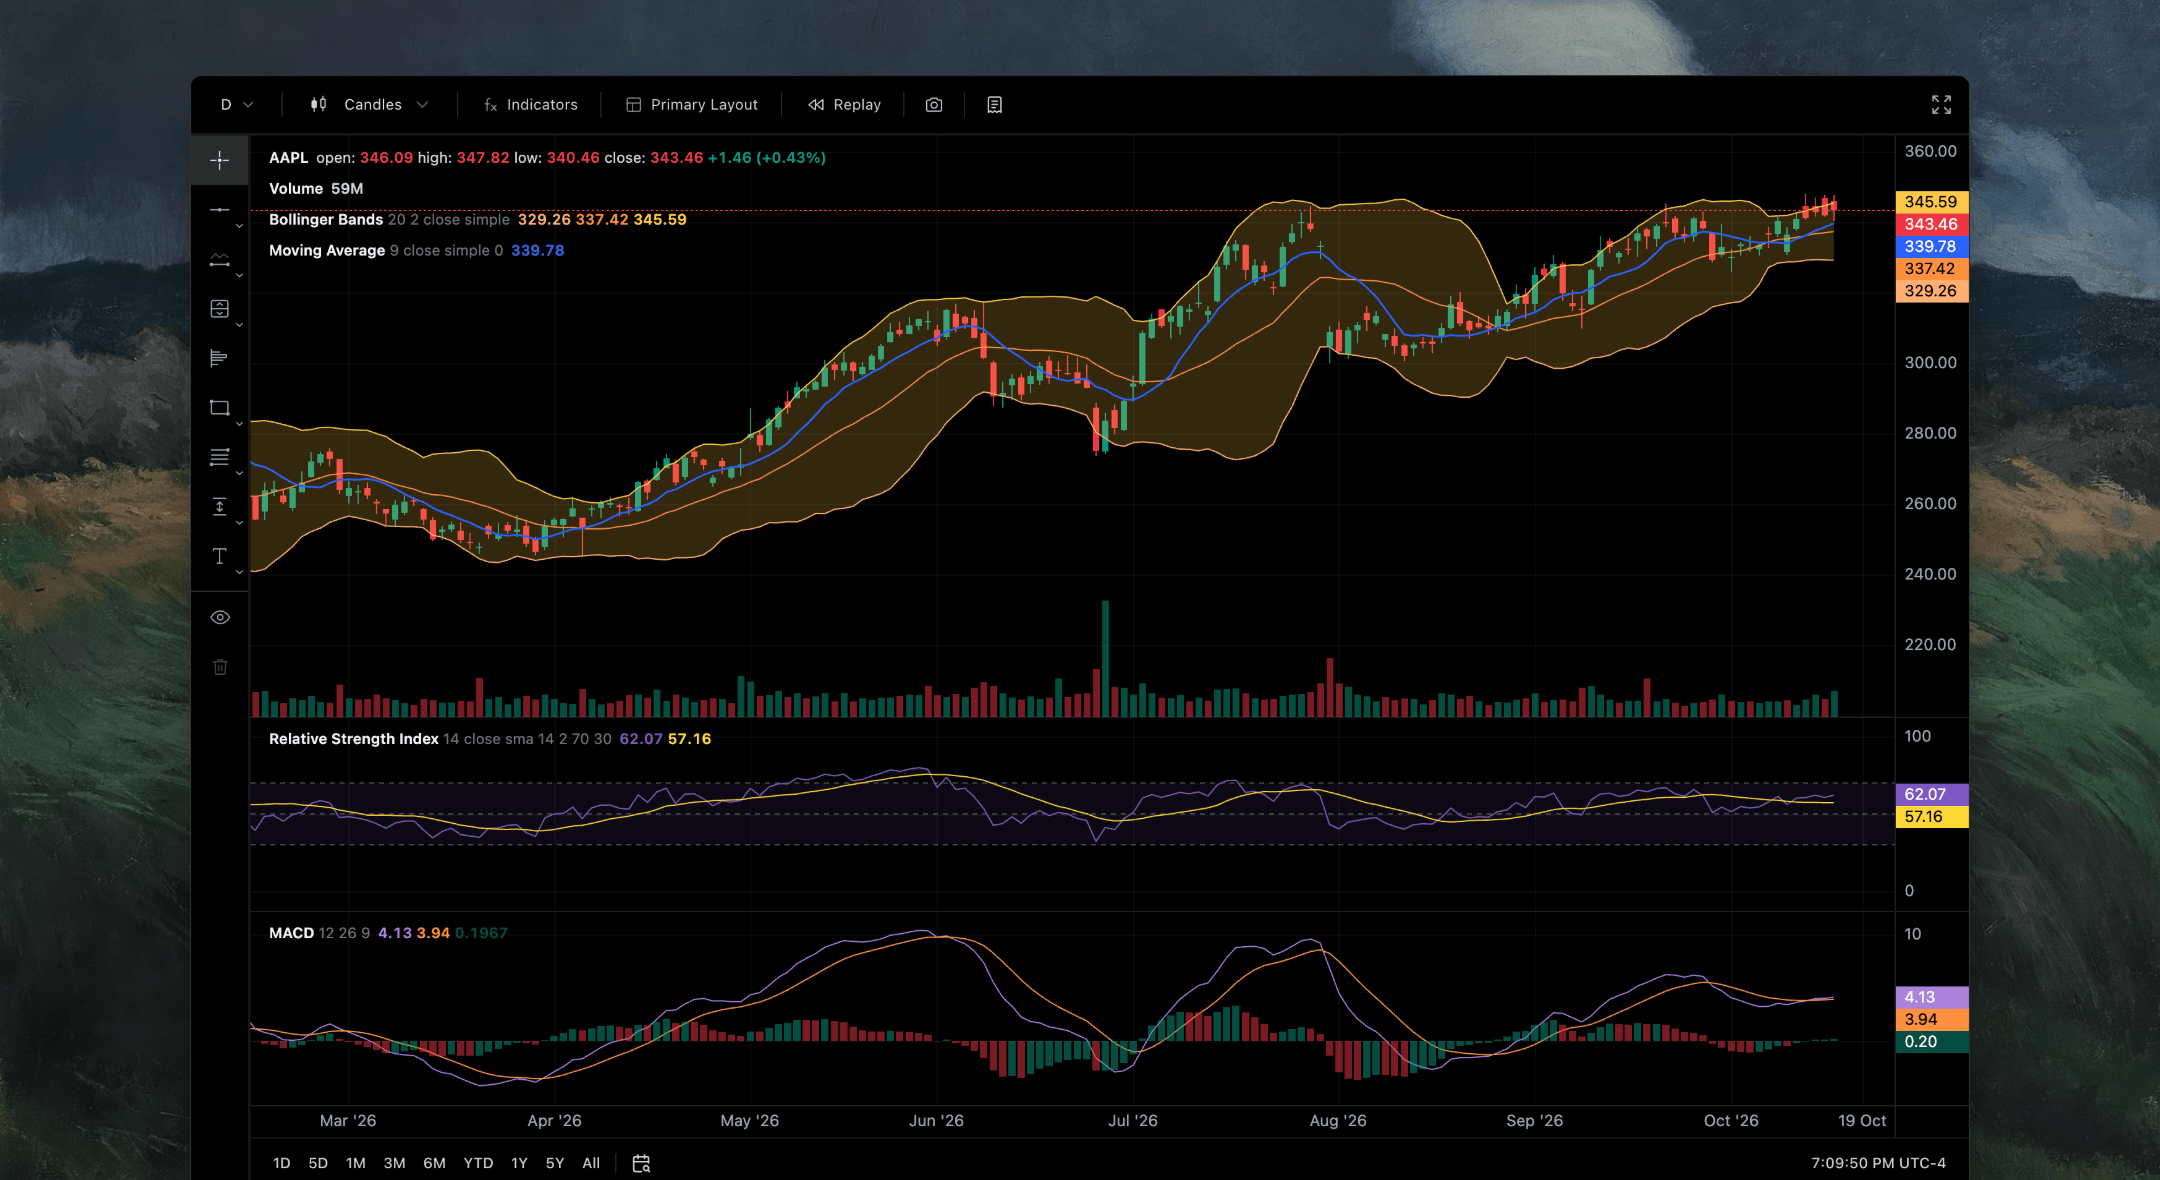
Powerful Amsflow Chart Engine II, so you can do more.
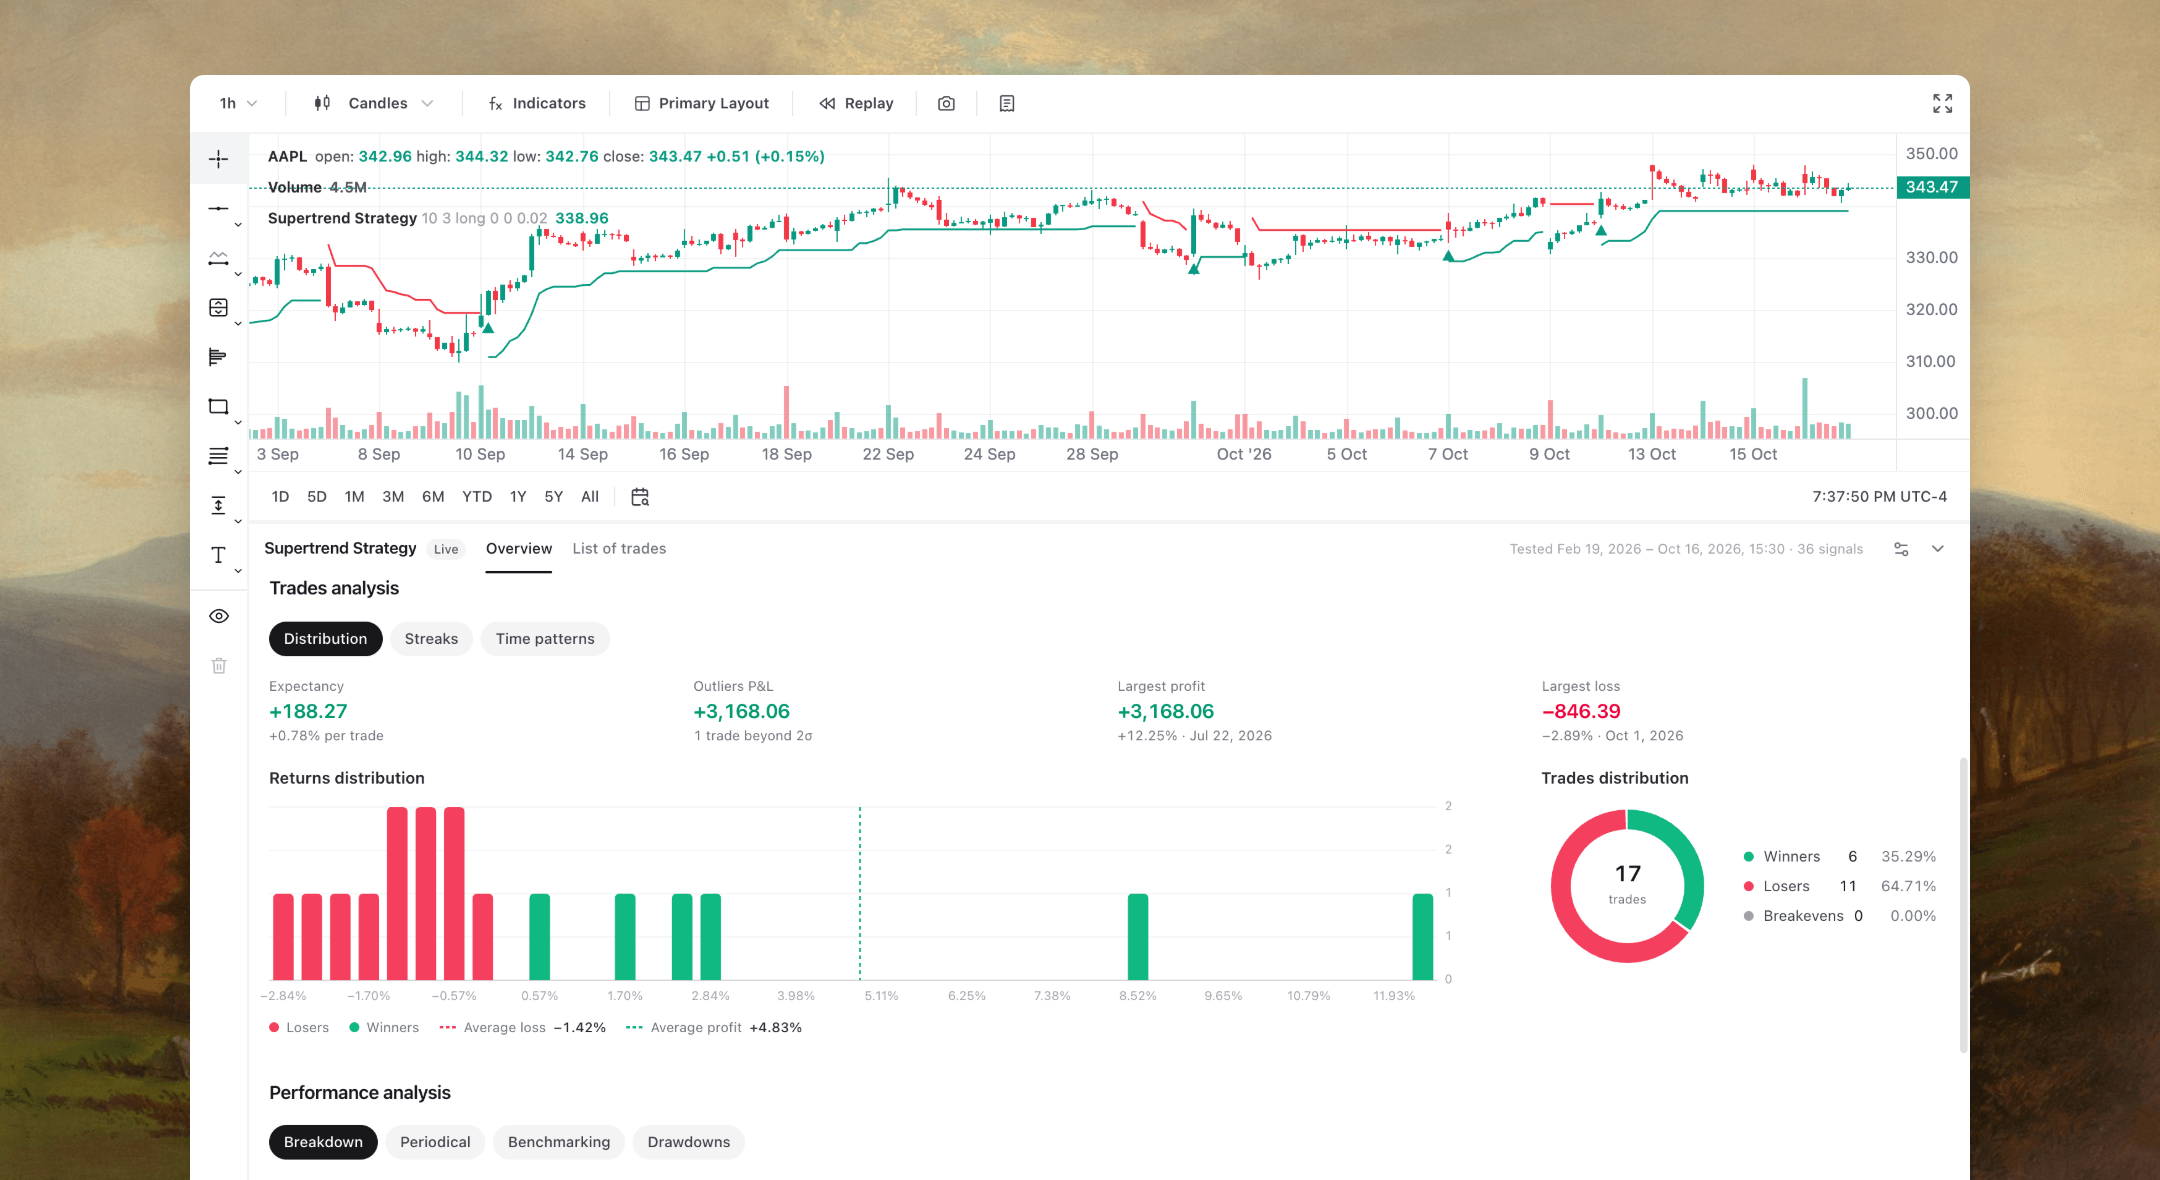
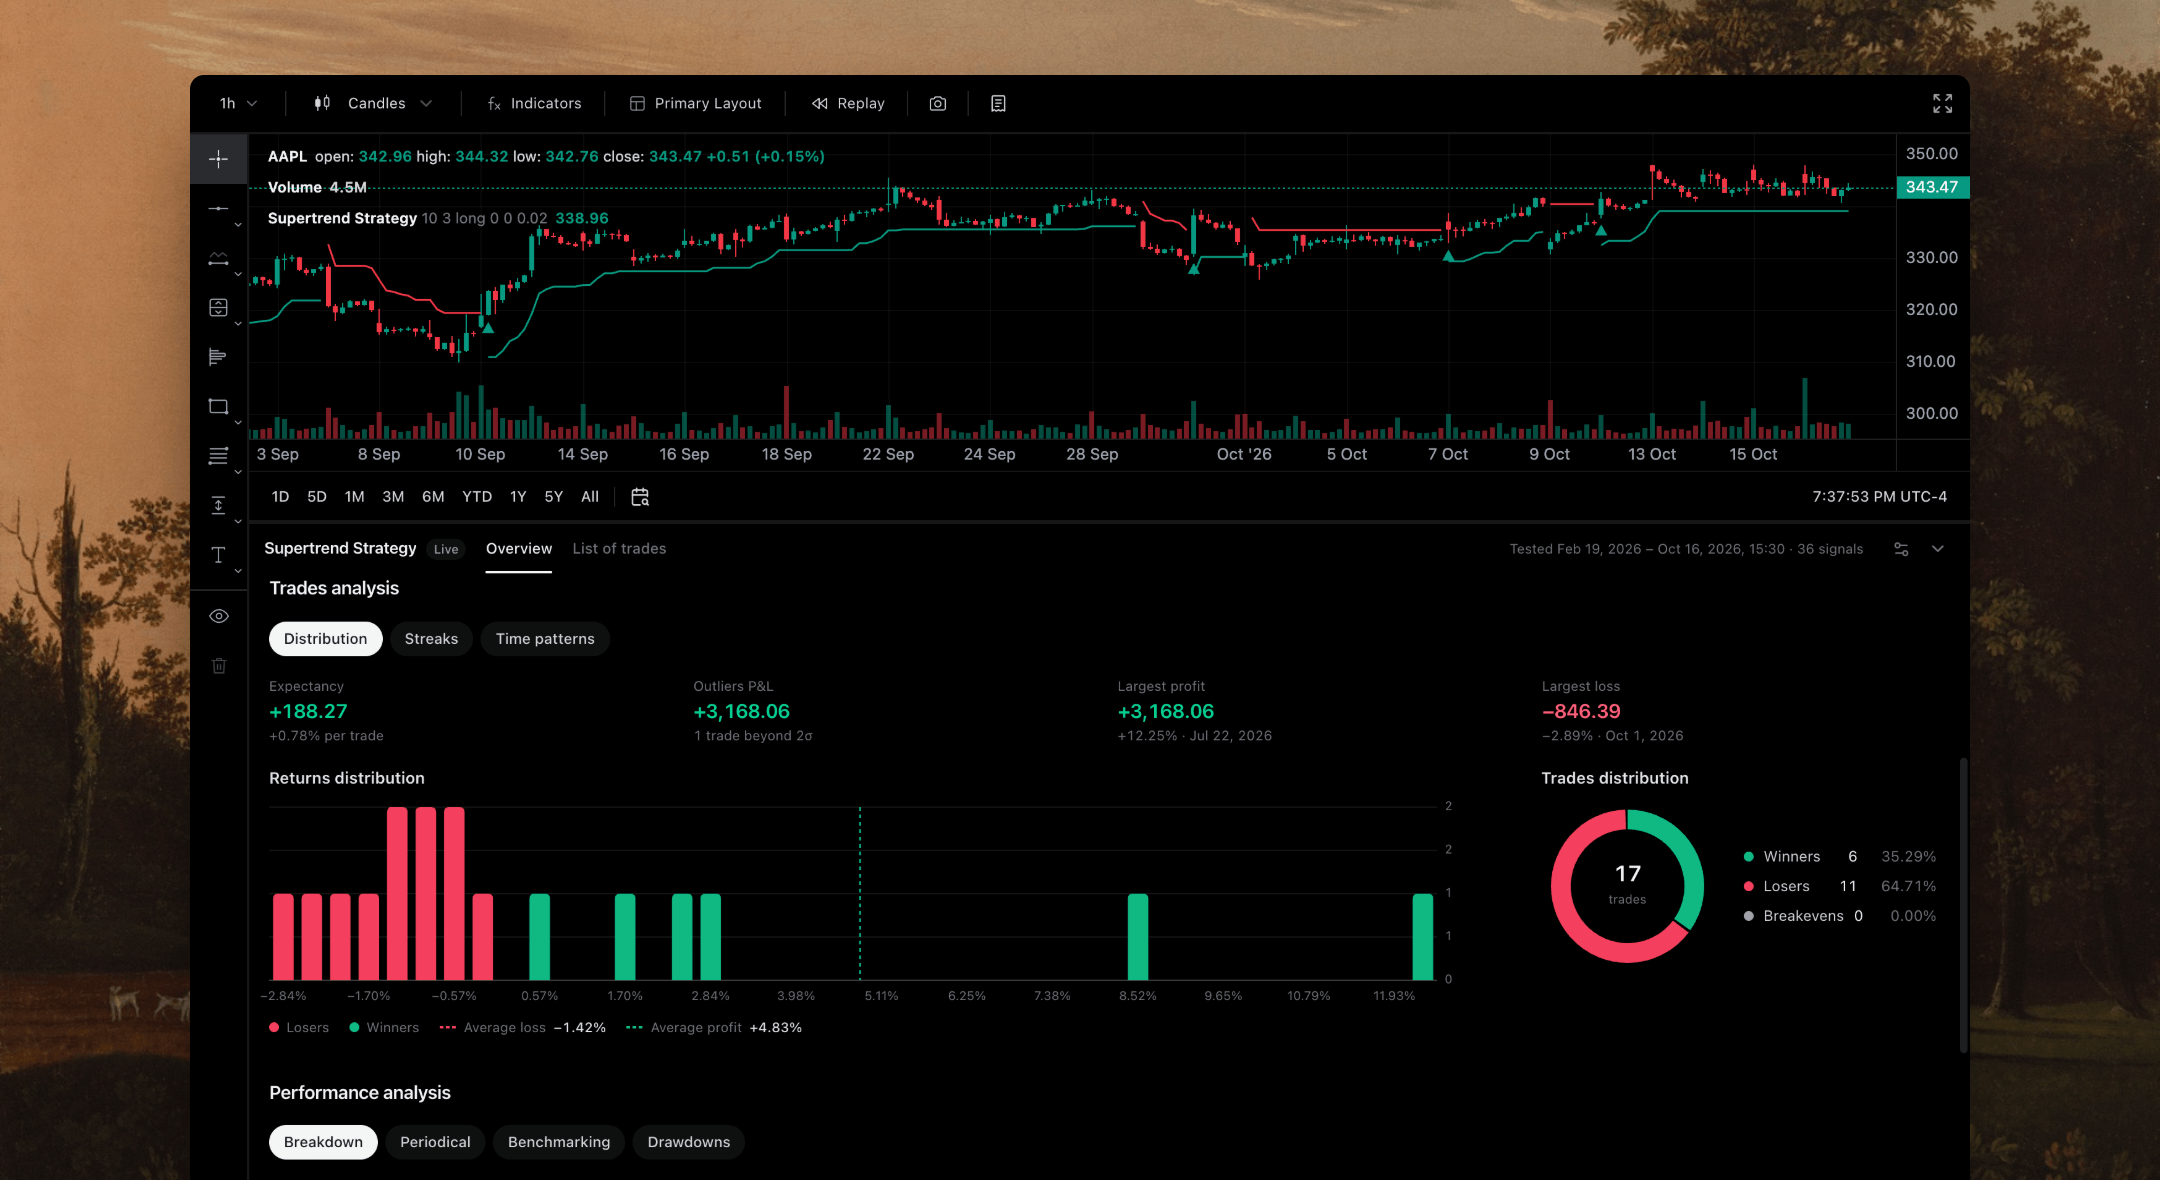
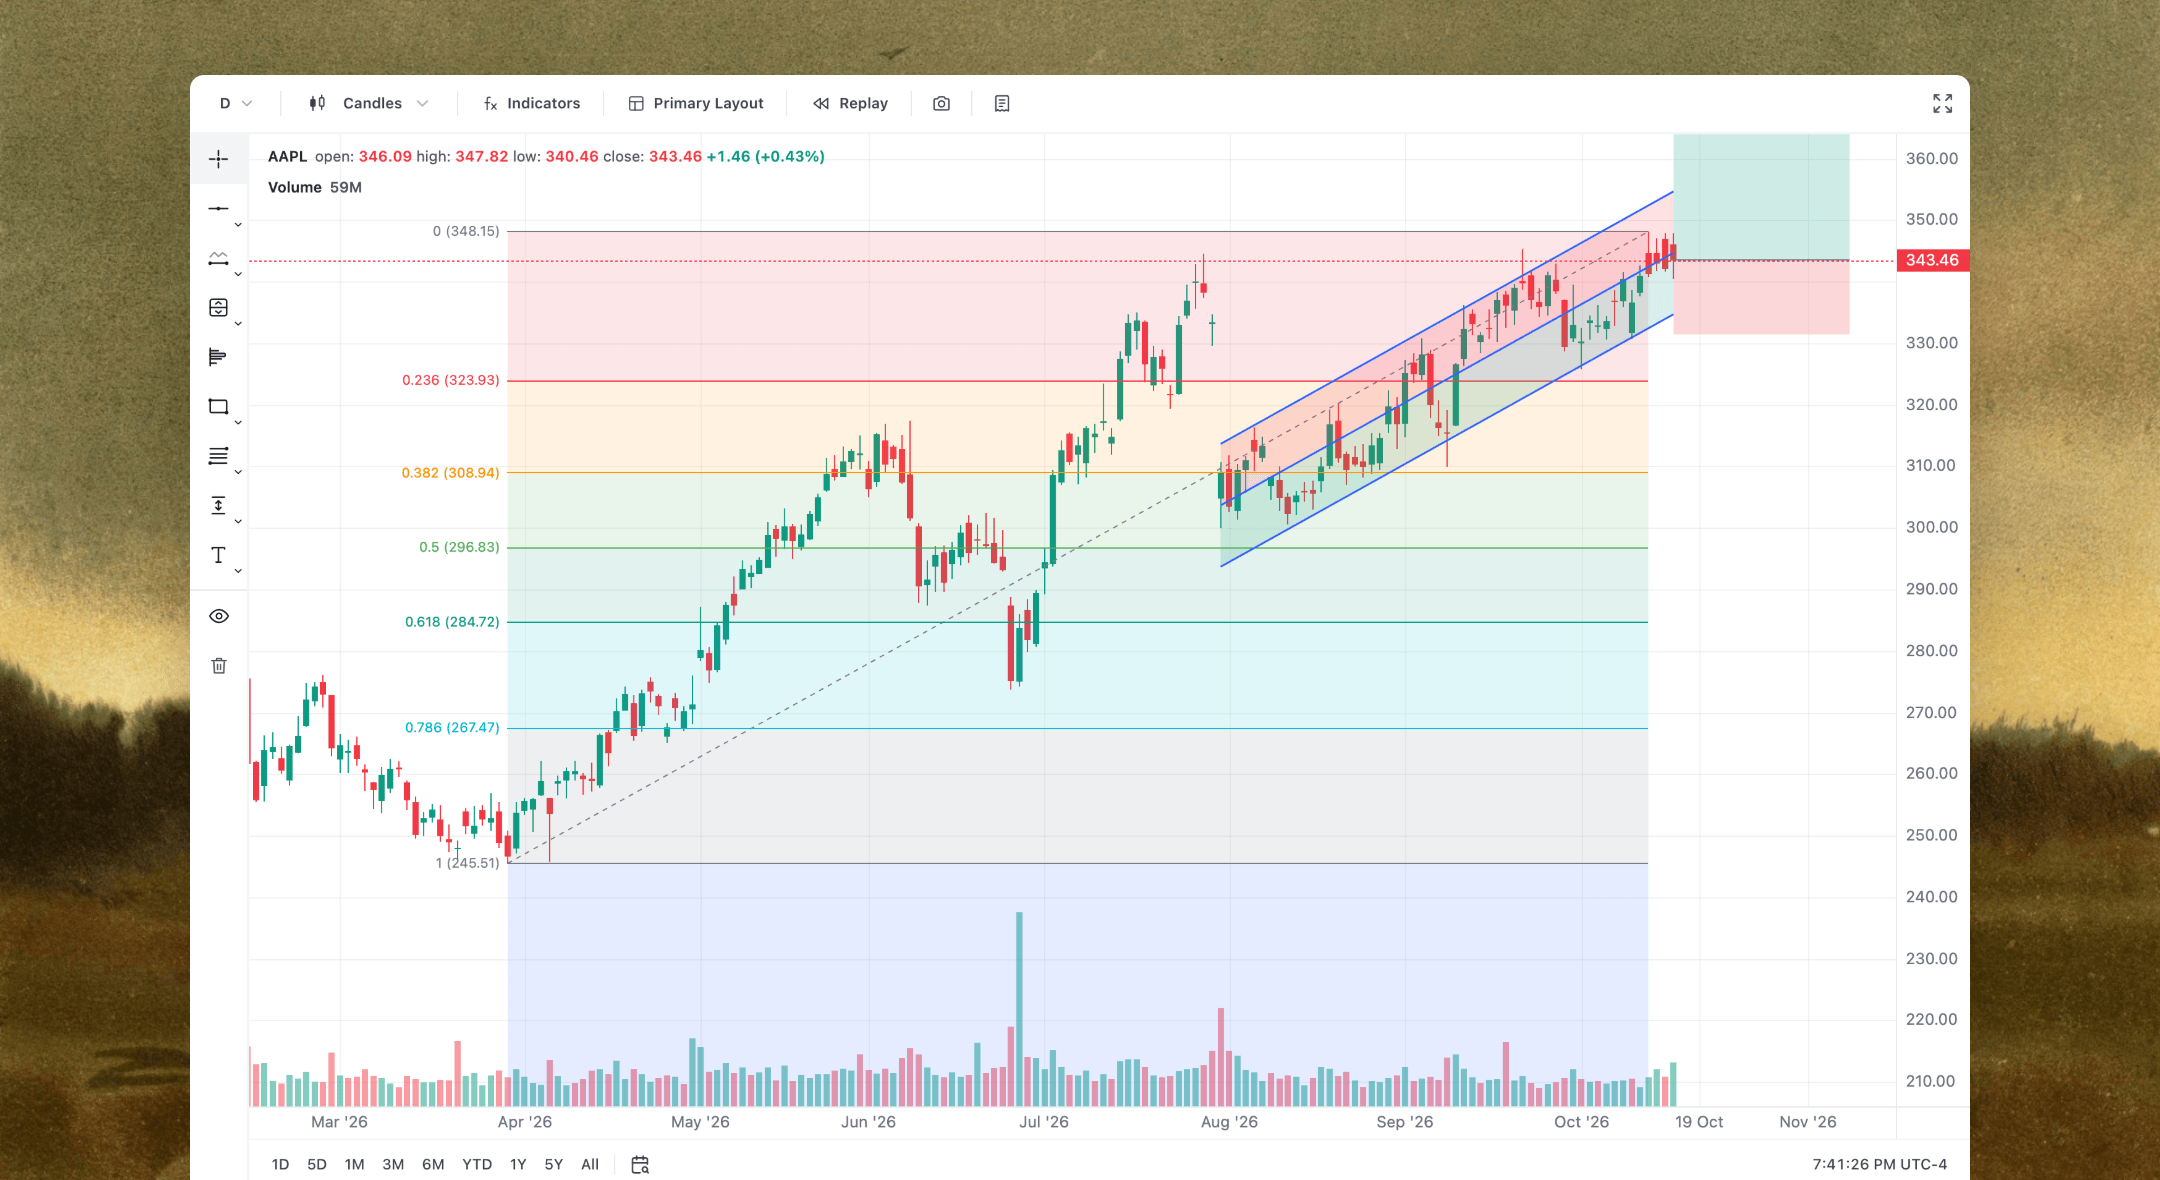
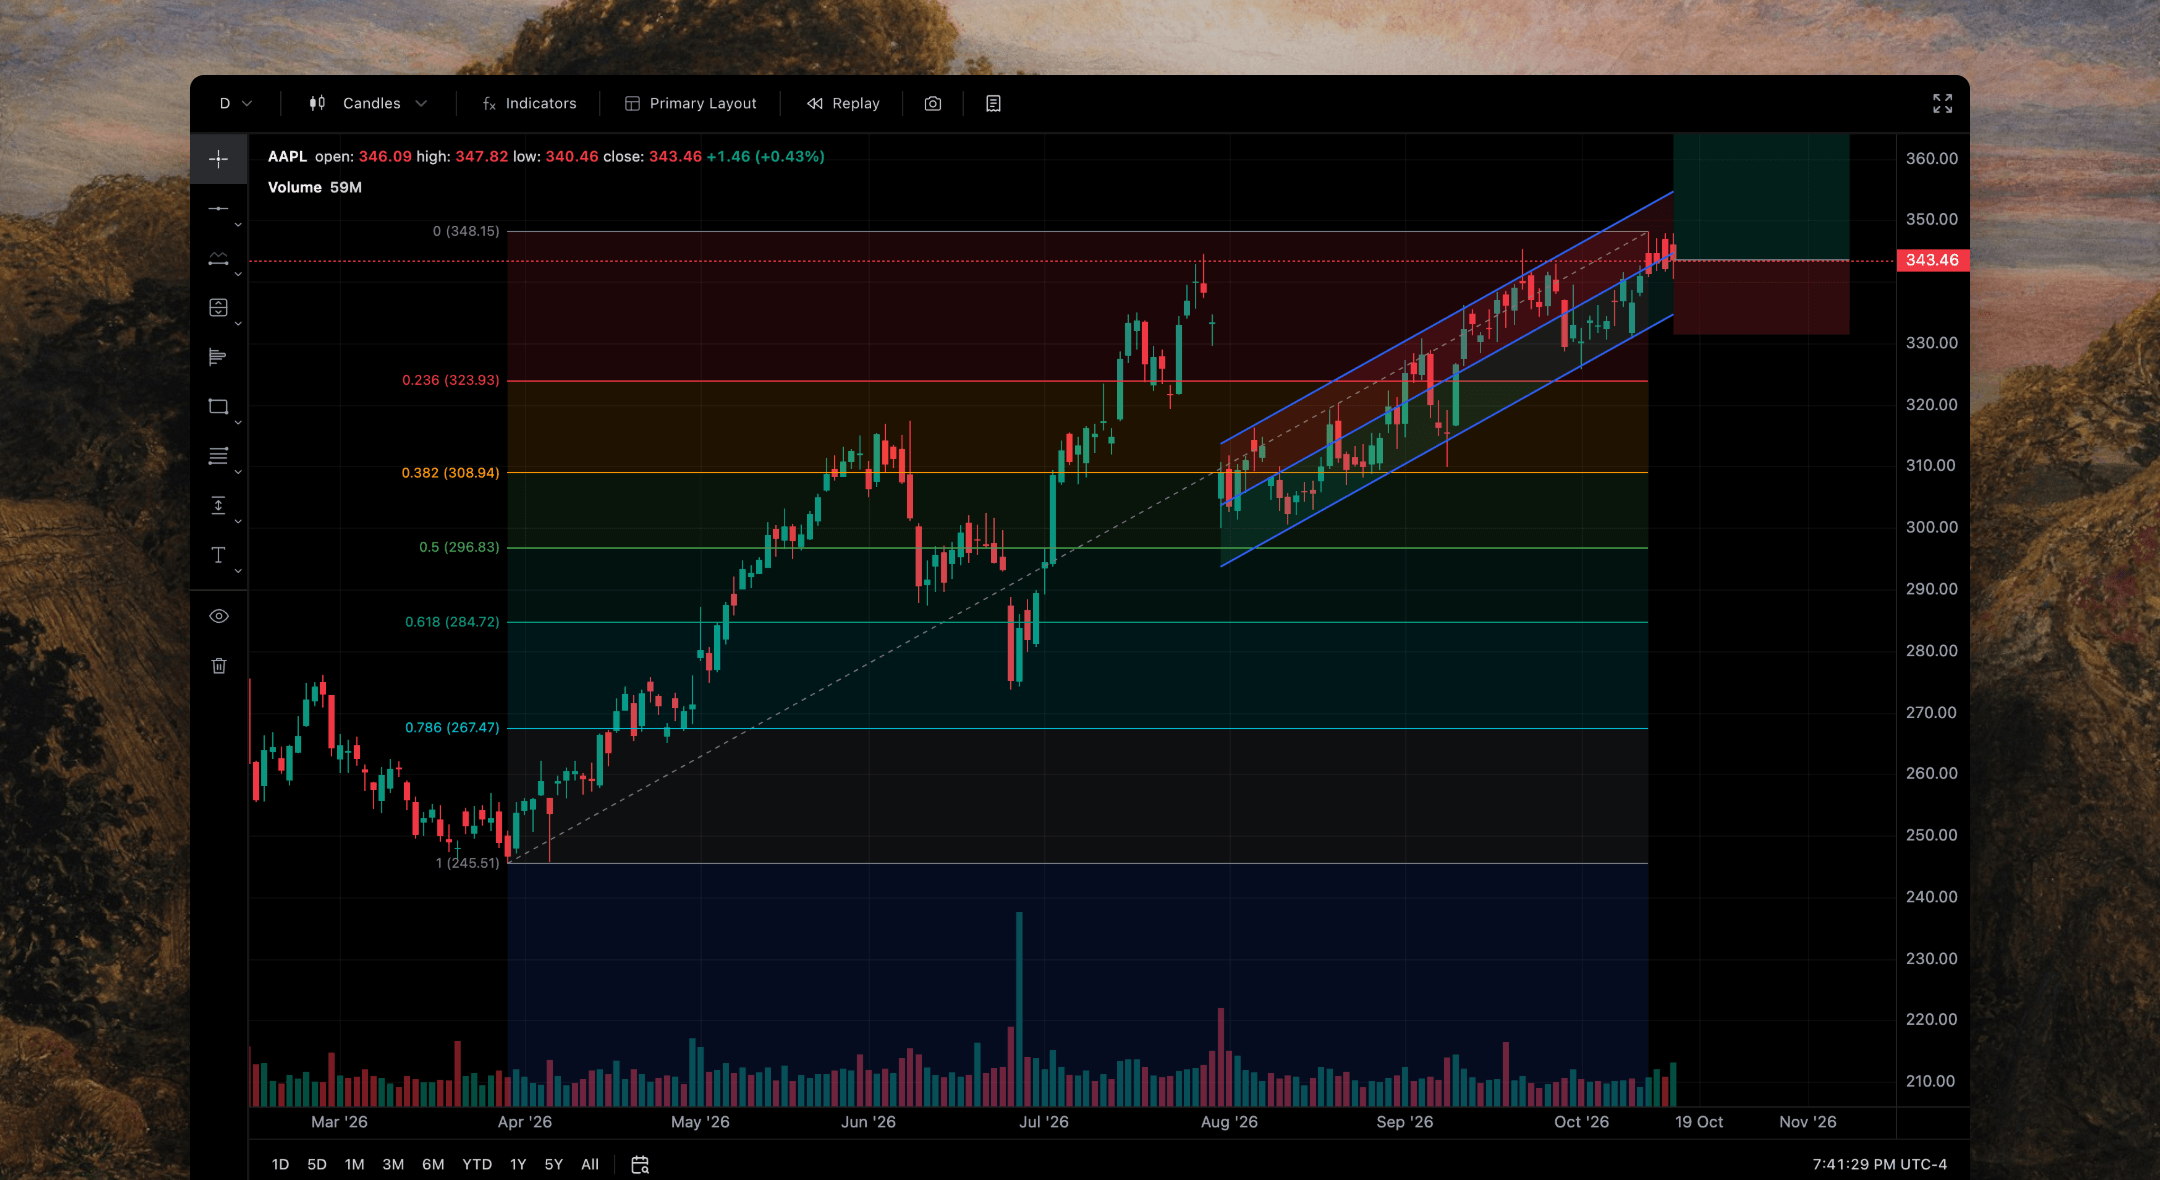
74 indicators, 59 drawing tools and 19 chart types, with Market Profile, Volume Footprint, pattern recognition, Bar Replay and paper trading, on layouts of up to 16 charts.
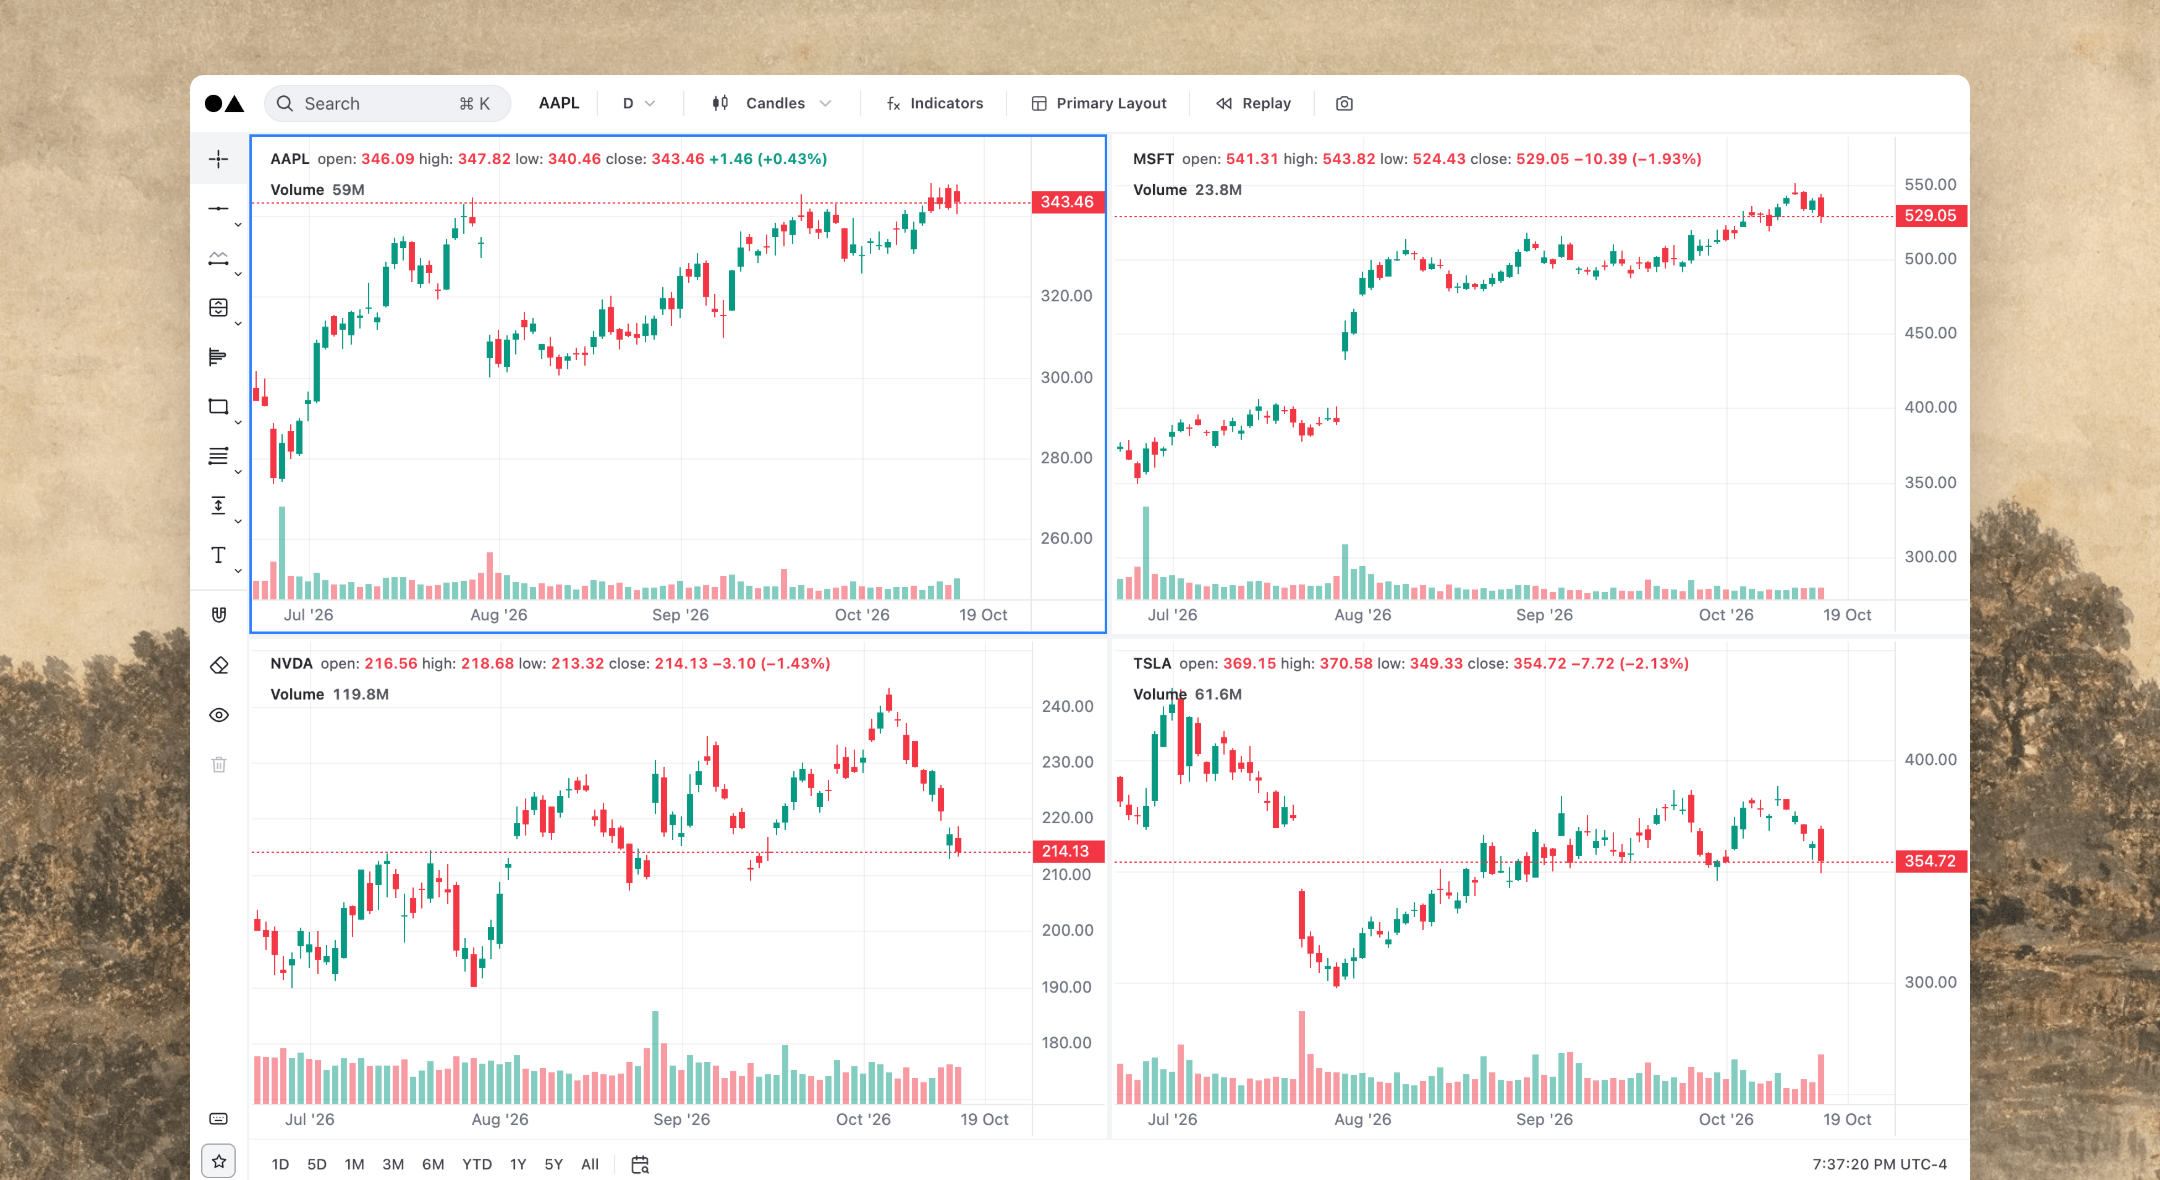
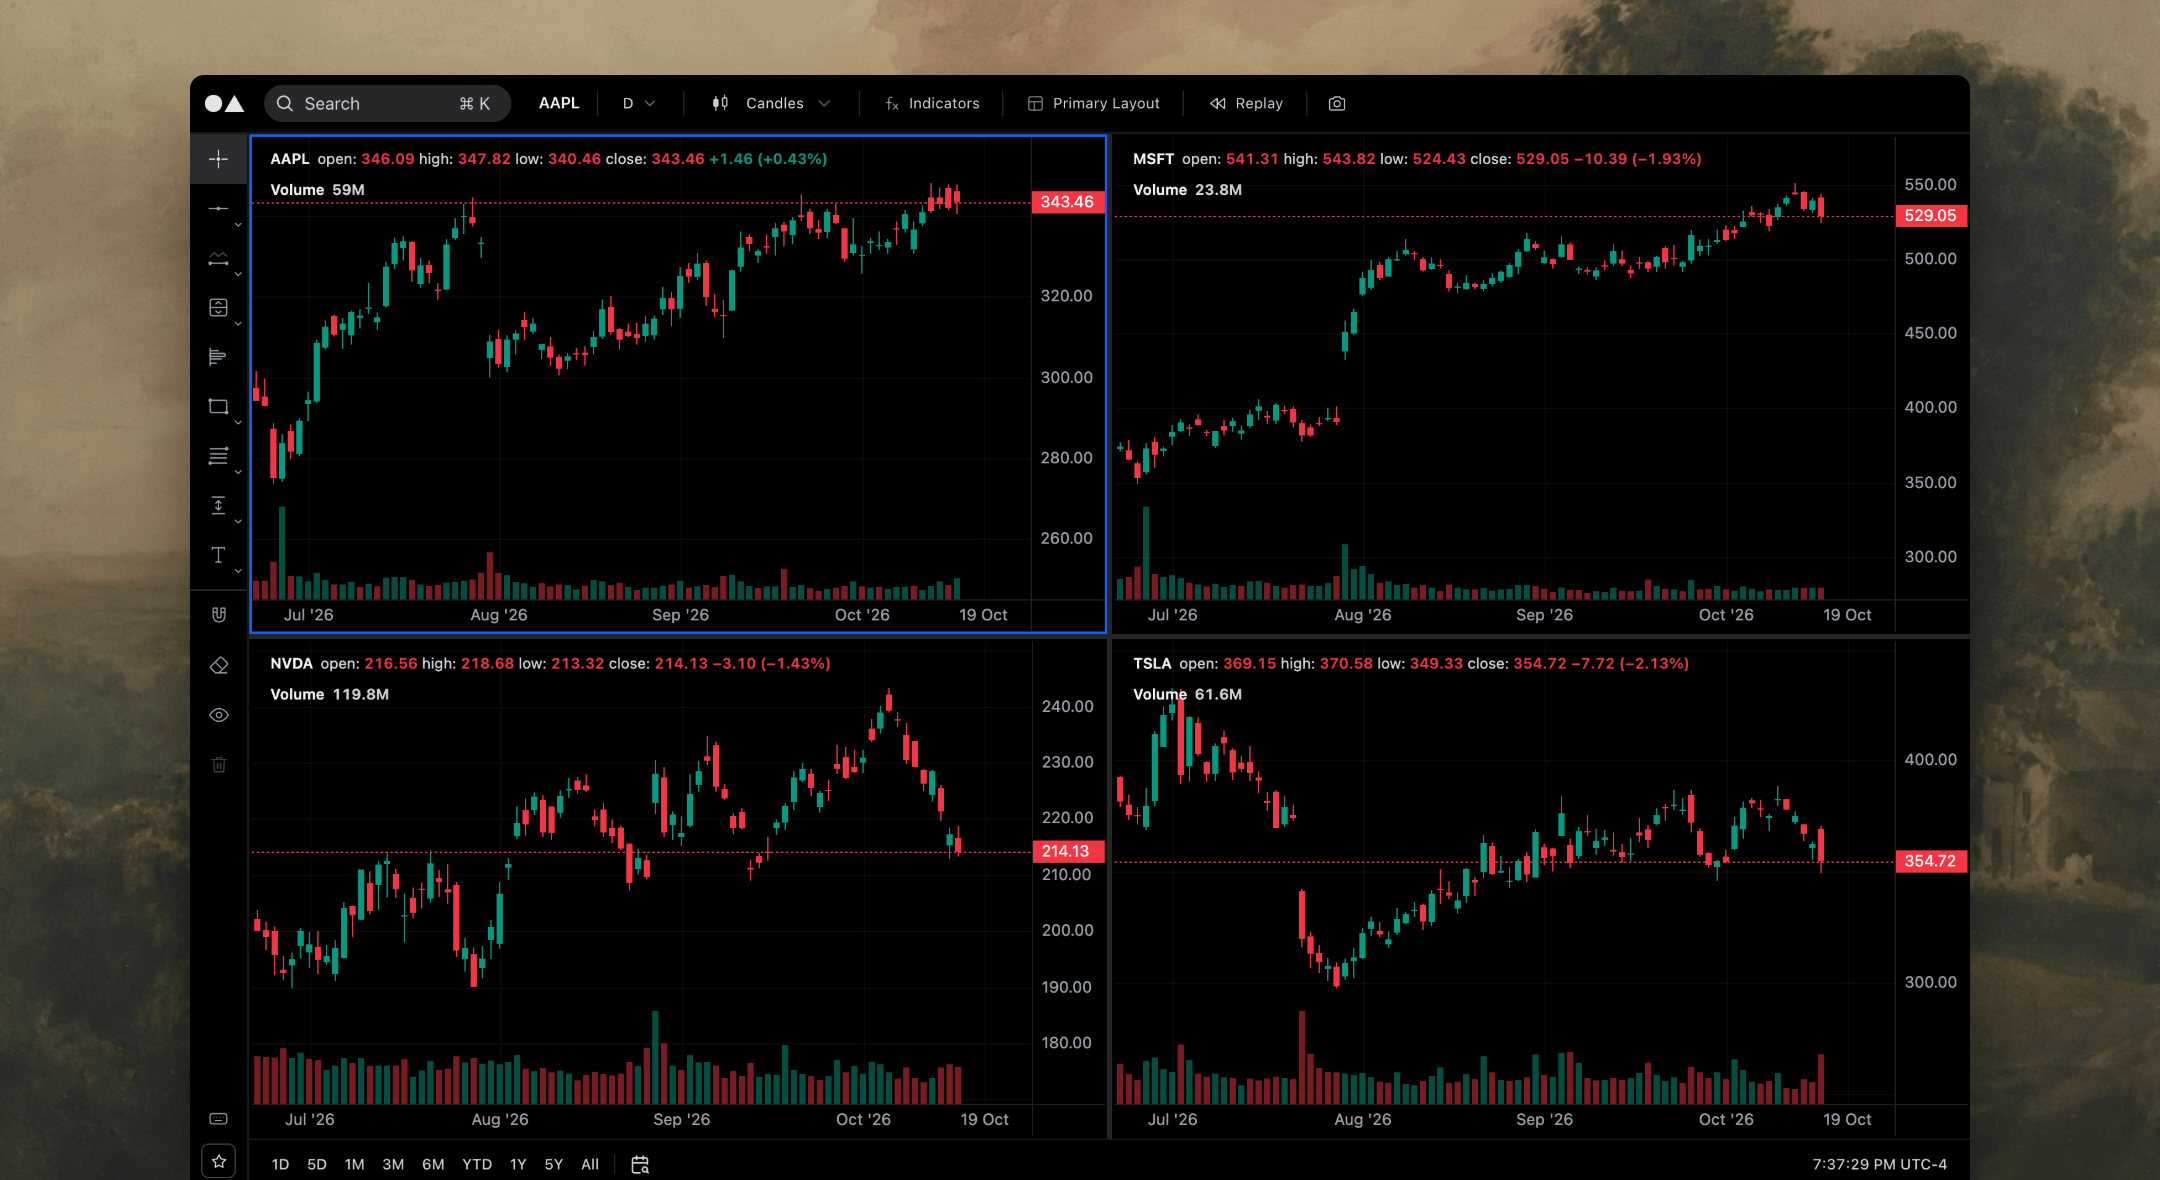
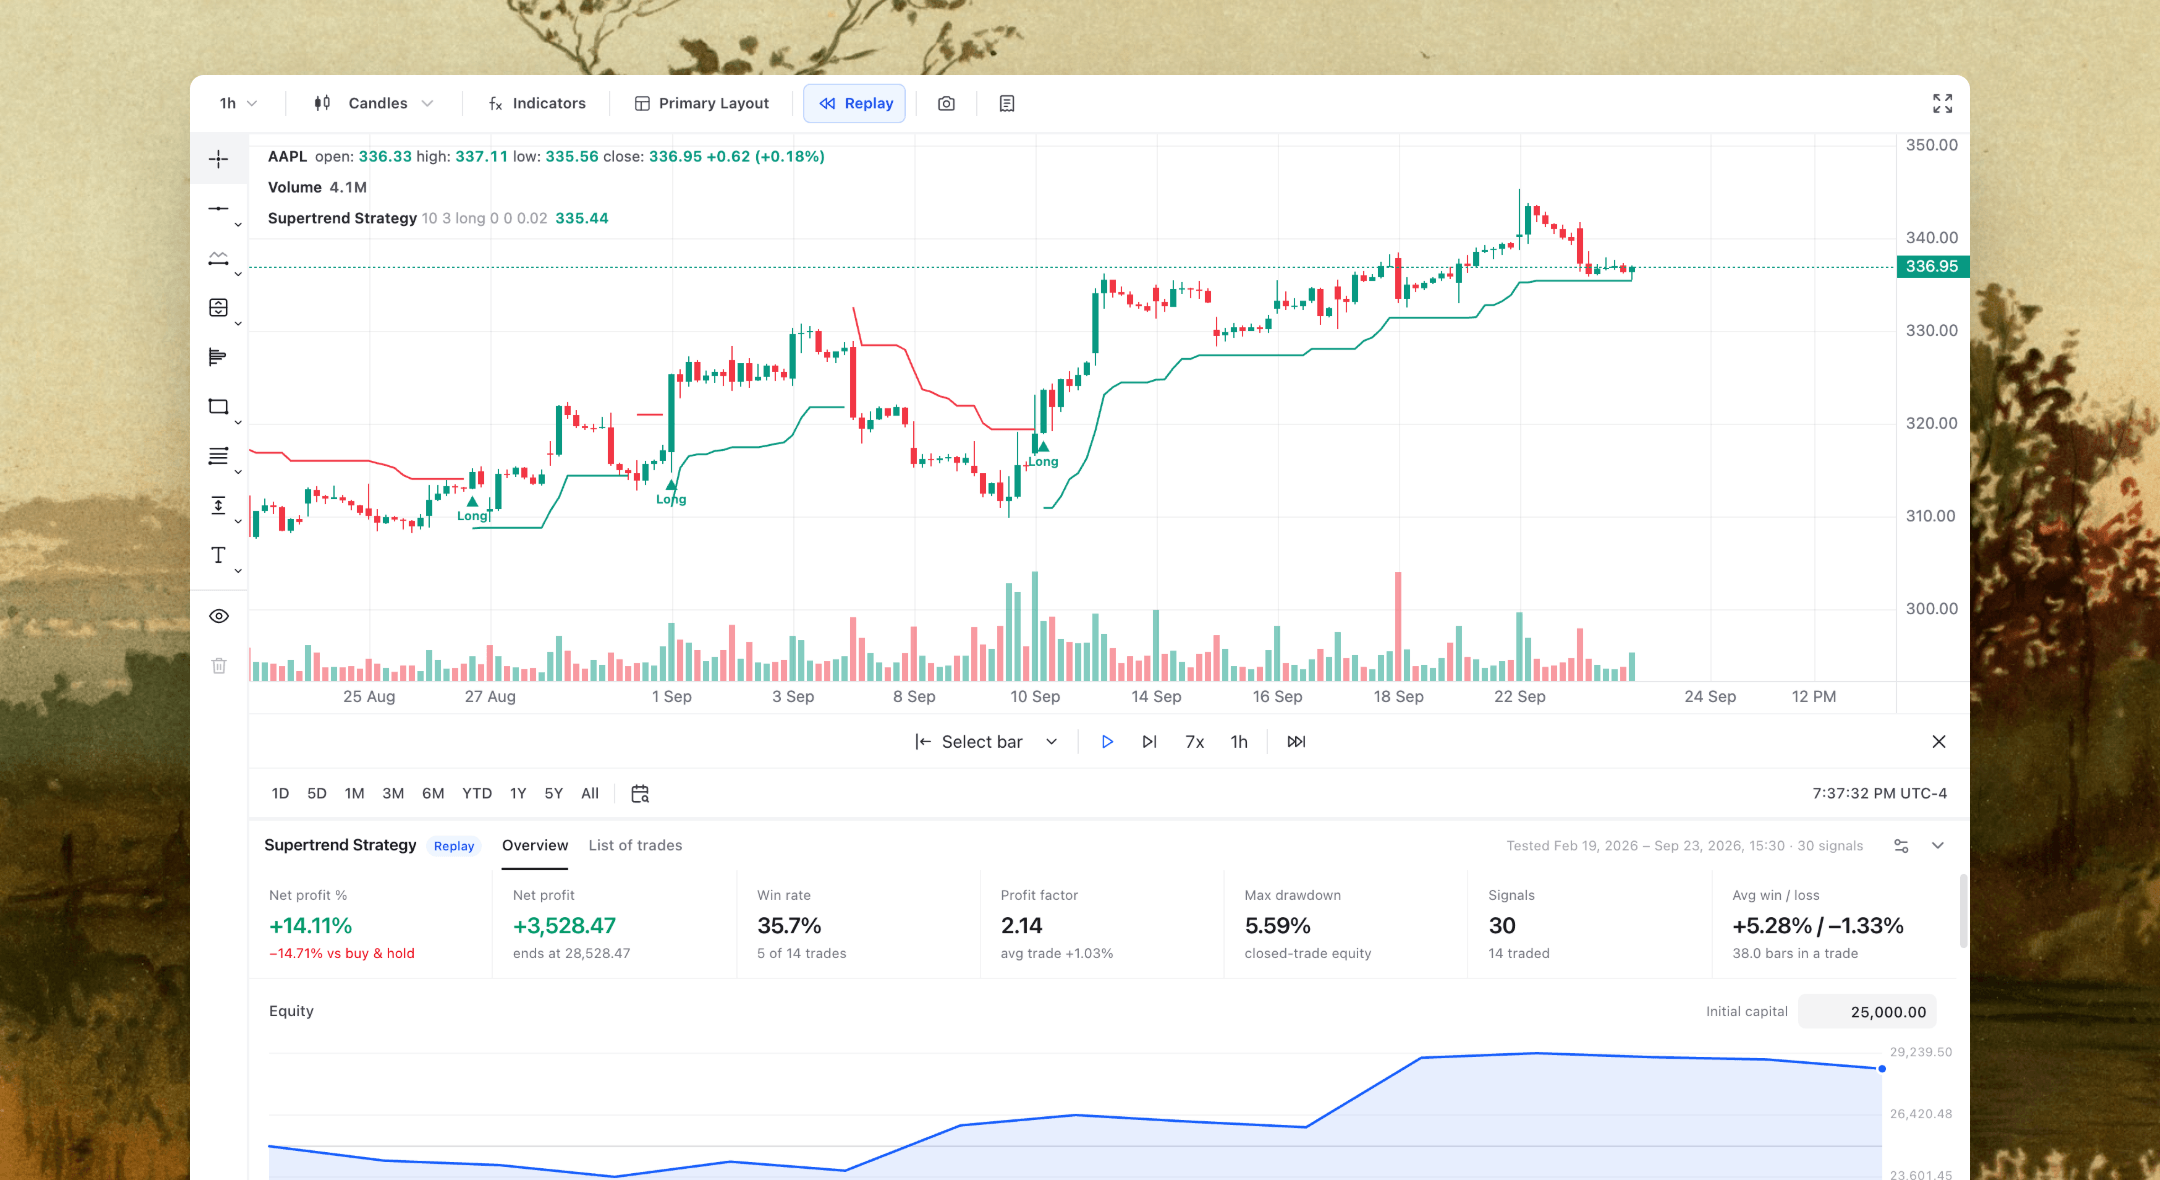
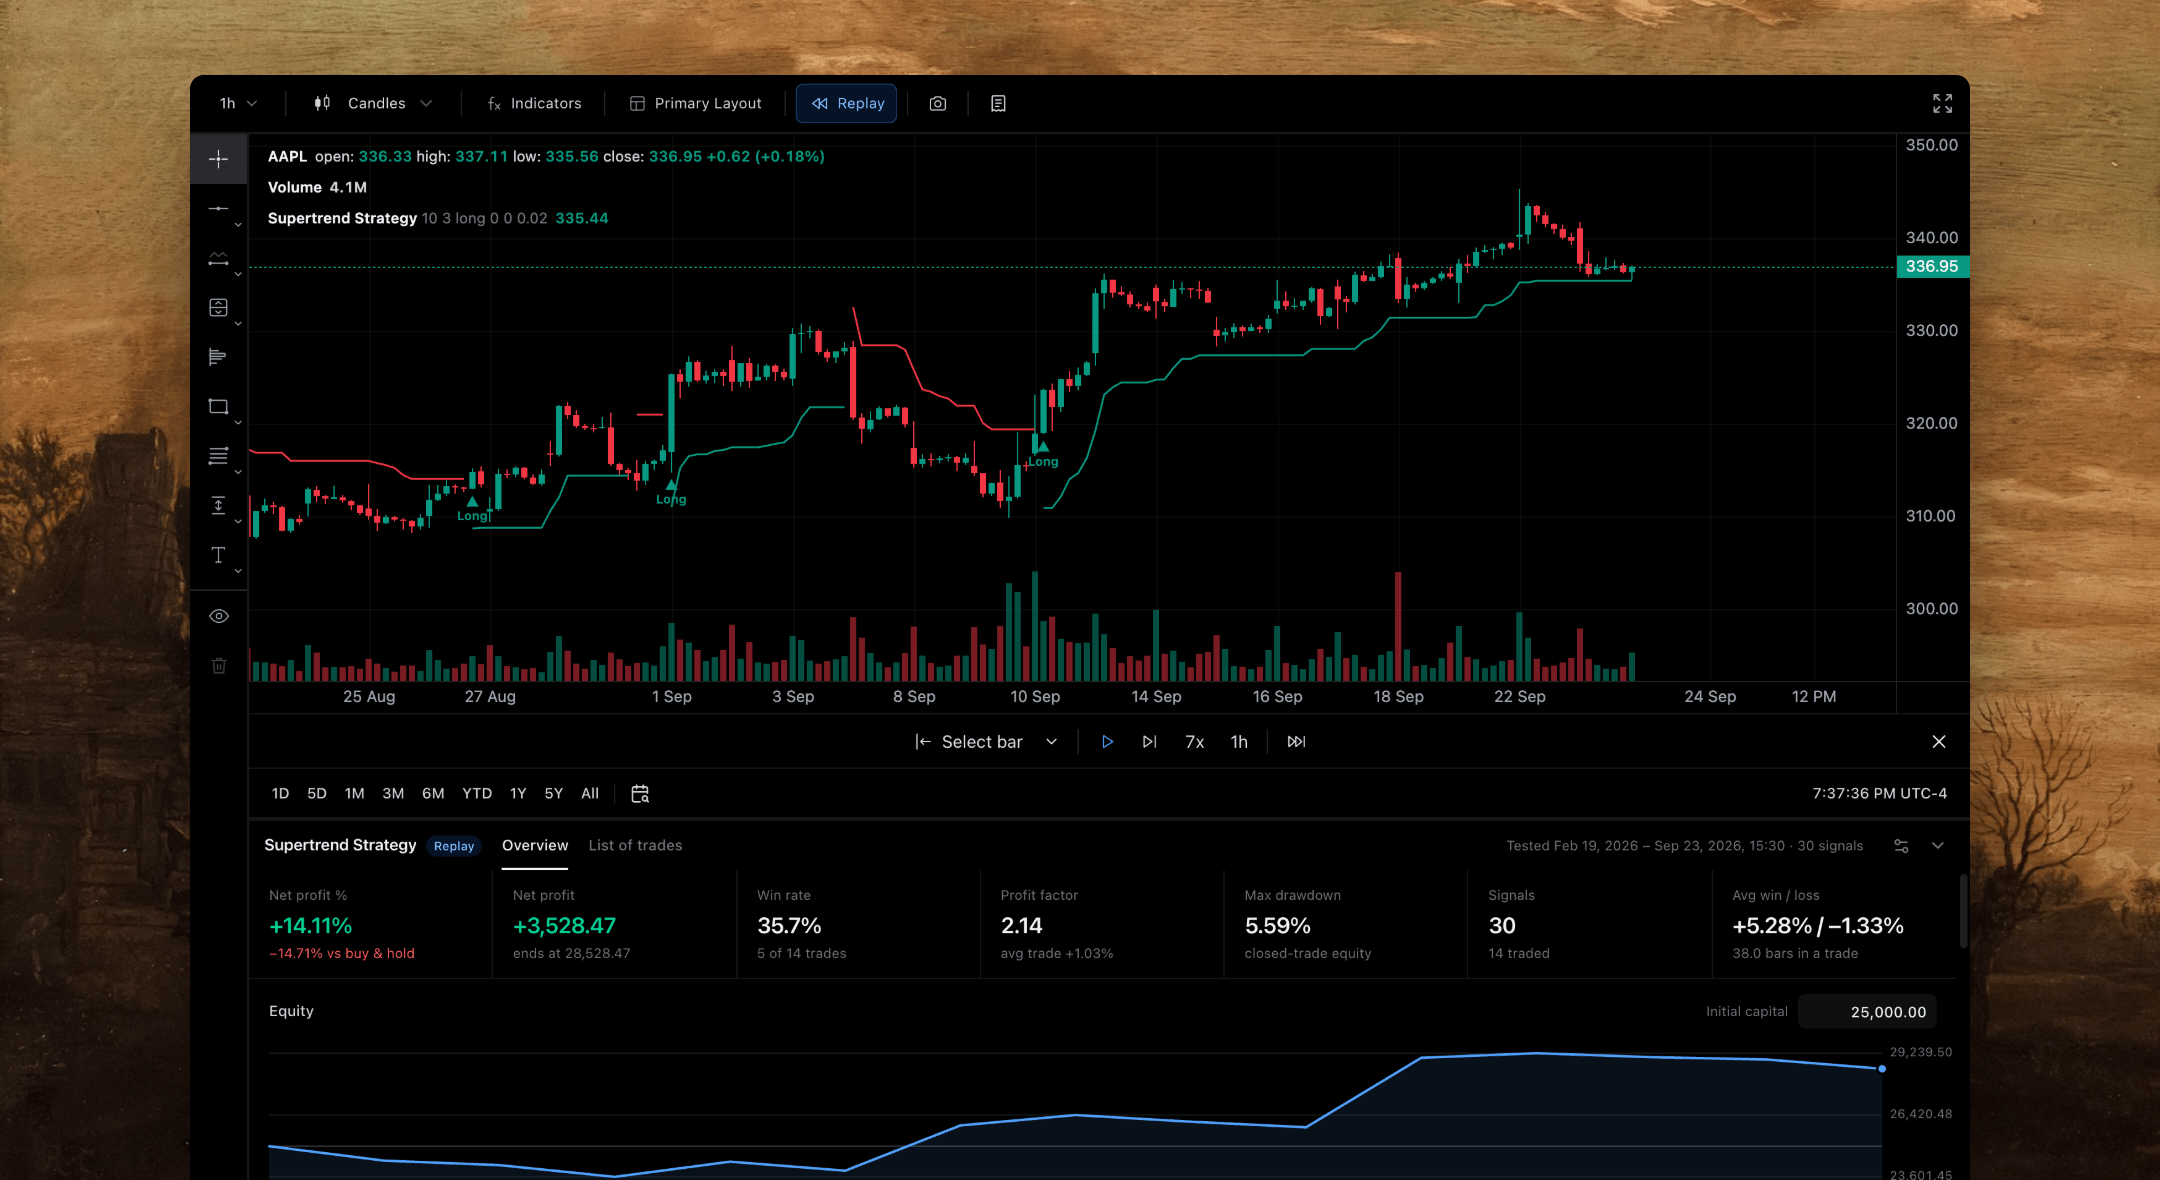
74 indicators
From RSI, MACD and Bollinger Bands to Ichimoku, Smart Money Concepts, Key Levels and Liquidity Swings.
Higher timeframes
Run supported indicators on a higher timeframe than the chart, like a daily RSI on a 15-minute chart.
Divergences on the pane
Regular and hidden divergences on RSI, MACD, Stochastic, CCI, MFI, OBV, Awesome Oscillator and Momentum.
Results under the chart
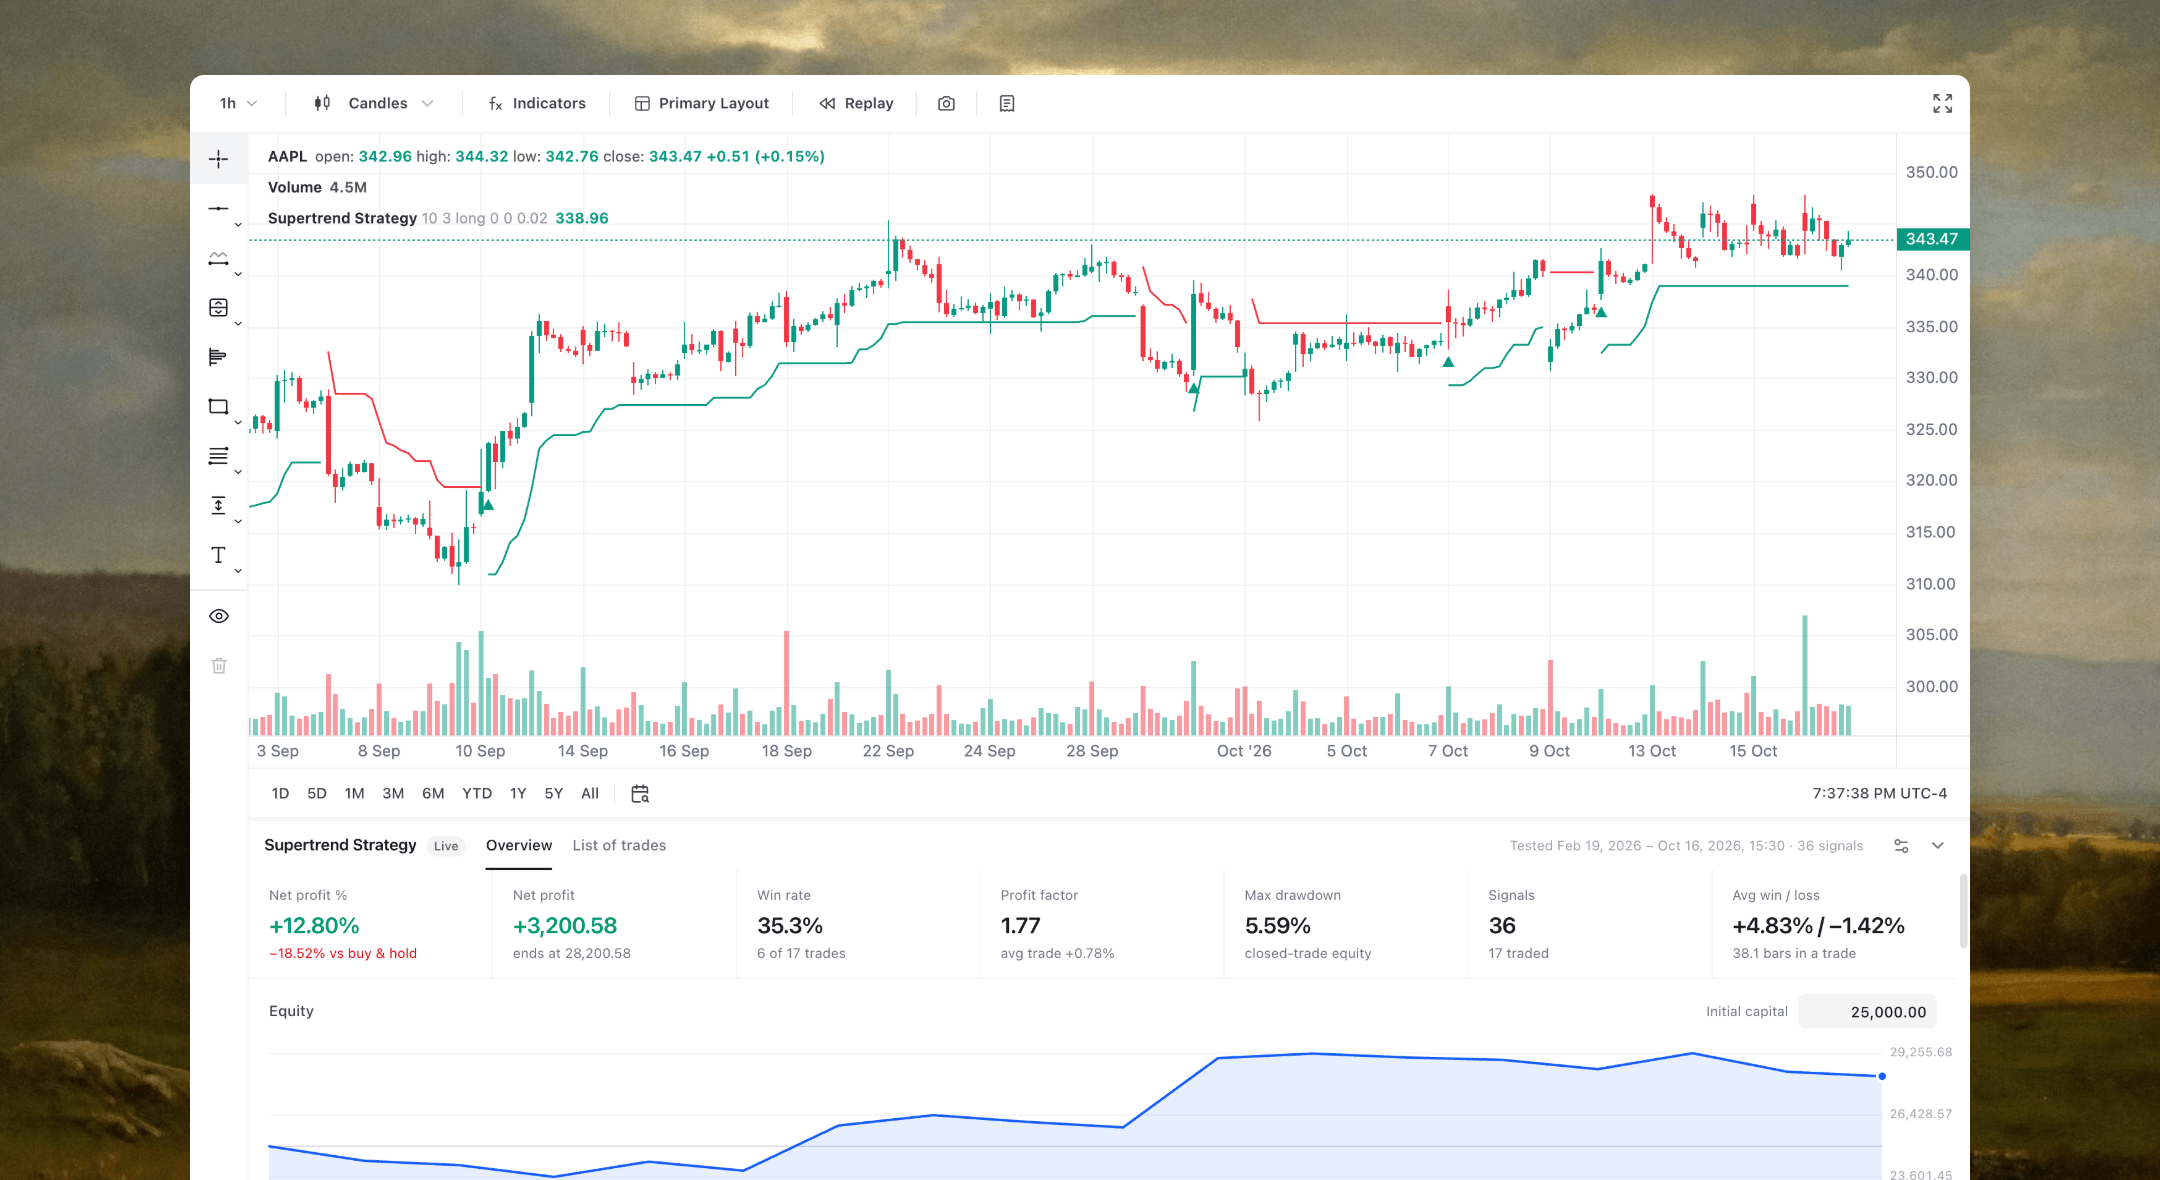
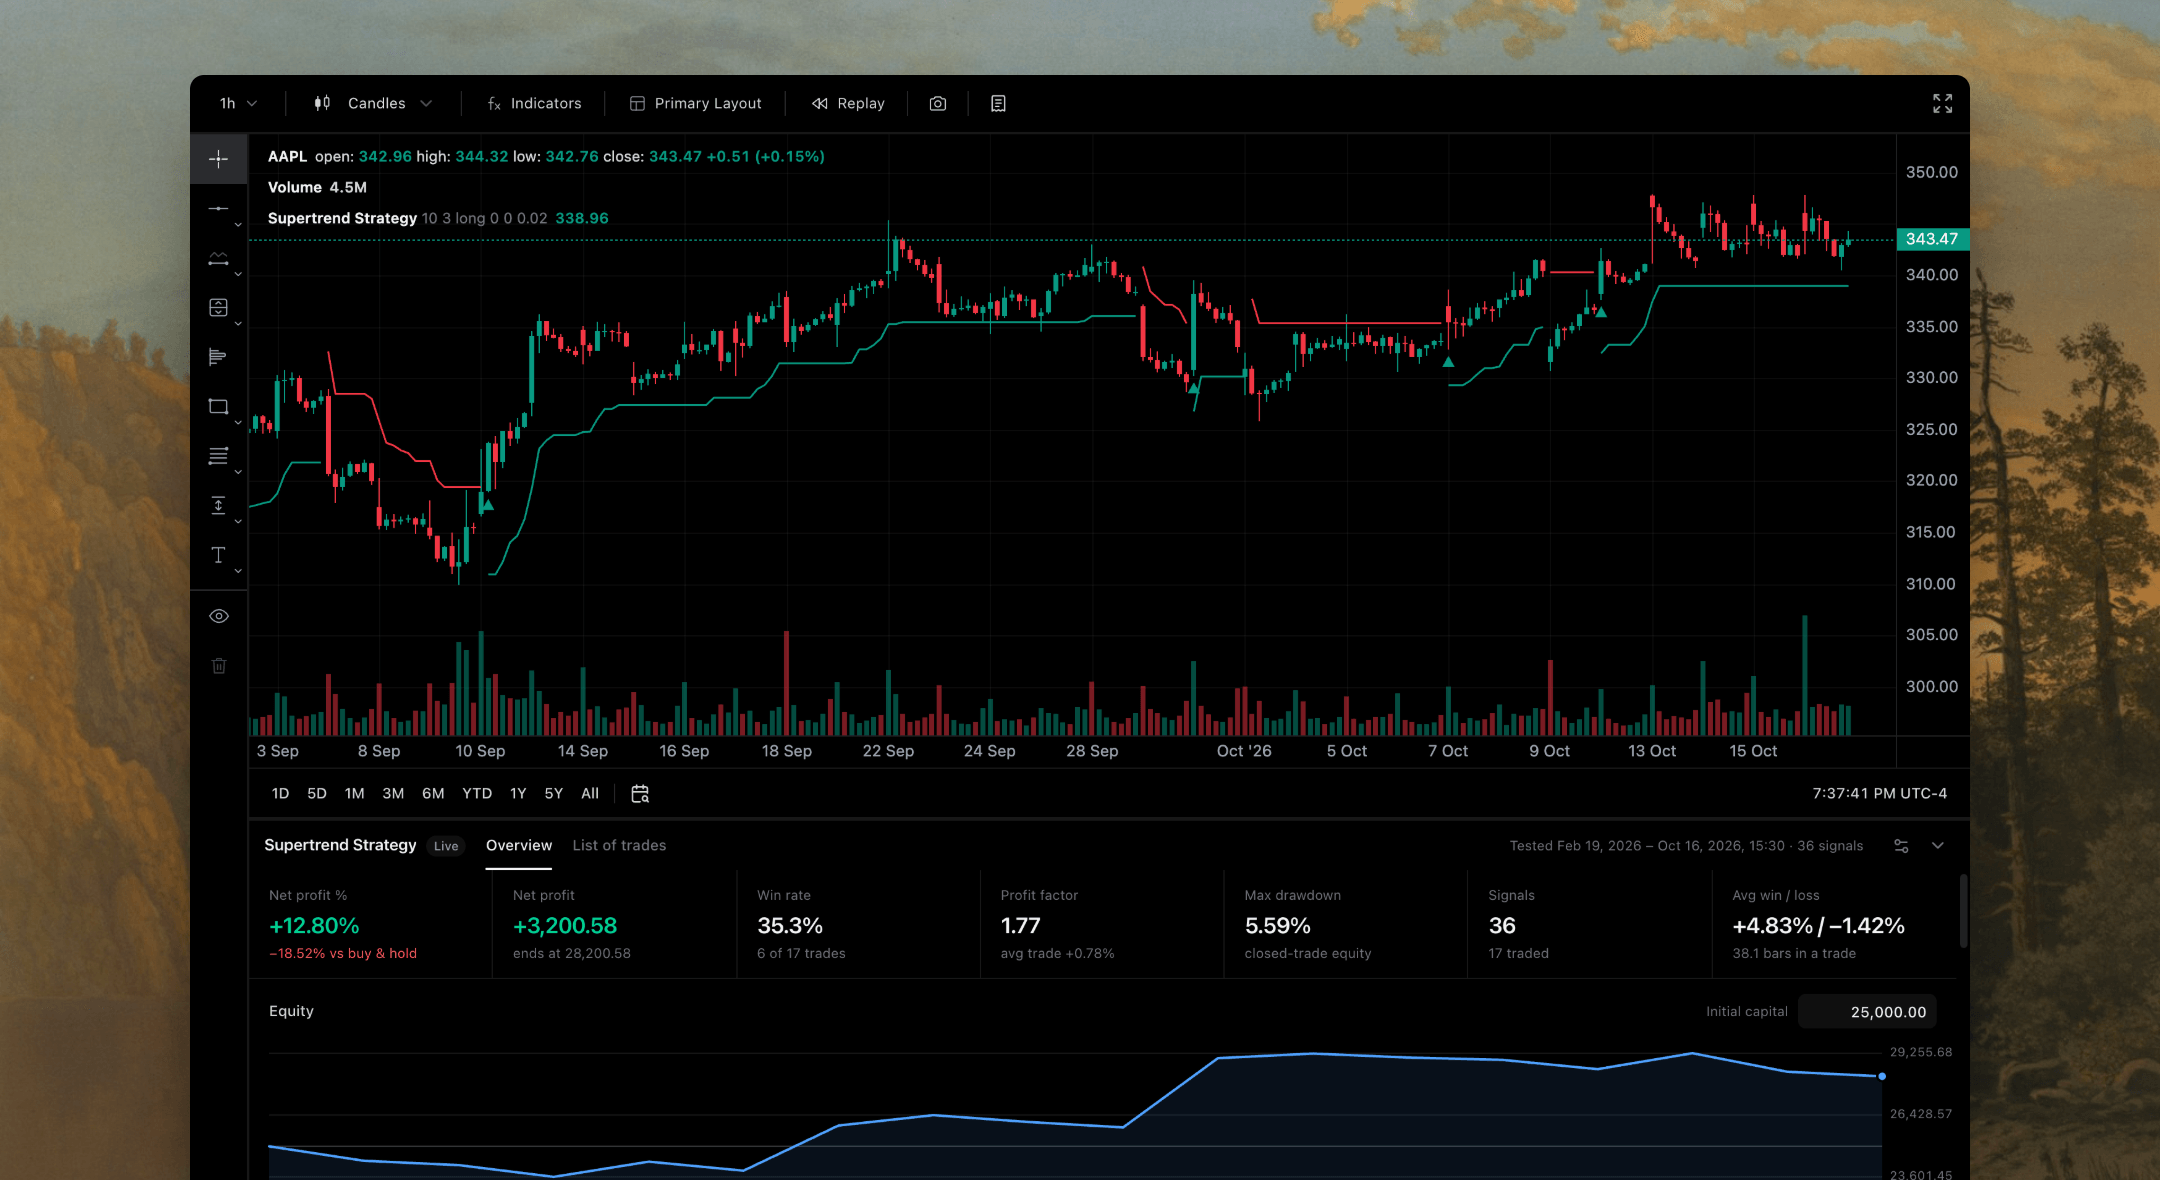
Net profit, win rate, profit factor, drawdown and the equity curve, from 37 built-in strategies or your own.
No look-ahead
Signals use closed bars only, and higher timeframe inputs only see bars that had closed by then.
Realistic fills
Orders fill at the next open, with commission, stop loss, take profit and trailing stops.
Every trade
Each entry and exit listed with its price, size and profit.
Distribution and streaks
How wins and losses spread, the longest runs of each, and when trades tend to work.
Risk-adjusted
Sharpe and Sortino ratios beside the raw return, so two strategies compare fairly.
59 drawing tools
Trend lines, channels, Fibonacci, Gann, pitchforks, Elliott waves, patterns and measurements.
Saved and synced
Drawings save per symbol and stay in sync across every chart of a layout.
Hotkeys
H and R for a line or ray at the crosshair, B for a rectangle, A for an alert, N for a note.
Up to 16 charts
Twelve arrangements, from two panels to a sixteen-chart grid, resized to your workspace.
Own symbol and interval
Every panel keeps its own symbol and interval, including custom intervals.
Linked when you want
Drawings on the same symbol stay in sync across panels.
Rewind any chart
Pick a starting bar and replay the market bar by bar, as if it were live.
No hindsight
Indicators and strategies only ever see the bars revealed so far.
Your pace
Step one bar at a time or play at the speed you choose.
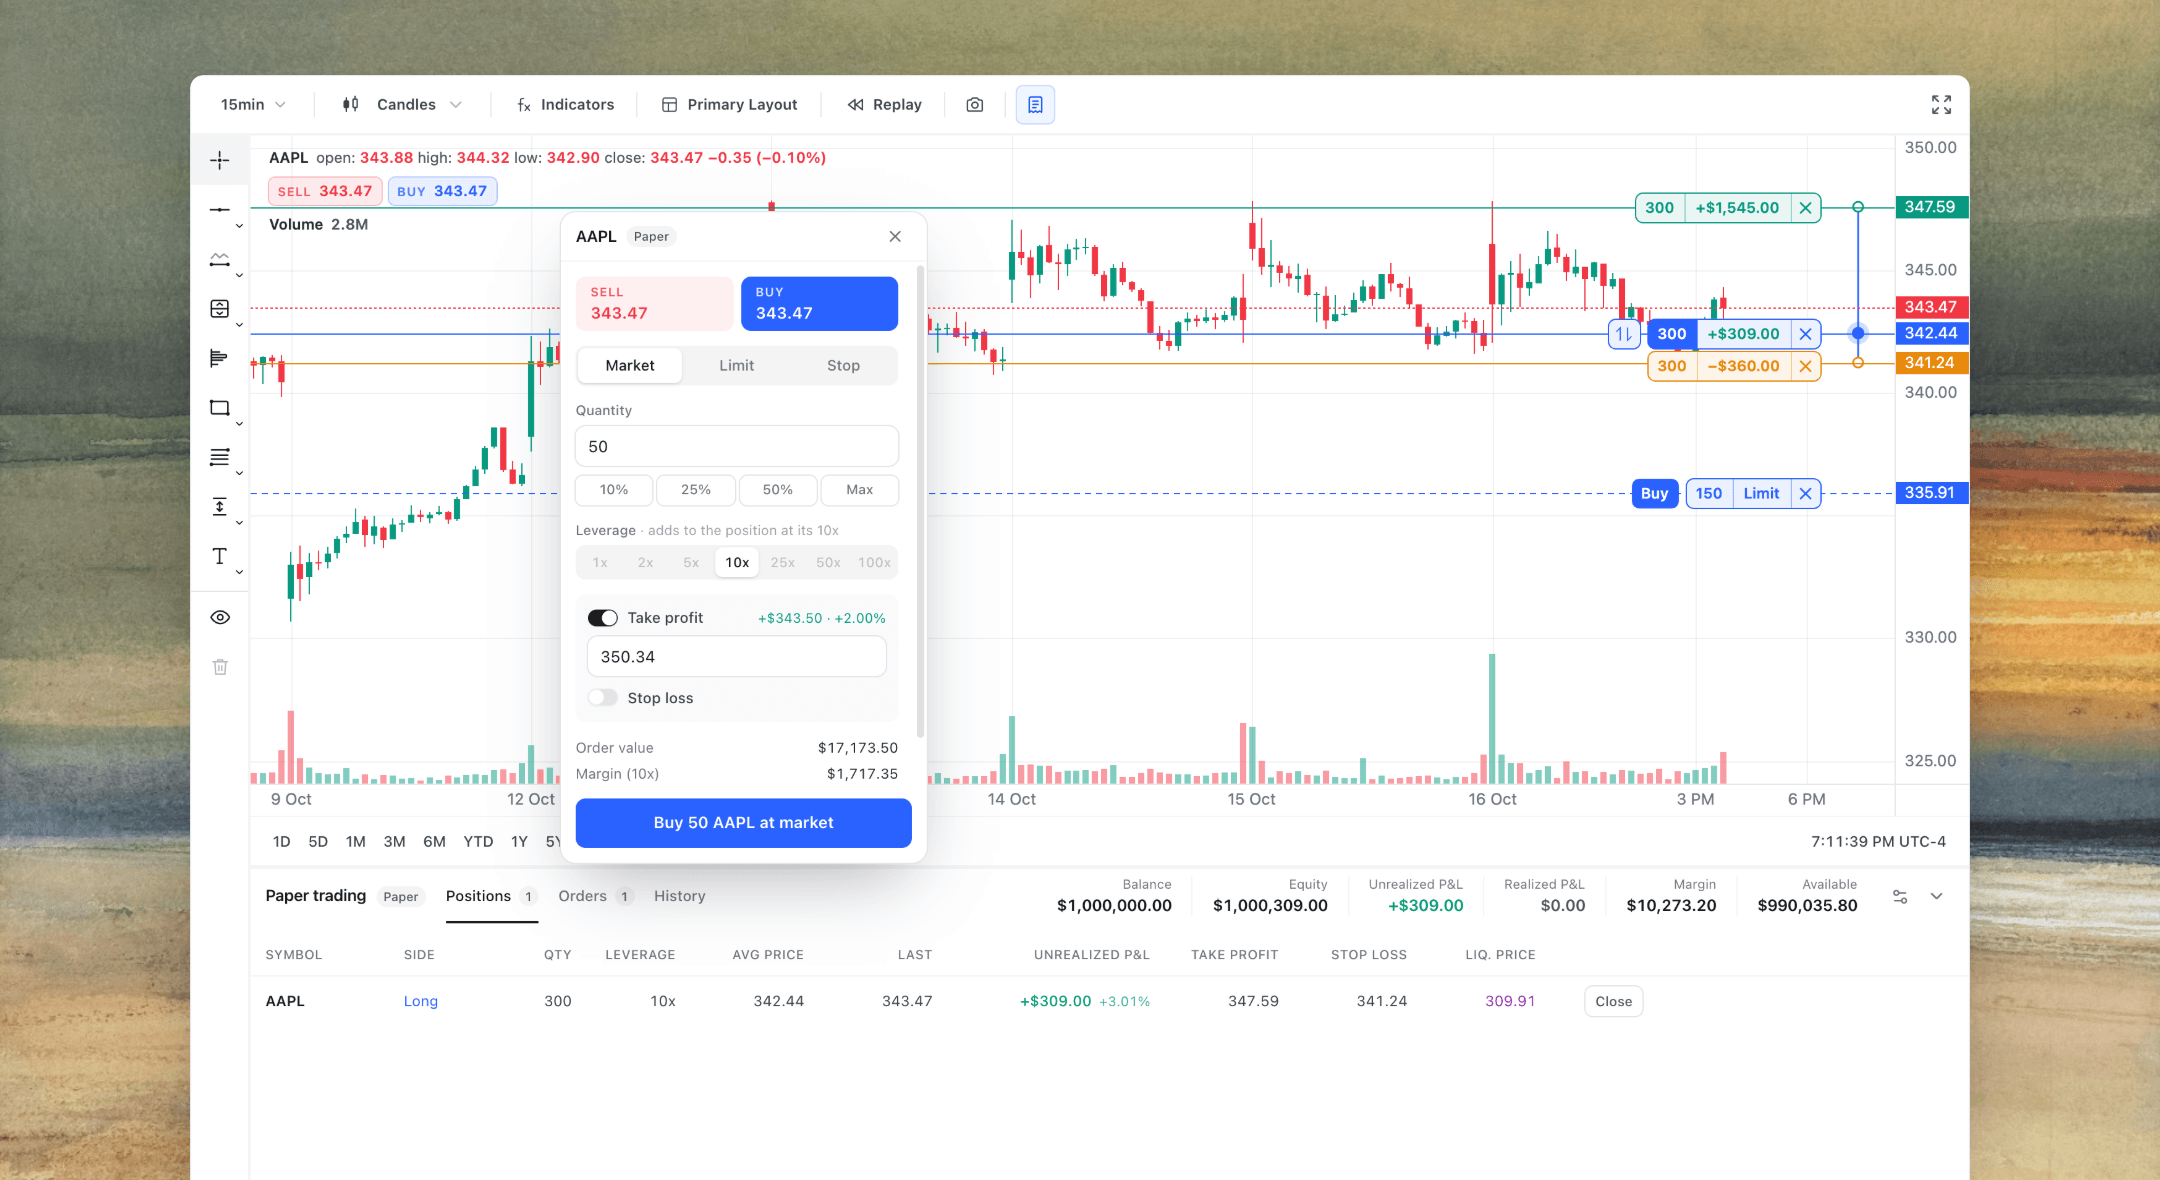
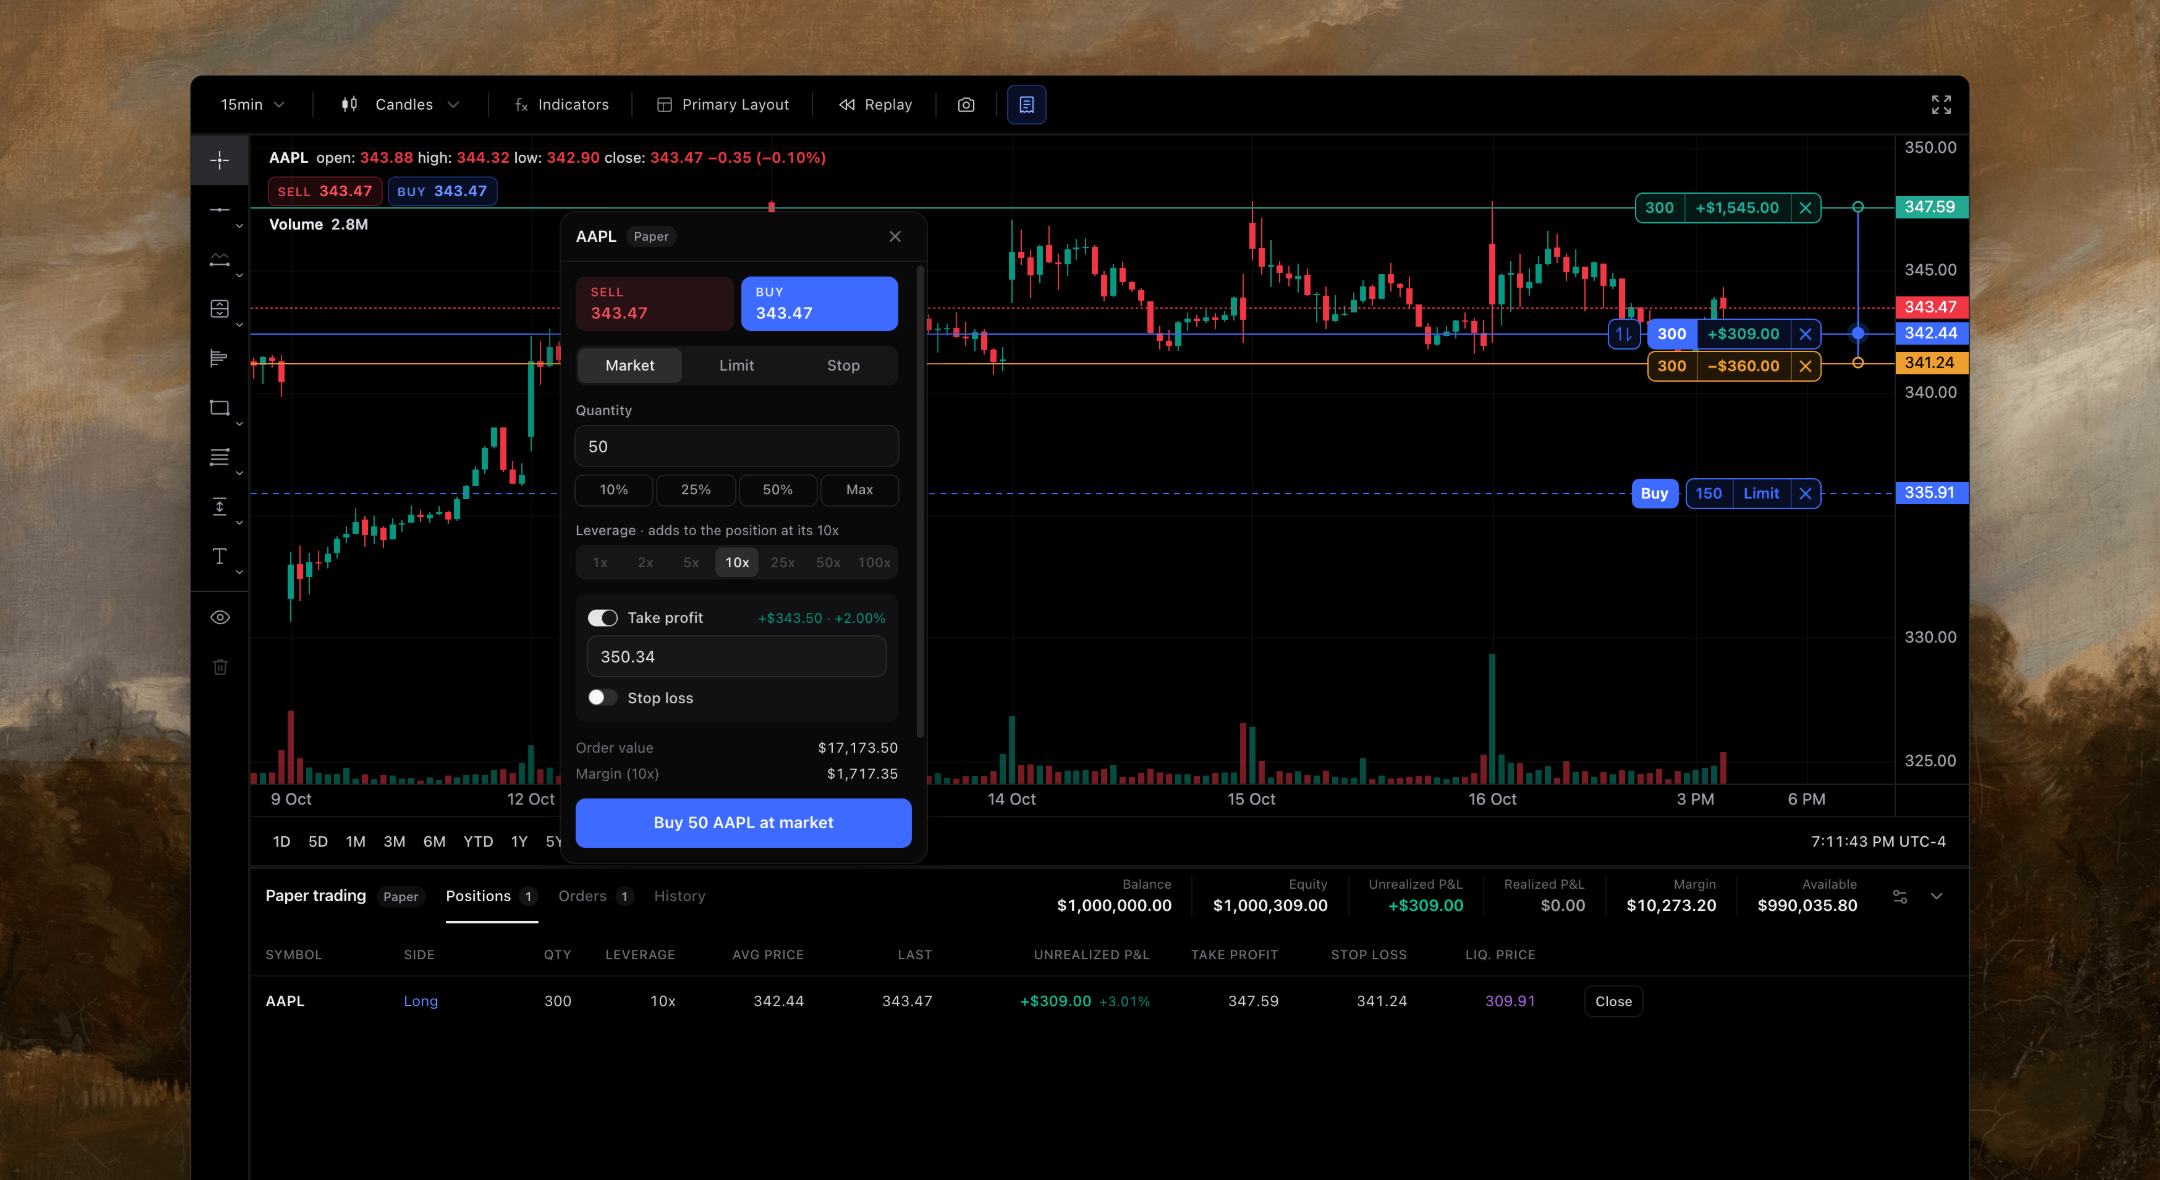
Practice with no risk
Market, limit and stop orders against a paper account, with leverage when you want it.
Stops and targets
Take profit and stop loss on every order, drawn on the chart with their P&L.
Positions and history
Positions, orders and history, with balance, equity and realized and unrealized P&L.
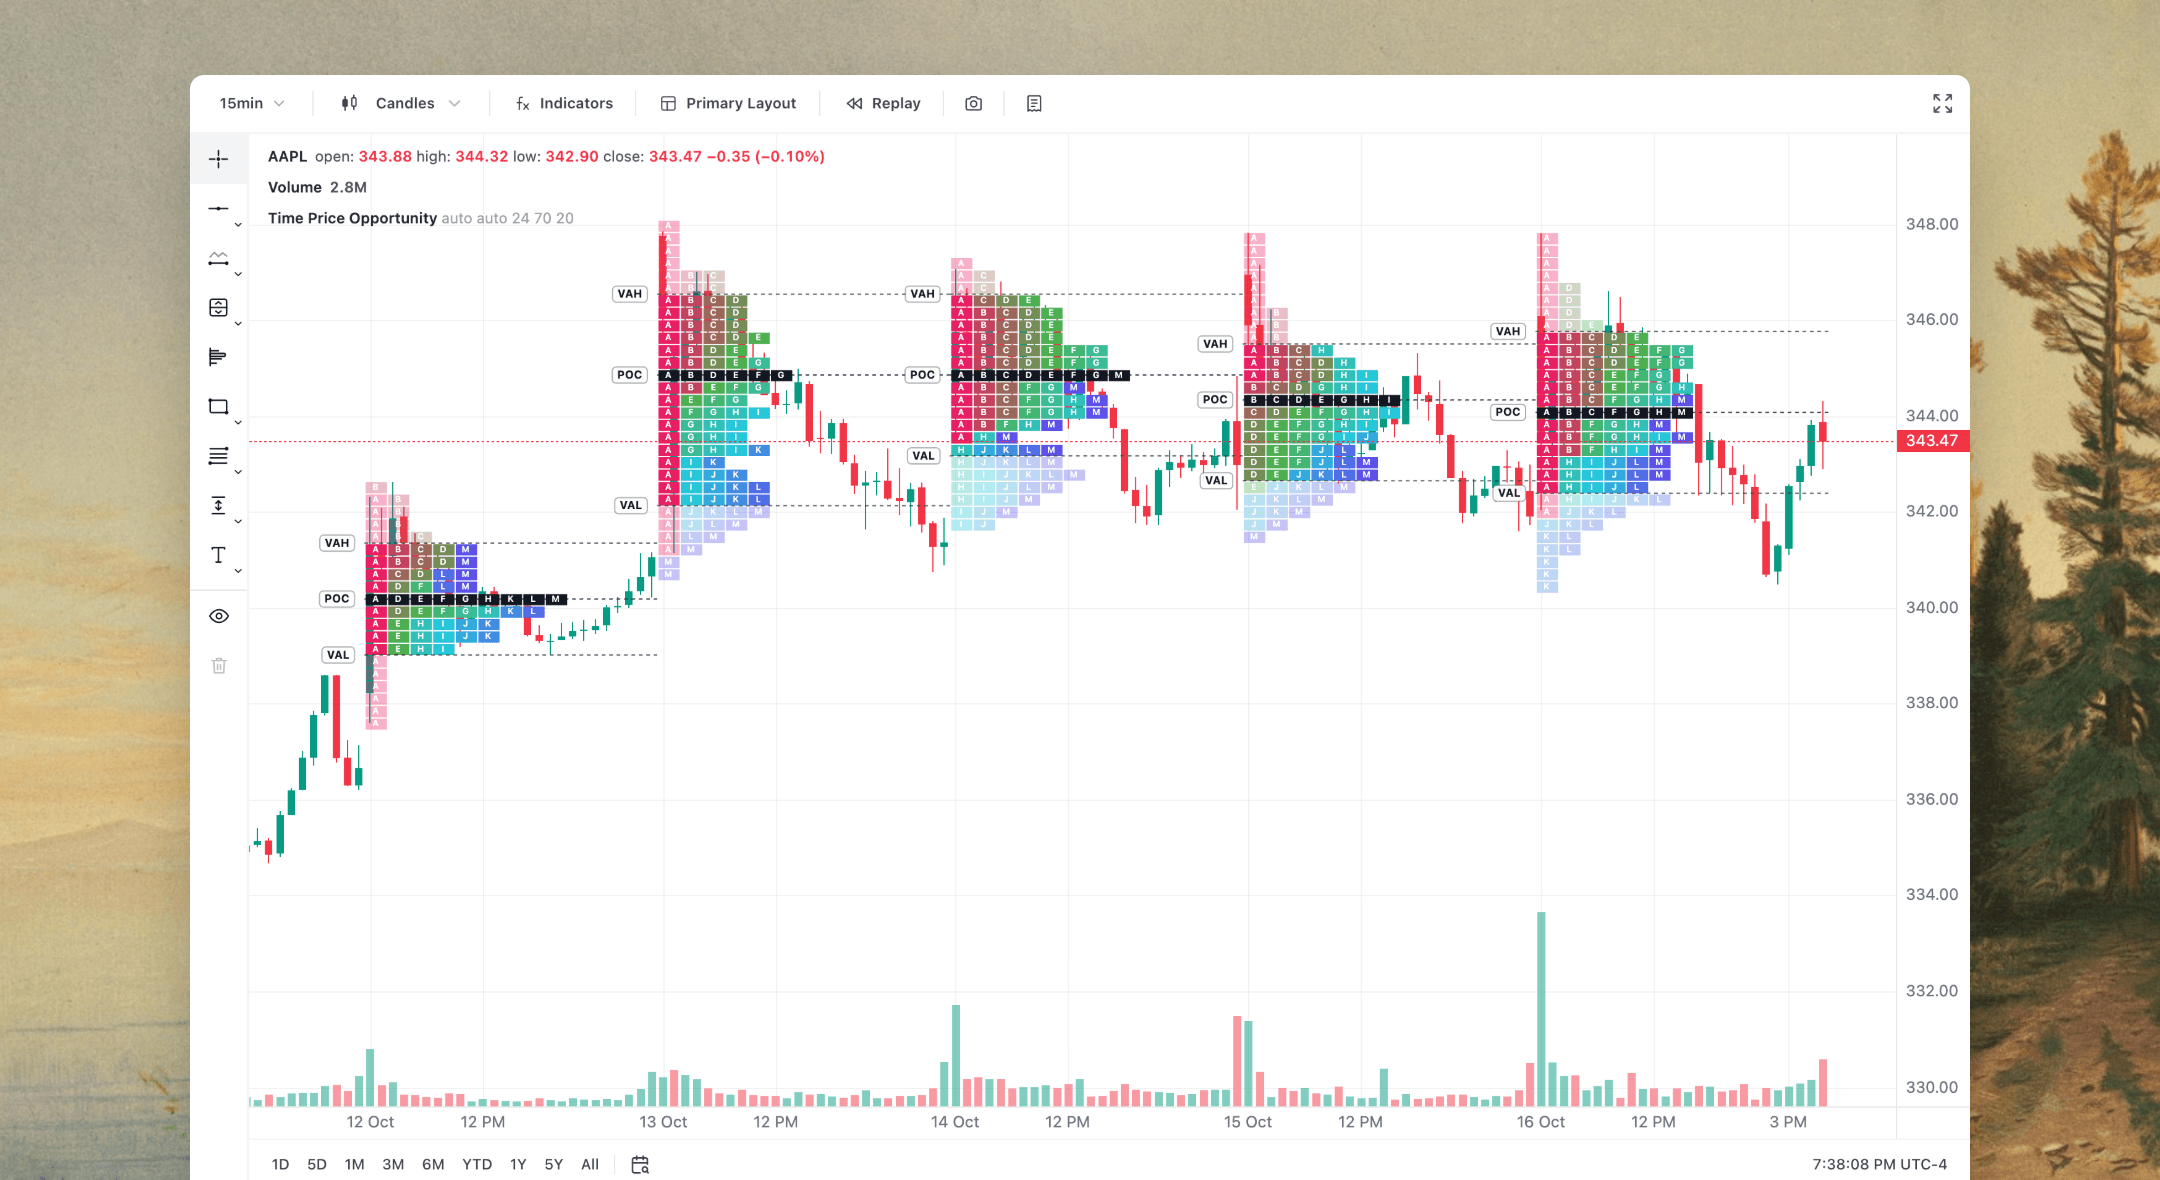
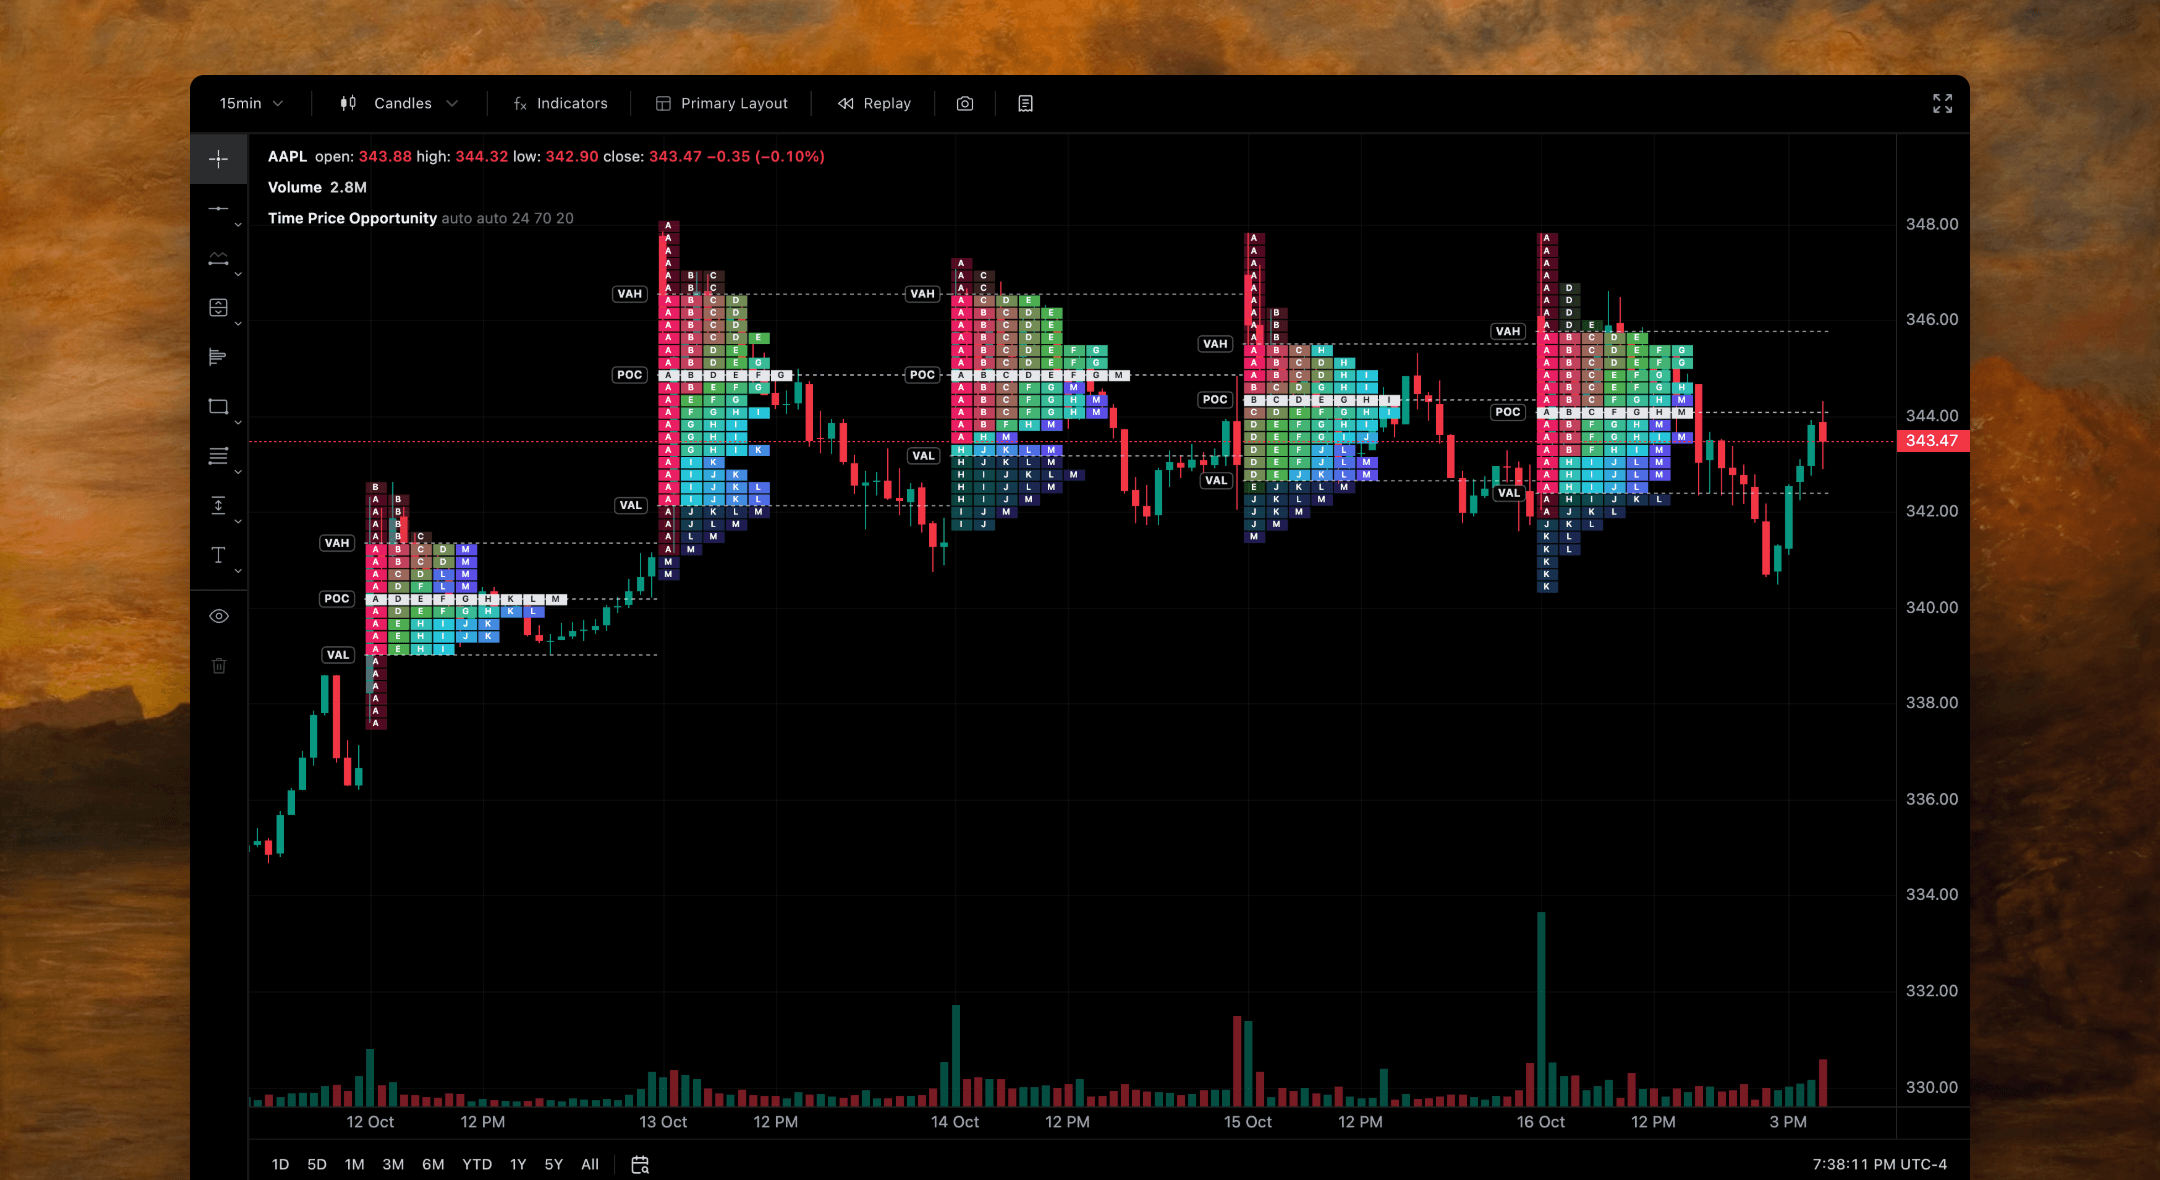
Time at each price
Each session as letters by price, showing where the market spent its time.
Value area and POC
The point of control and value area marked for every period.
Any period
Profiles per session or over the period you choose.
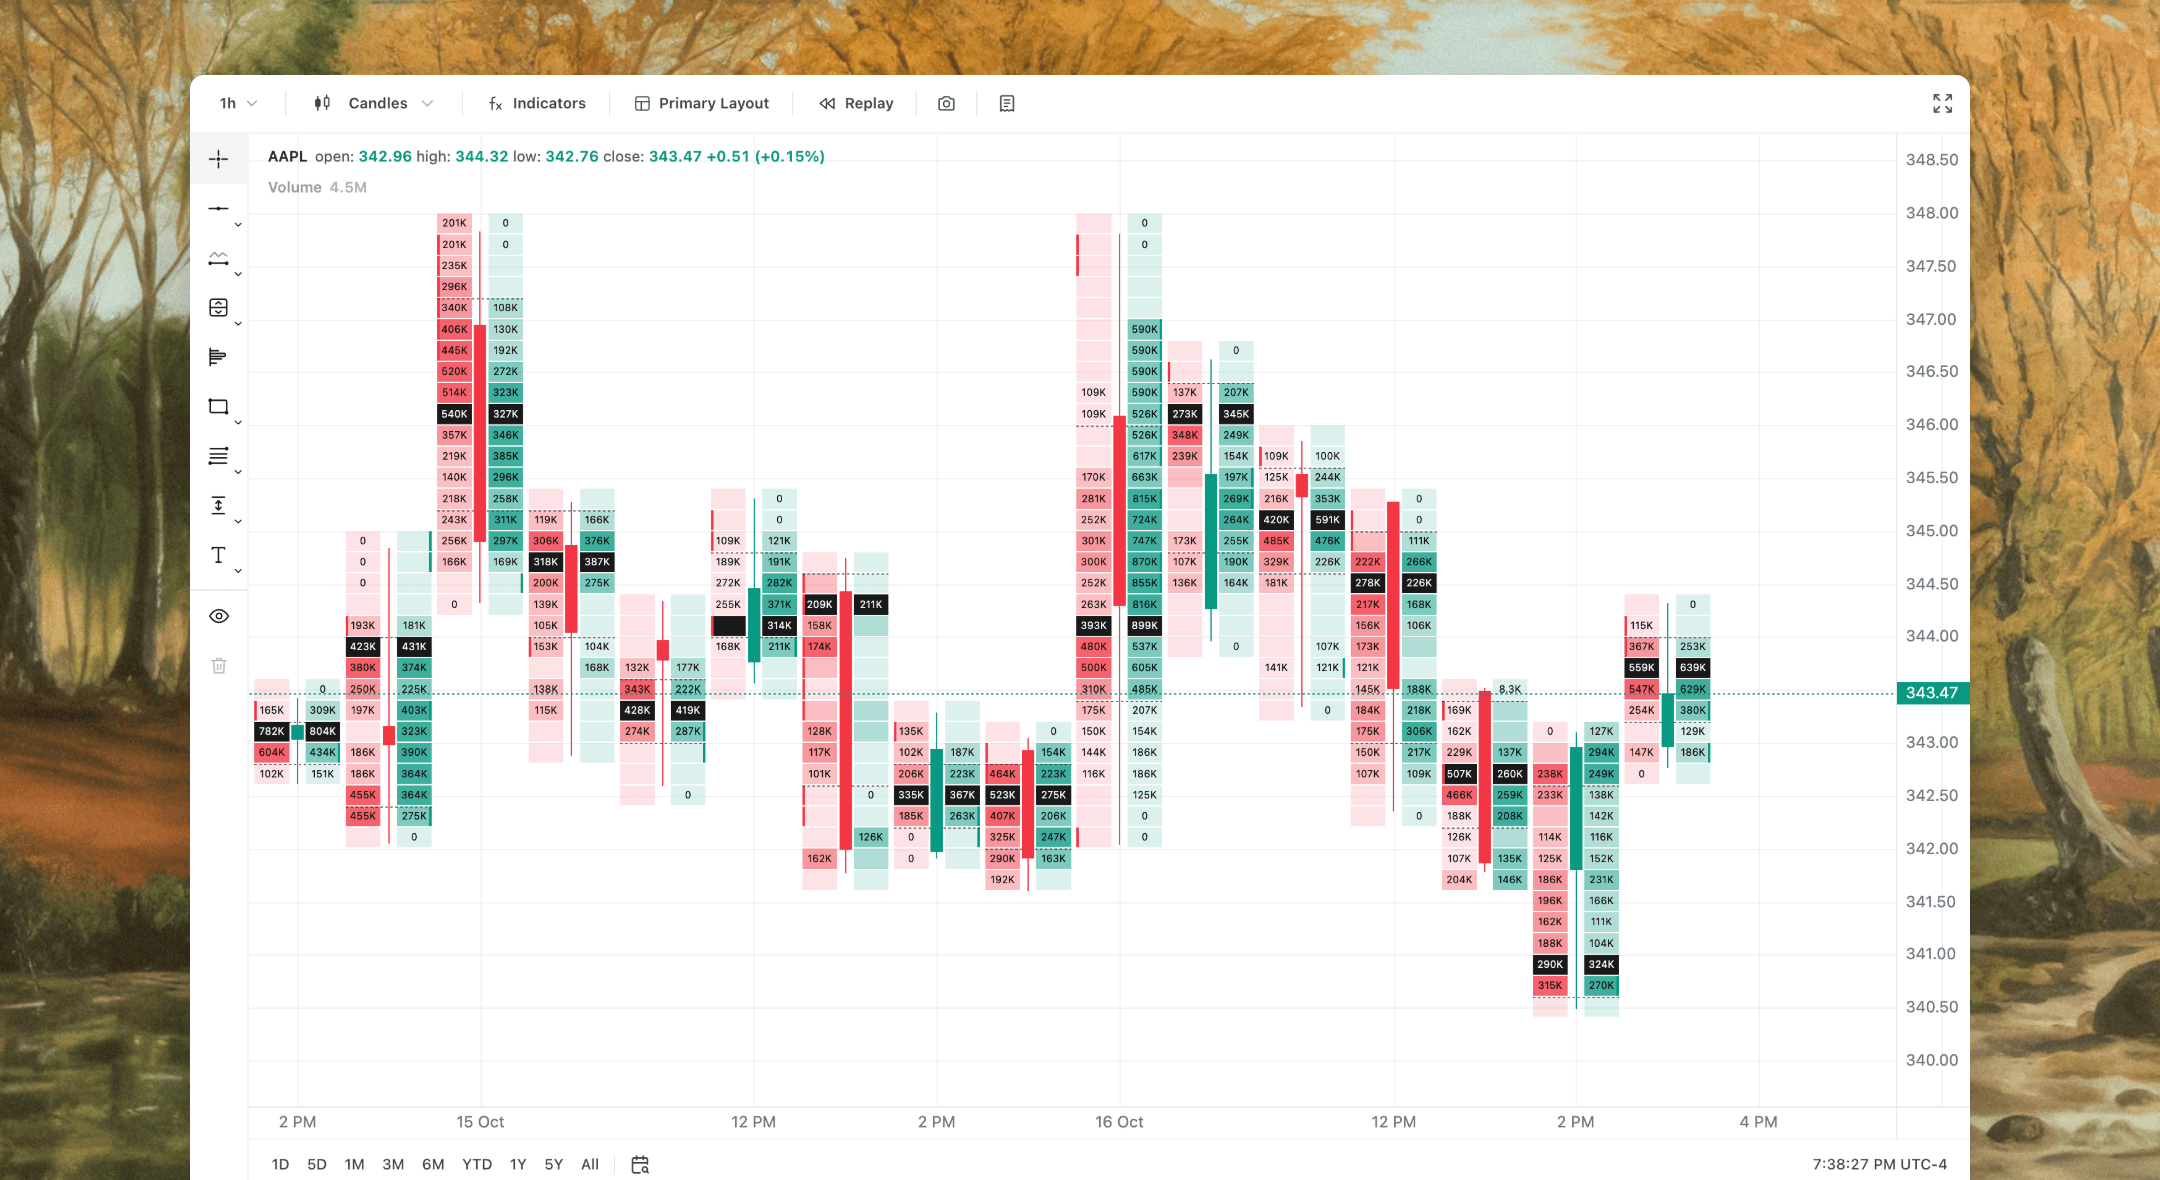
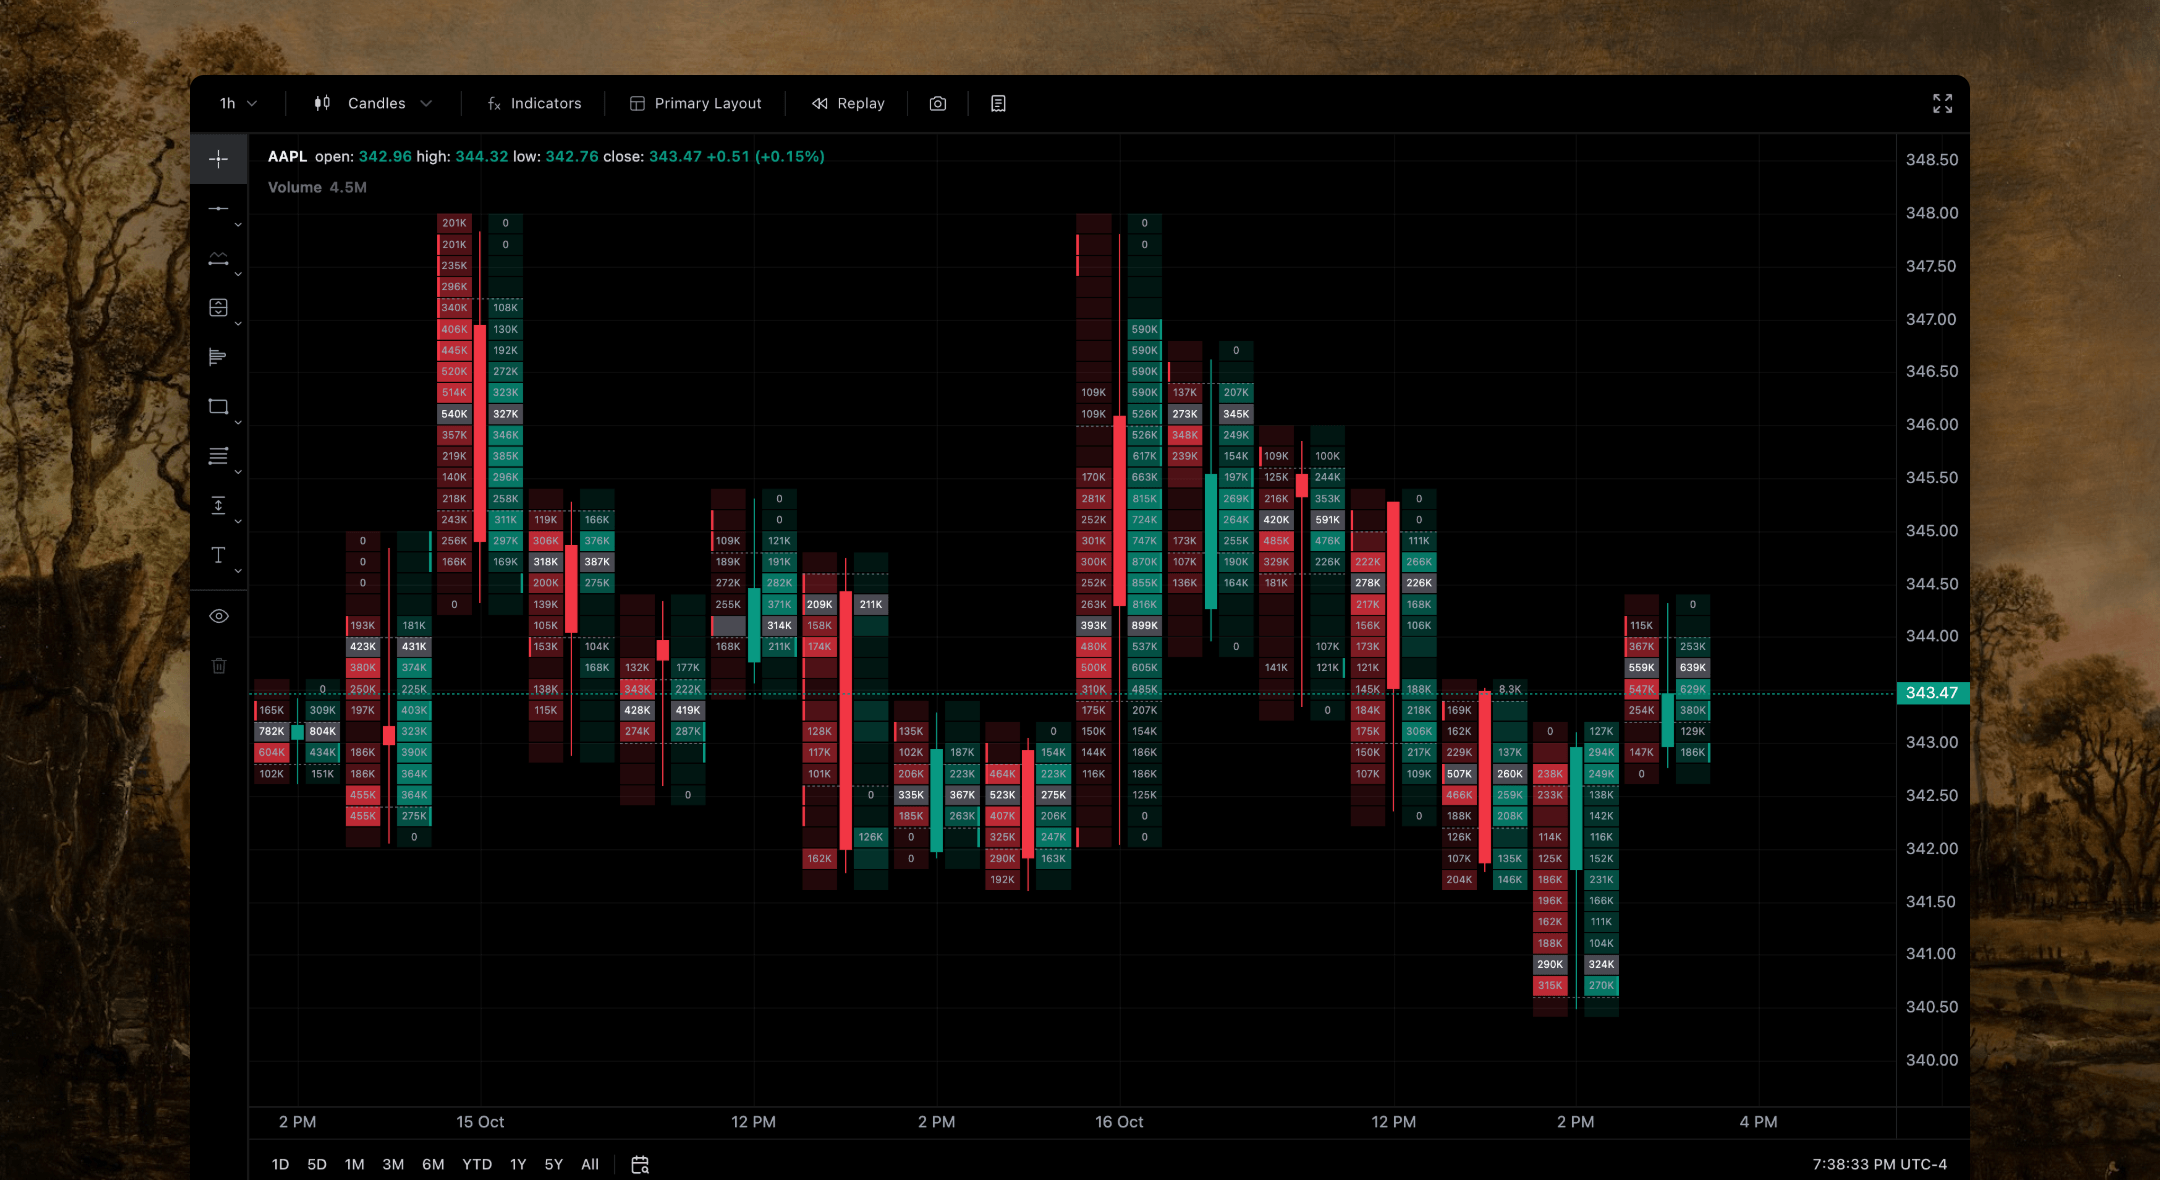
Inside each bar
Volume by price within every bar, built from lower timeframe bars.
Point of control
The busiest price of each bar marked, so absorption stands out.
With everything else
Runs alongside your indicators, drawings and strategies on the same chart.
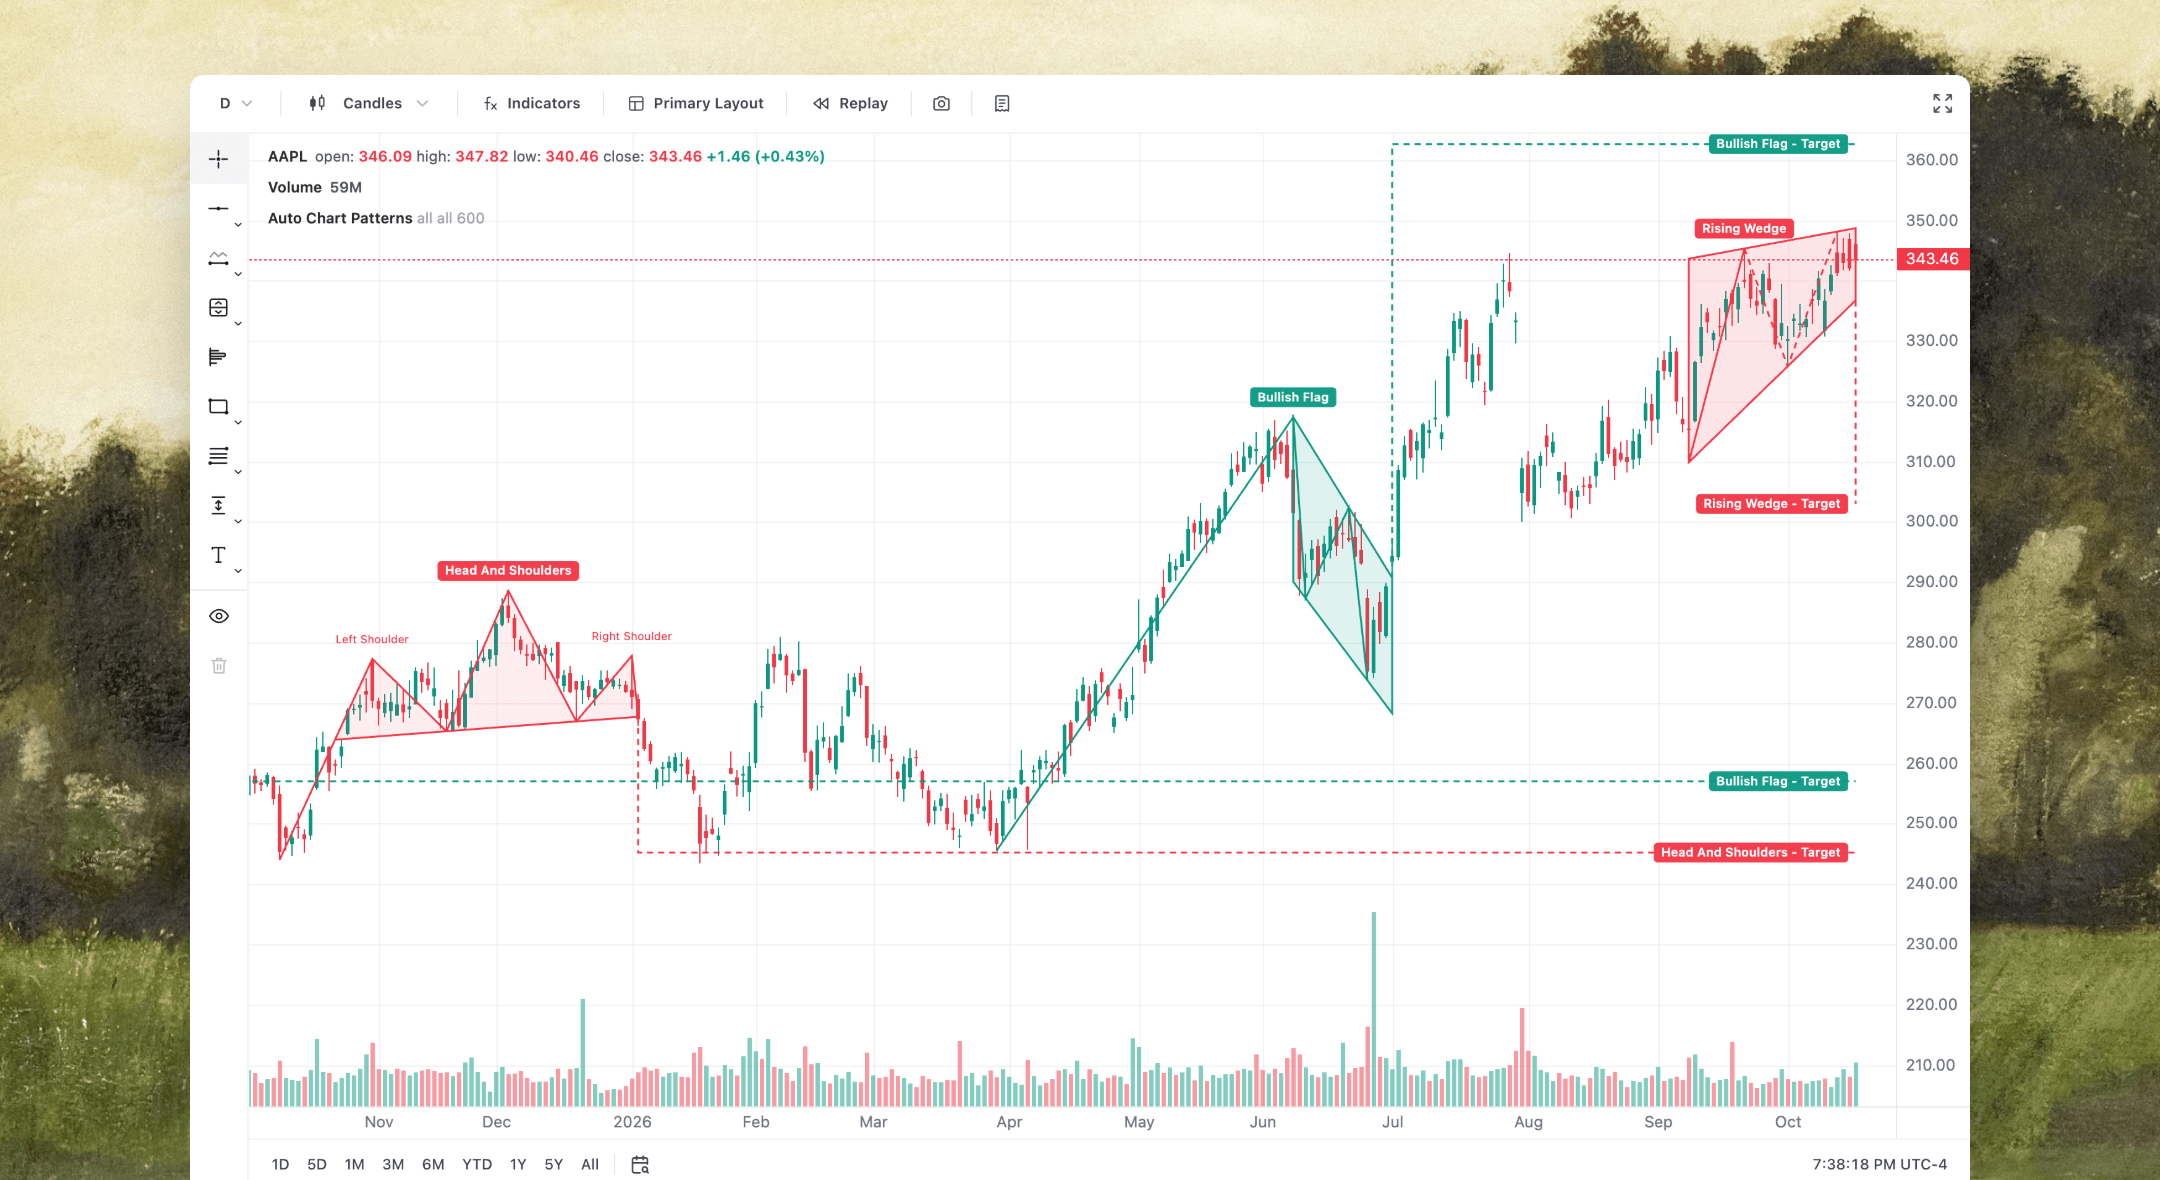
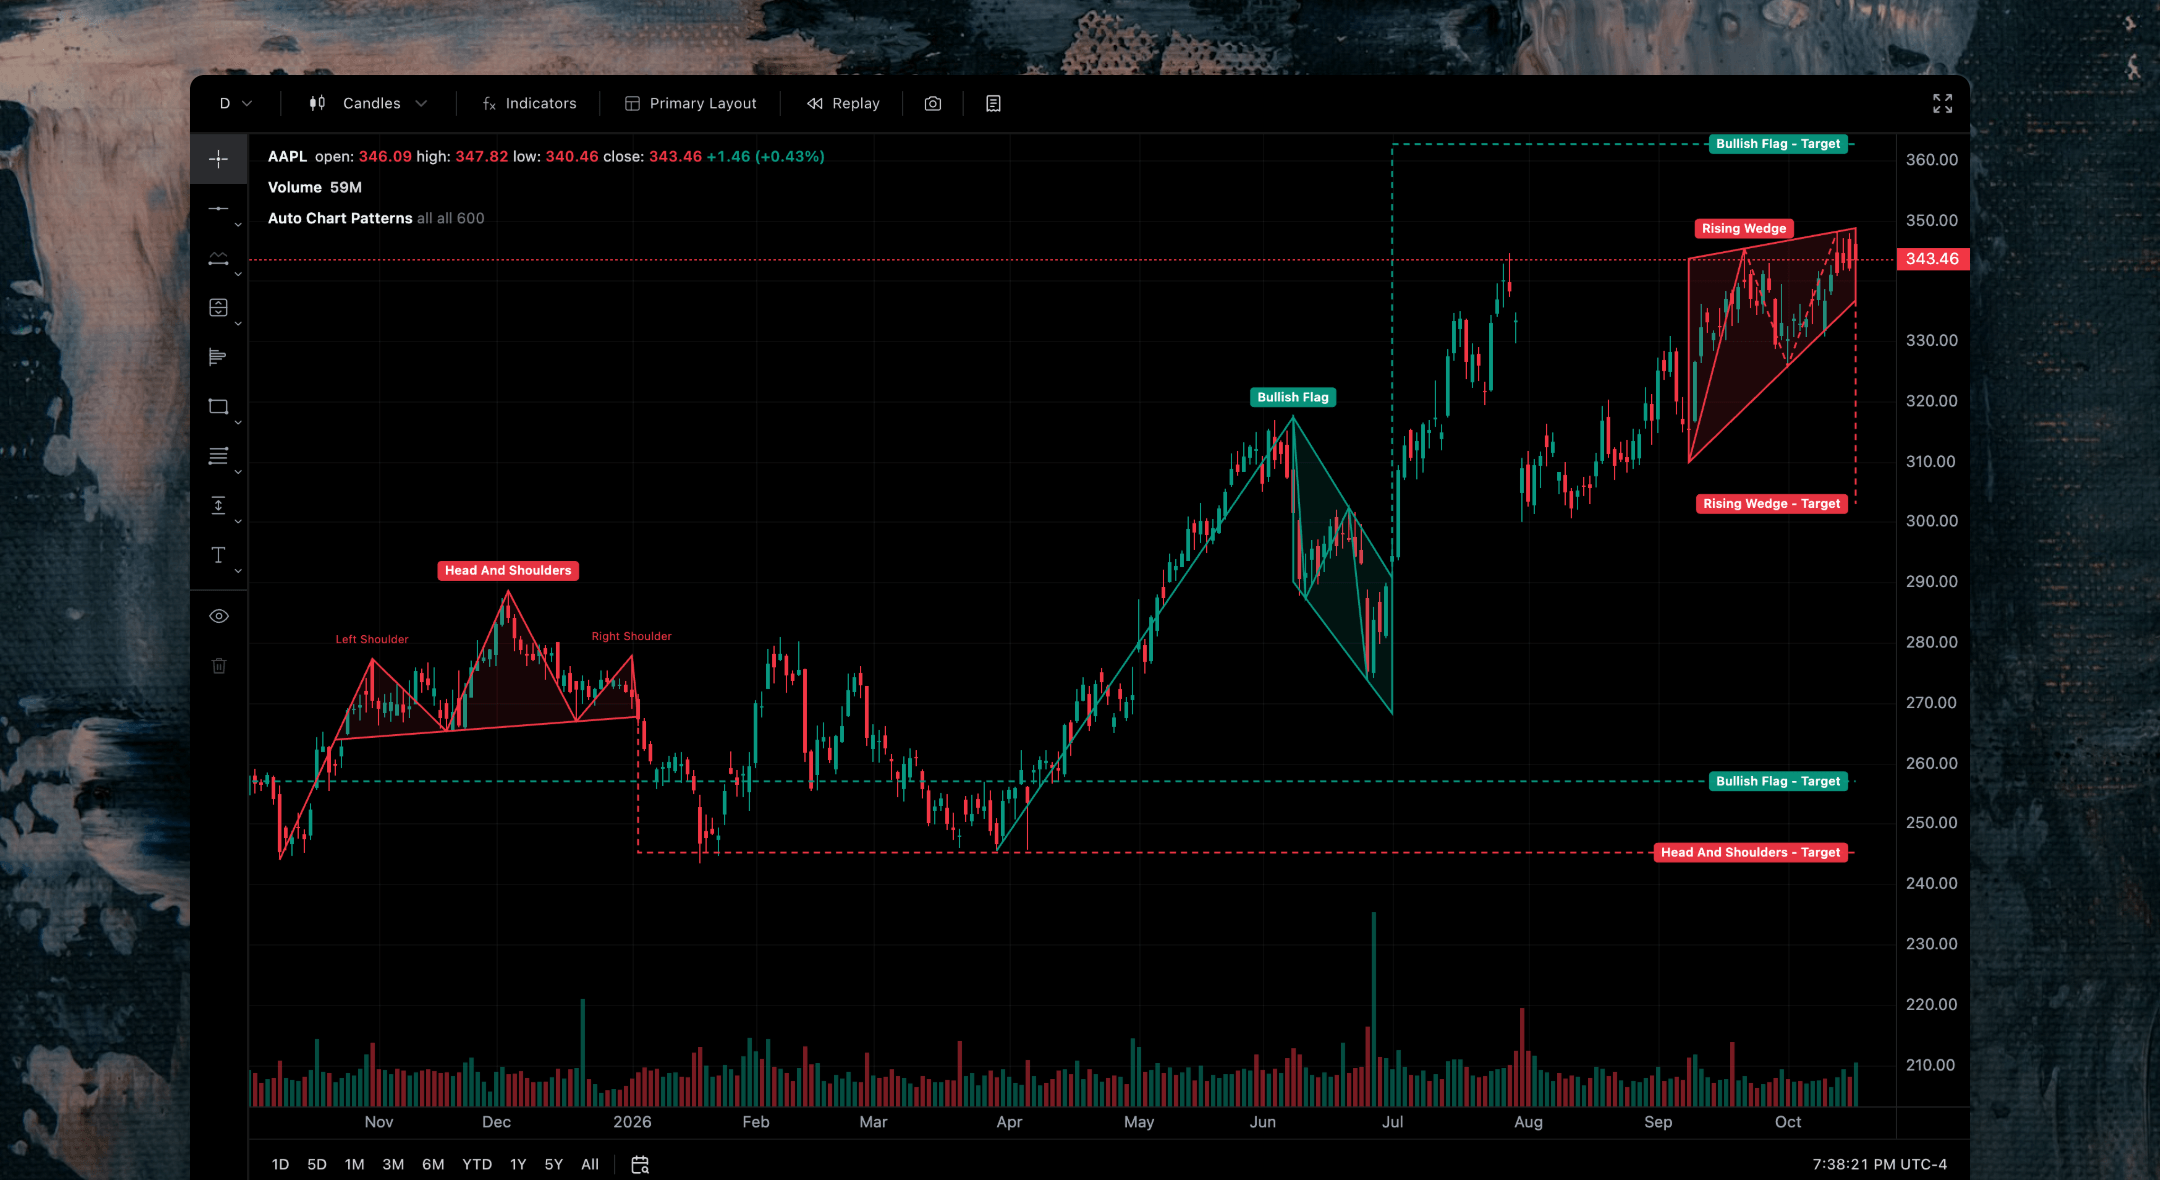
37 candlestick patterns
Engulfing, doji, hammer, morning and evening star and more, marked as they form.
16 chart patterns
Flags, pennants, wedges, triangles, double tops and bottoms, head and shoulders, cup and handle.
Stage and target
Each pattern shows whether it is forming, confirmed, at target or failed.
Advanced Alerts
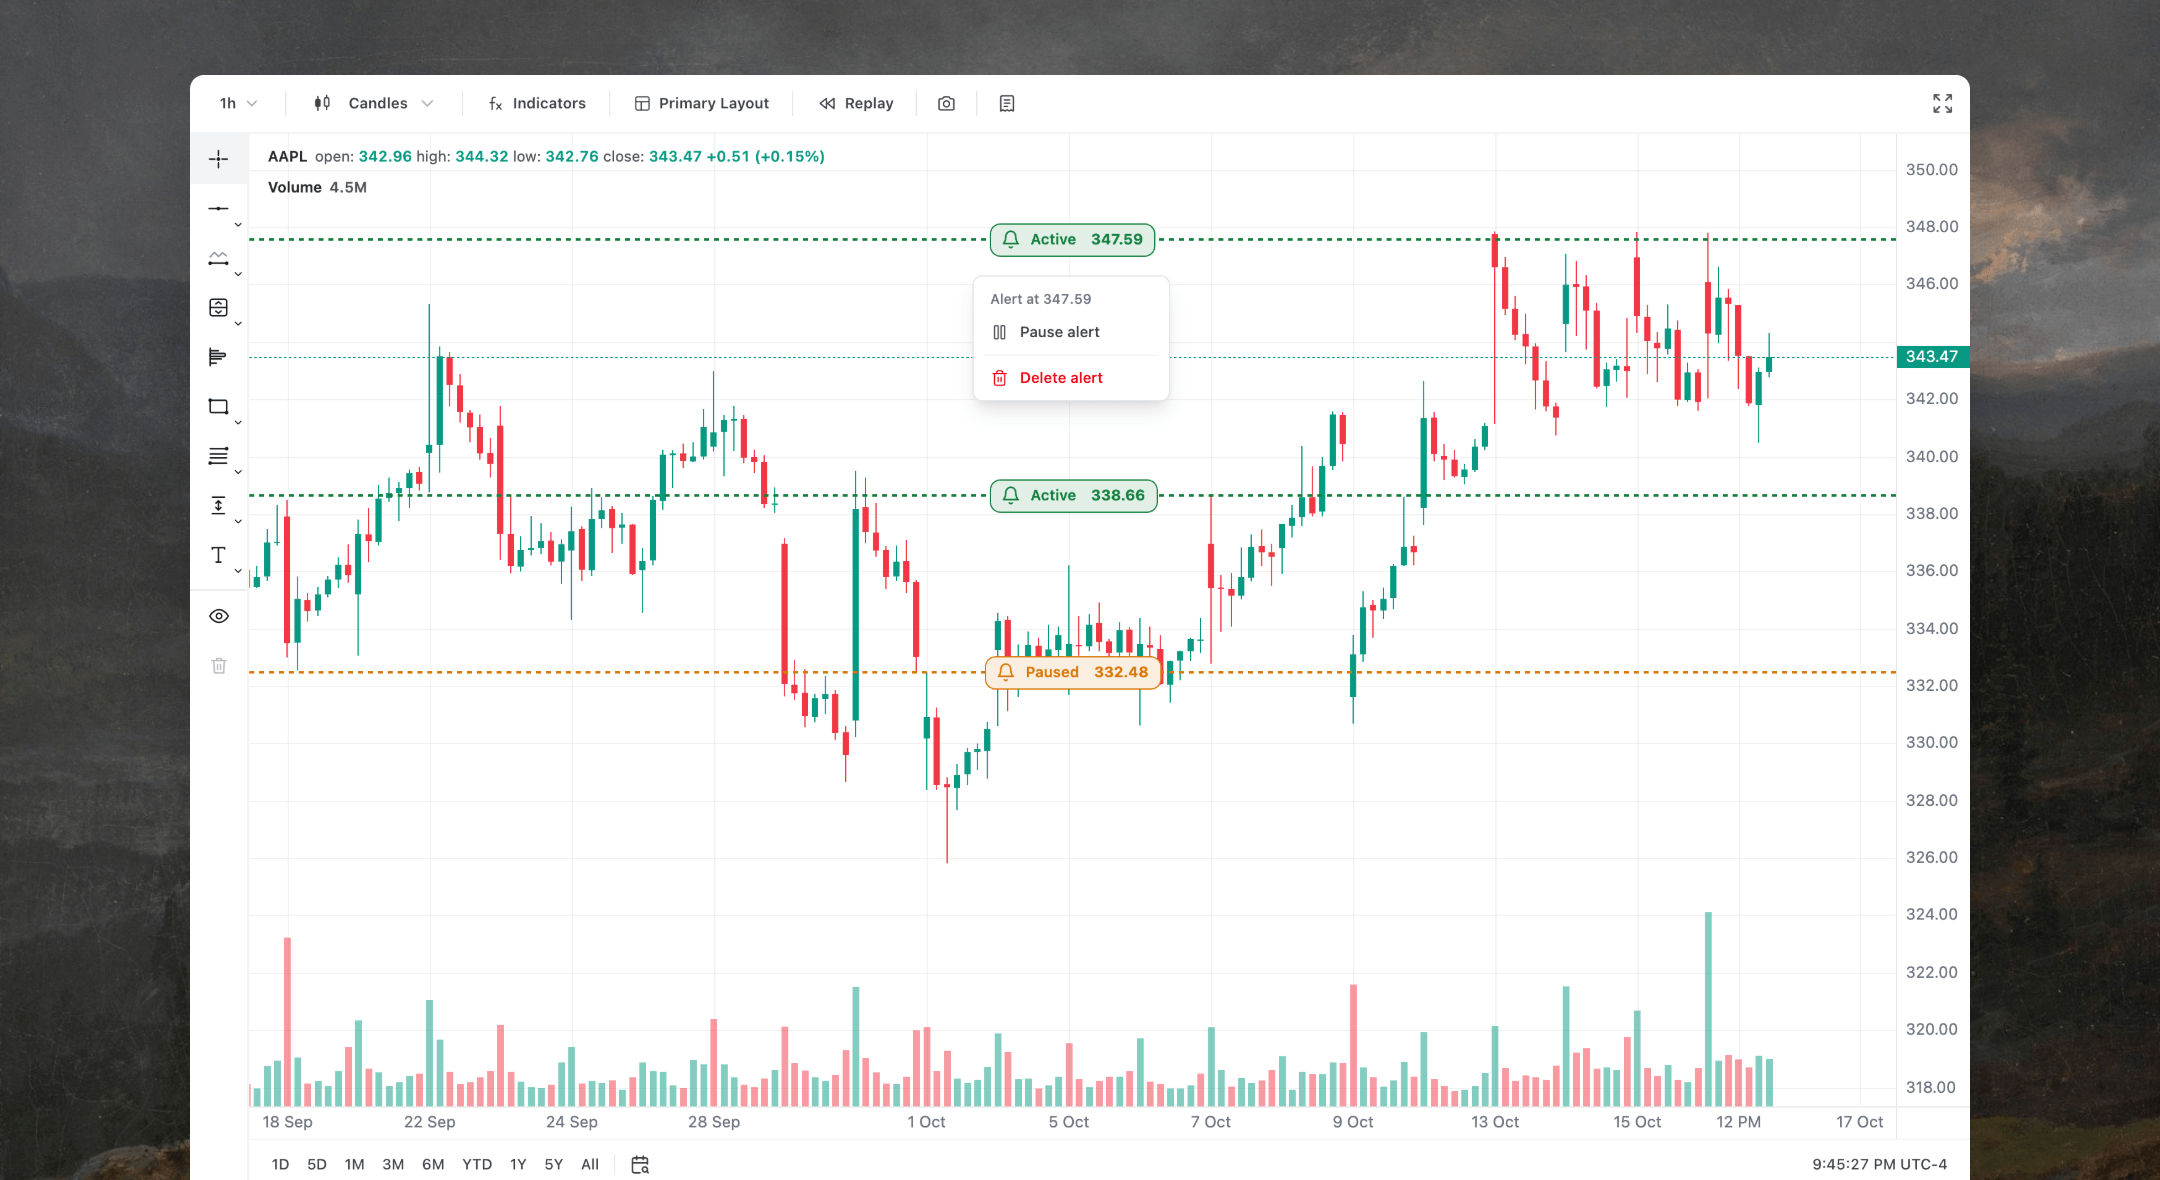
One alert for the whole setup.
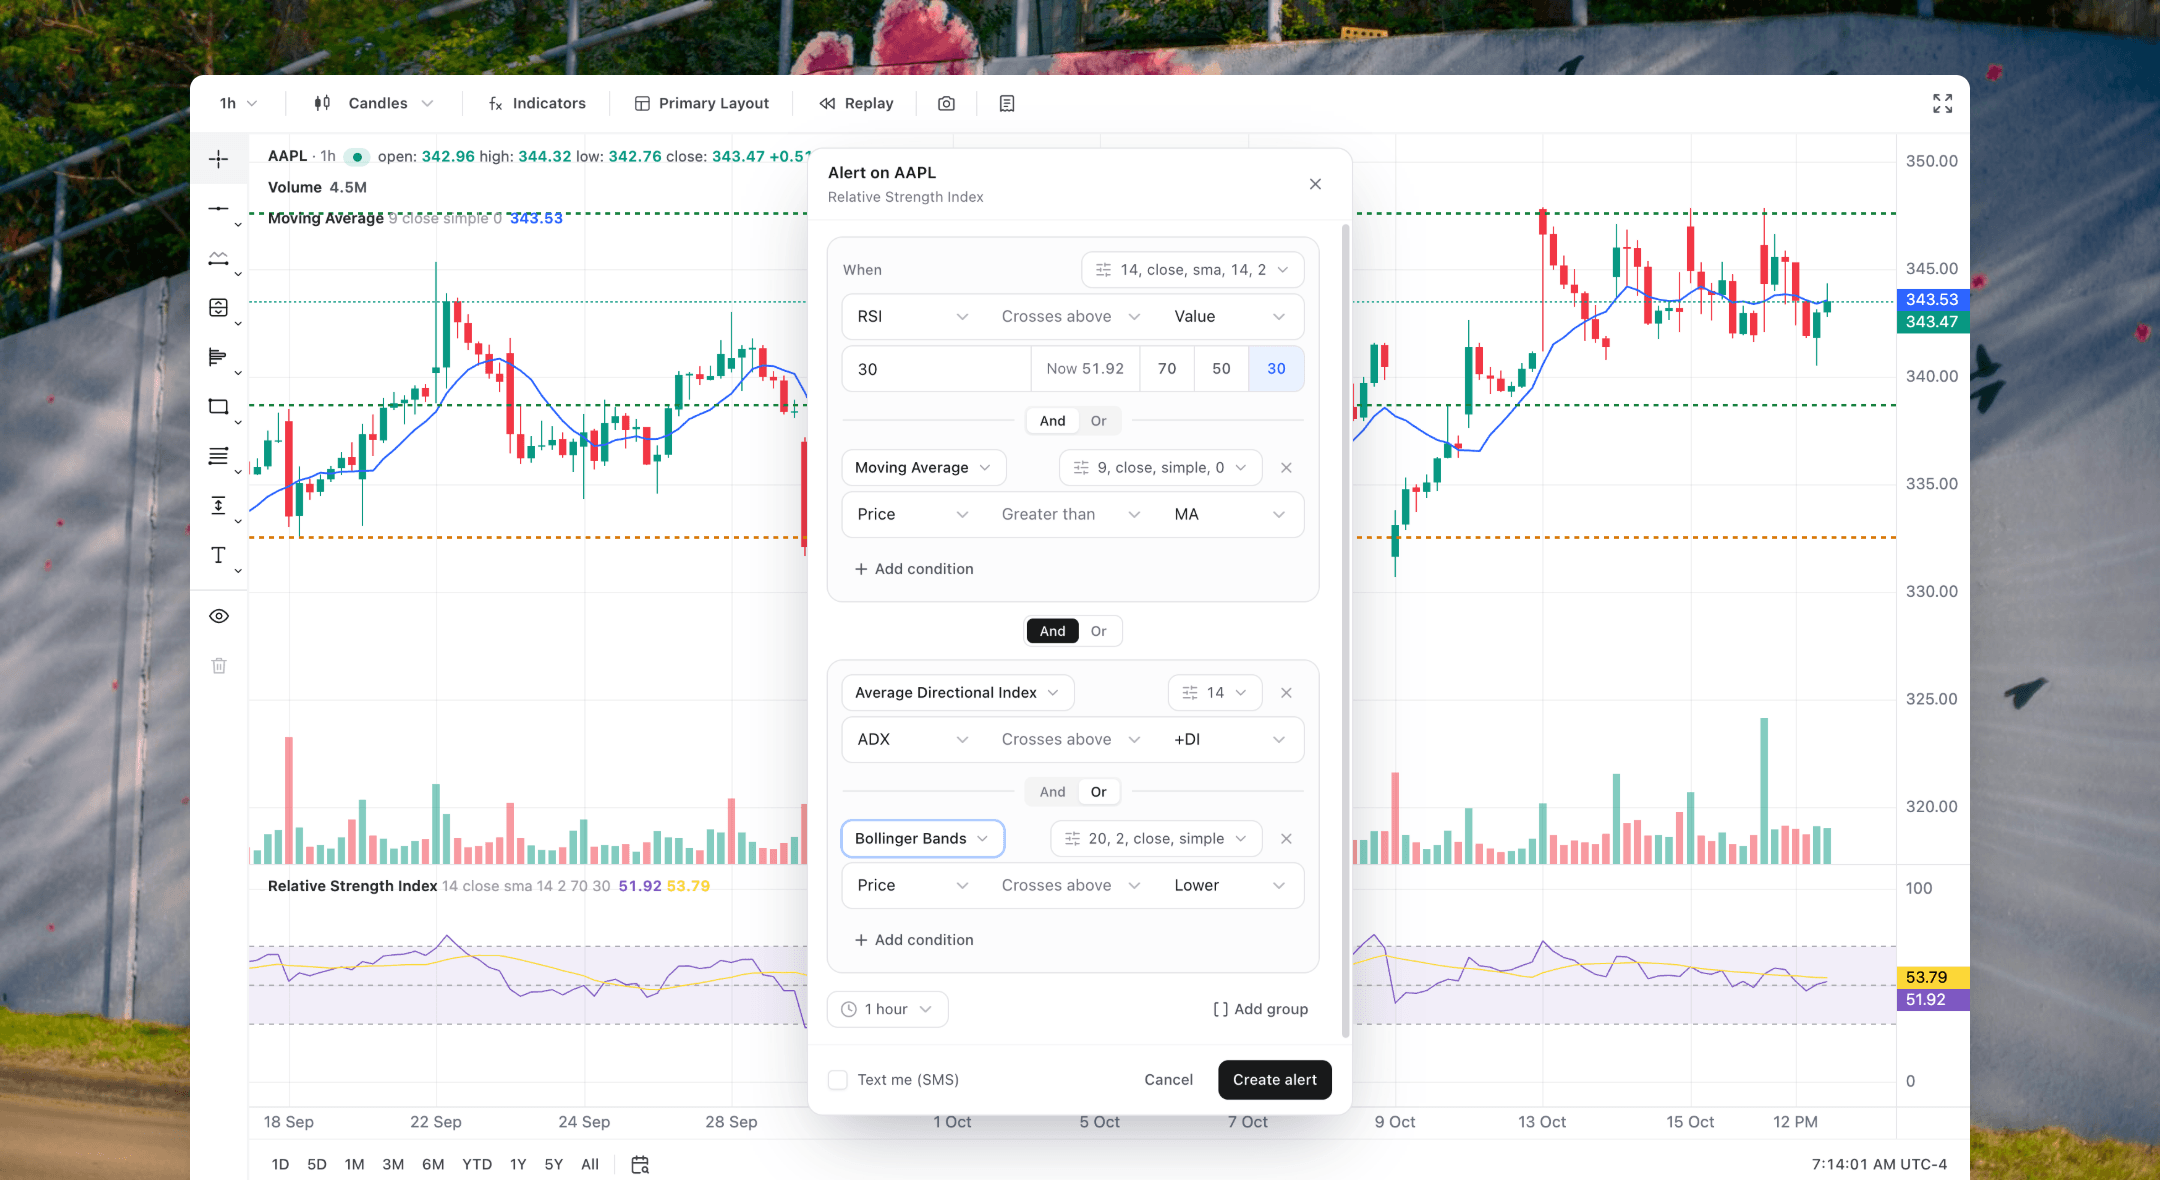
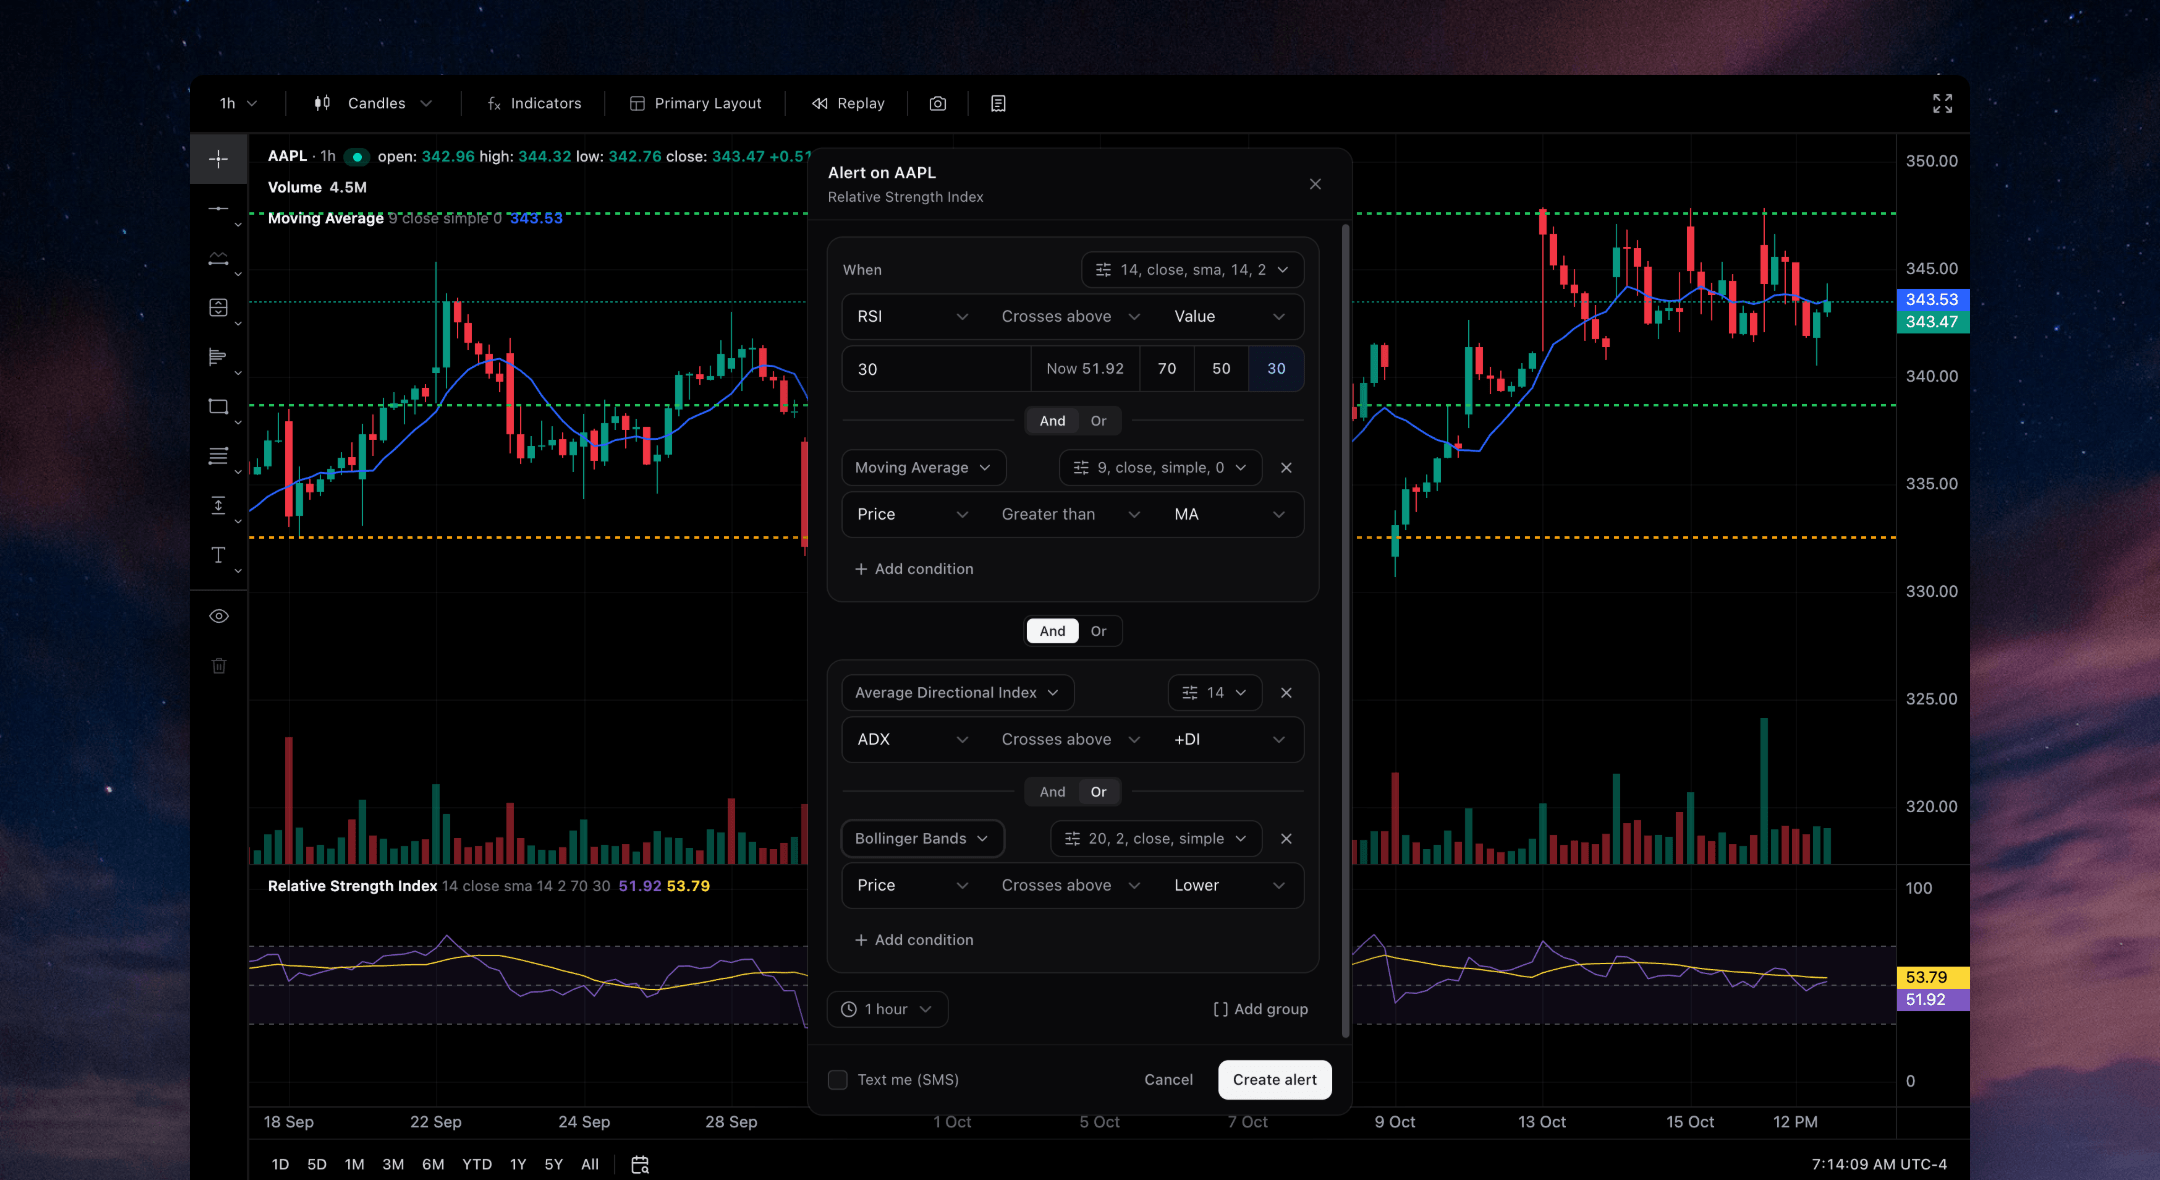
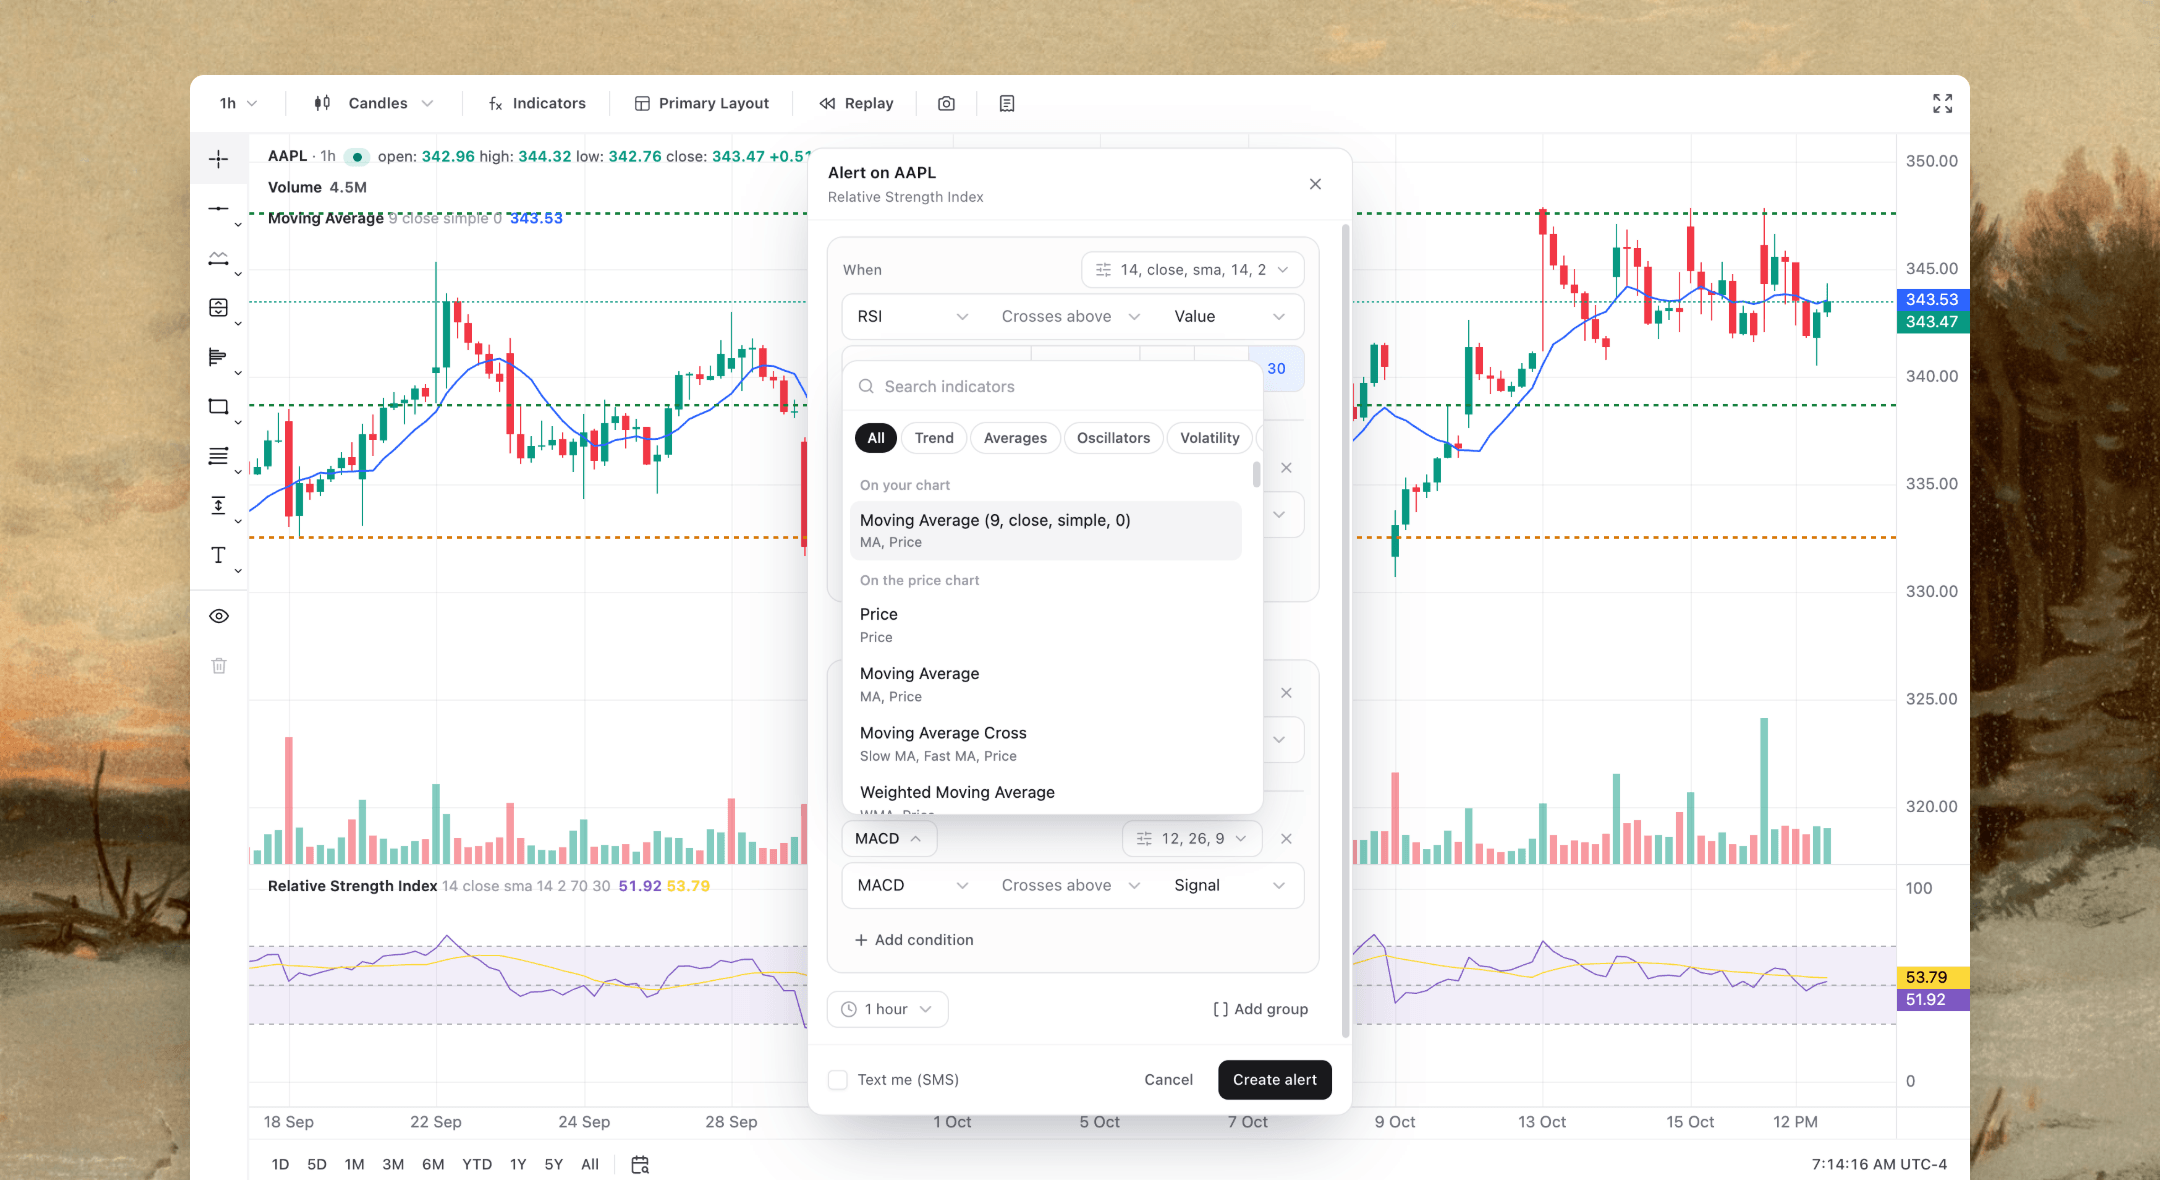
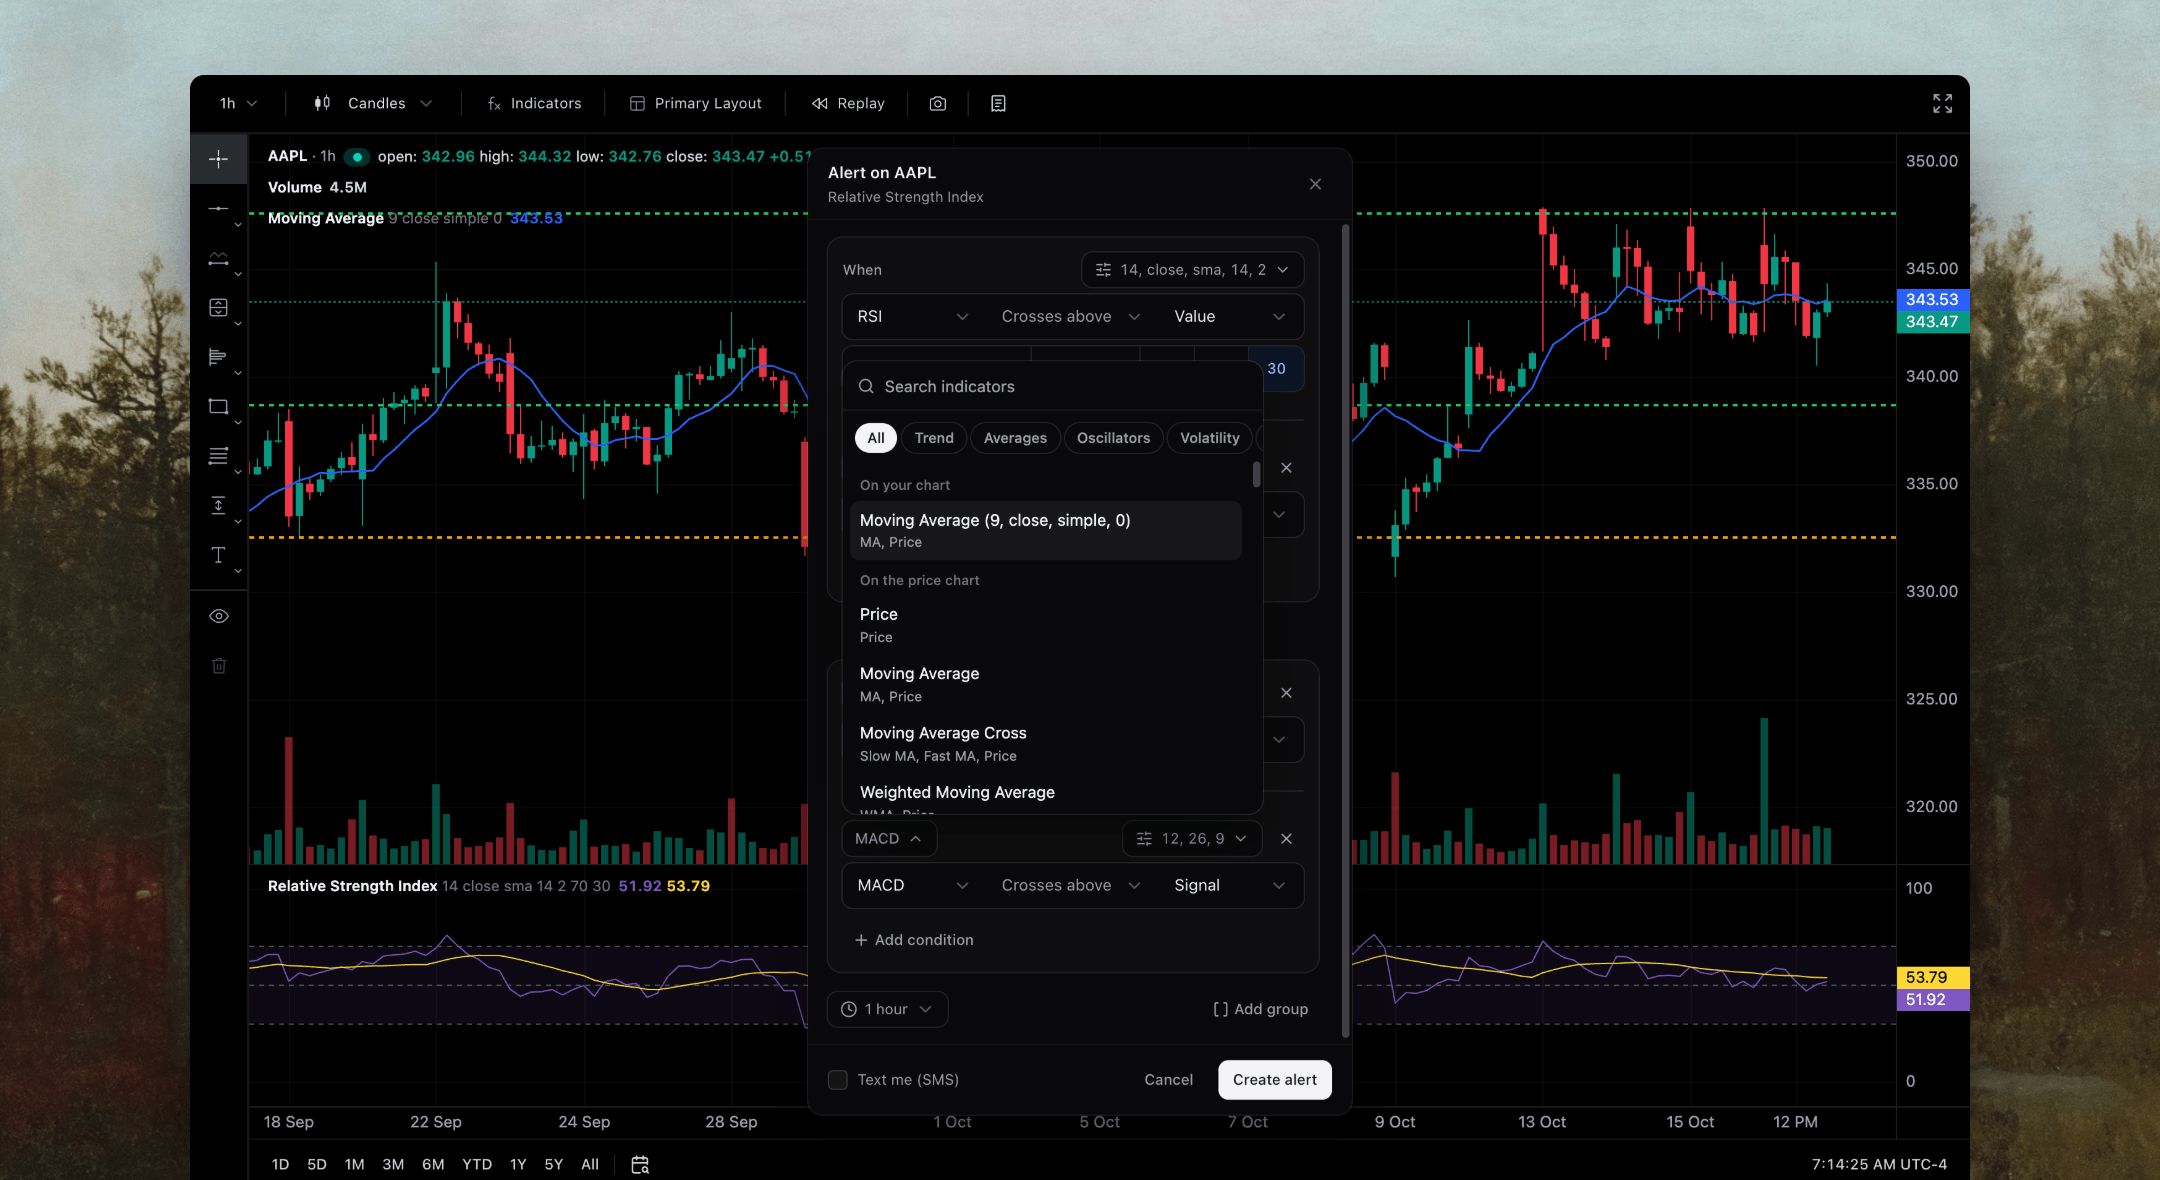
Stack up to 10 conditions across 60+ indicators and 9 timeframes, grouped with and / or and brackets. You hear about it only when all of it holds.
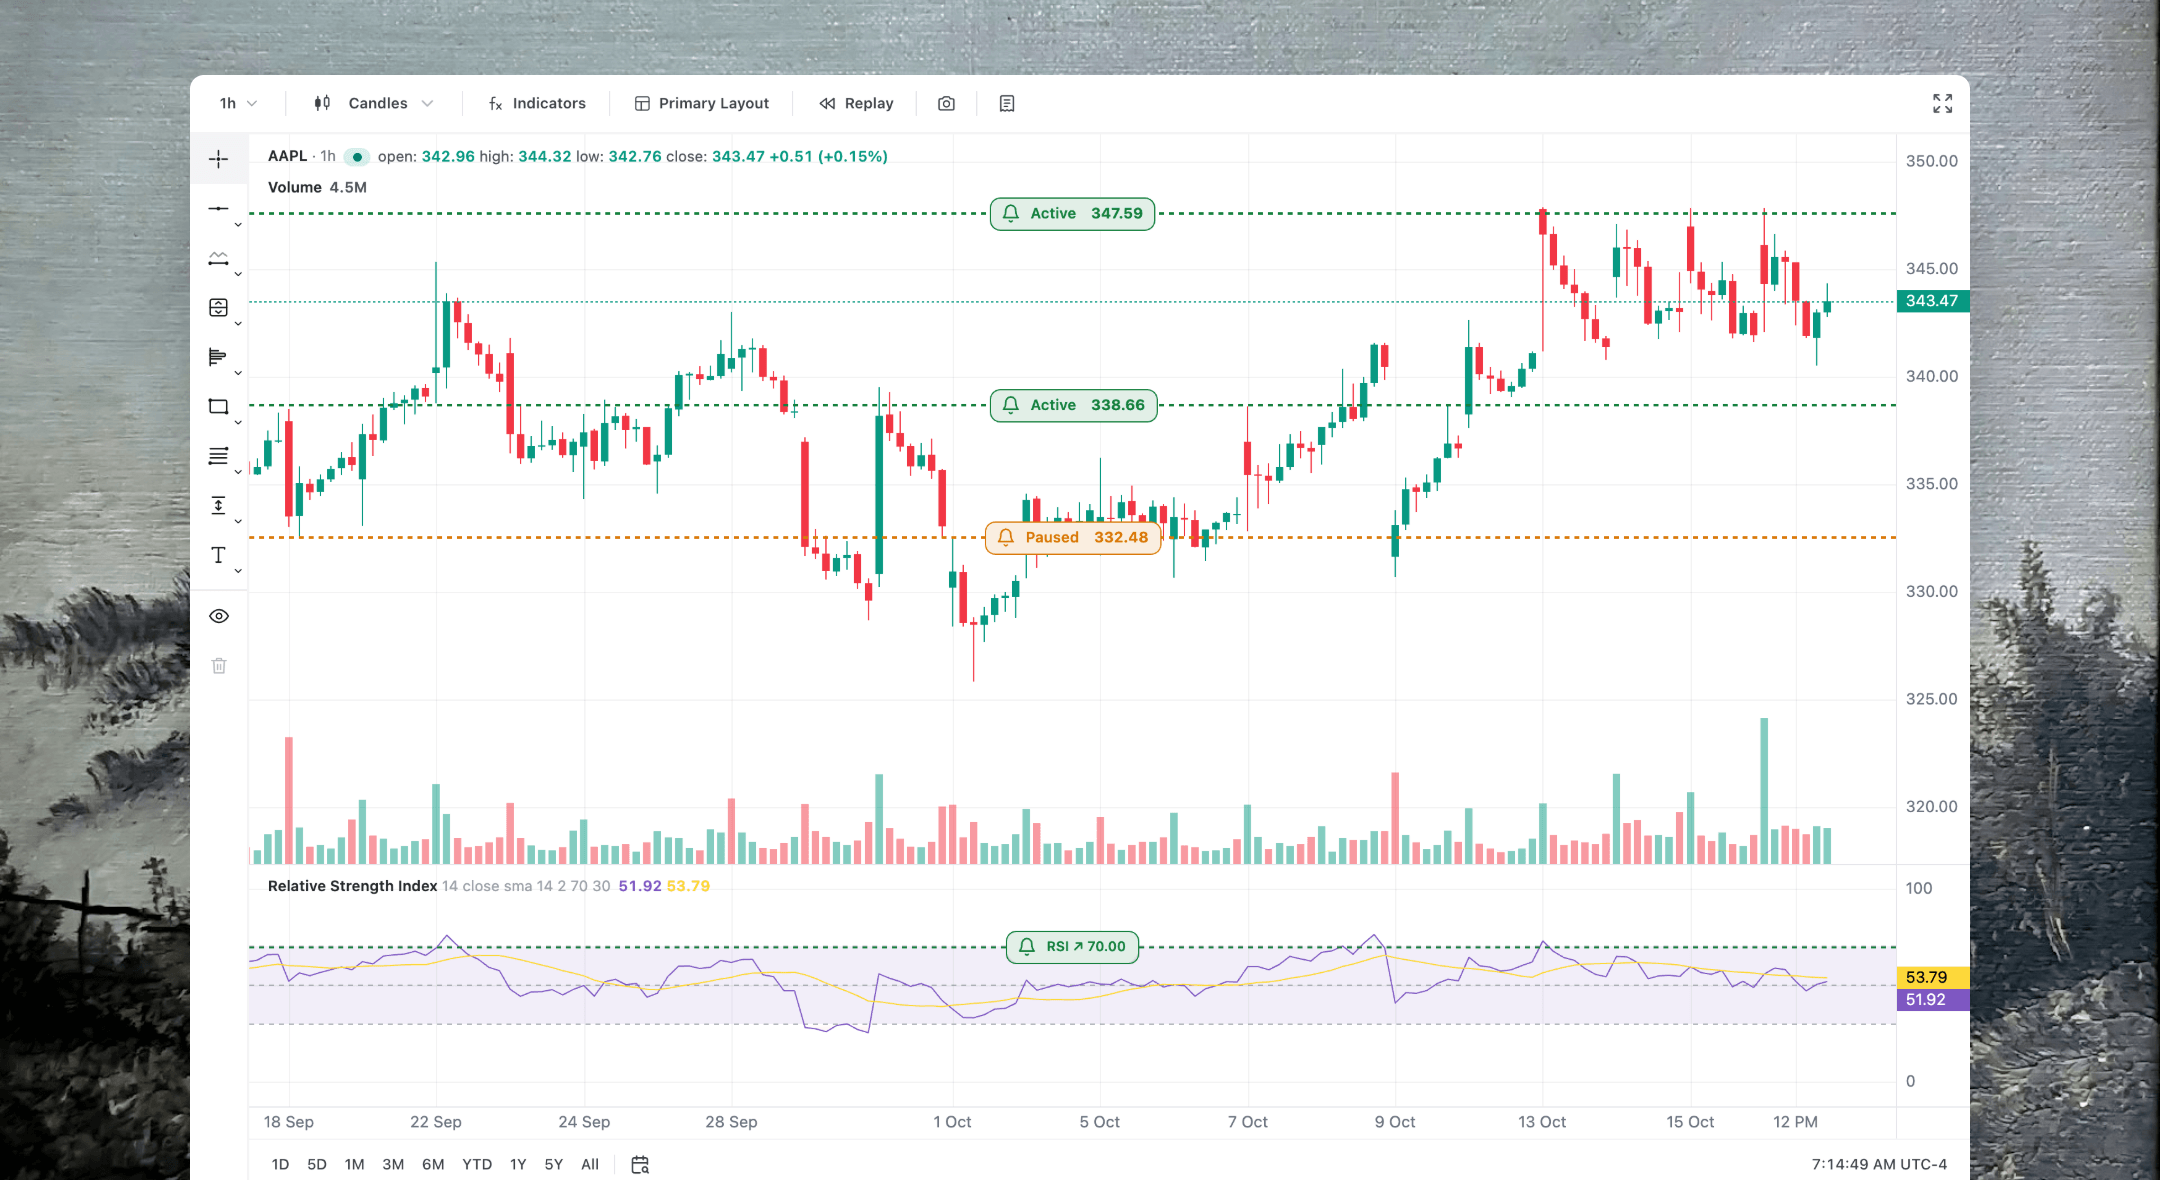
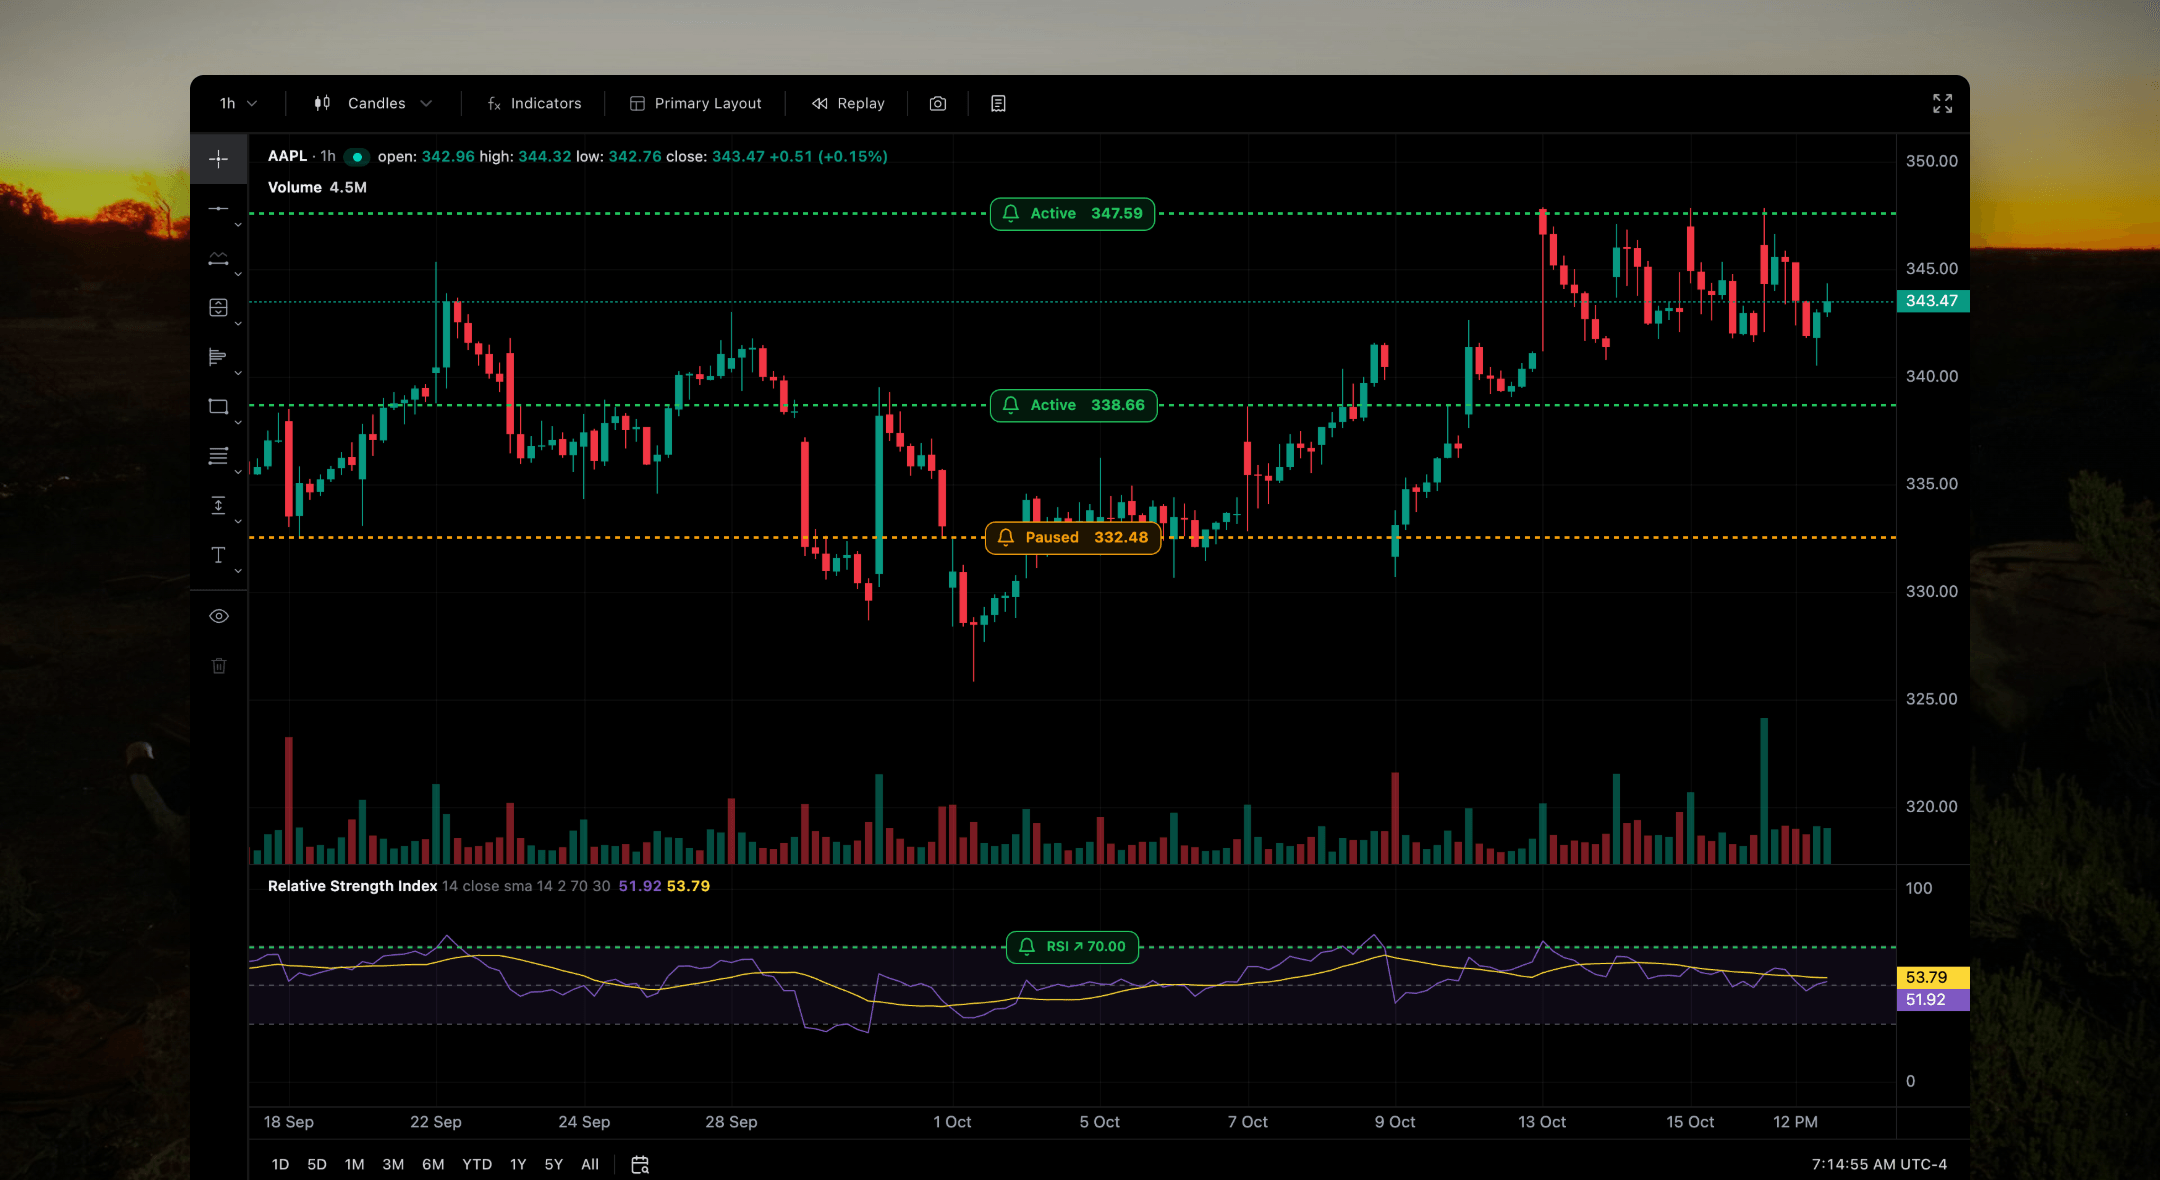
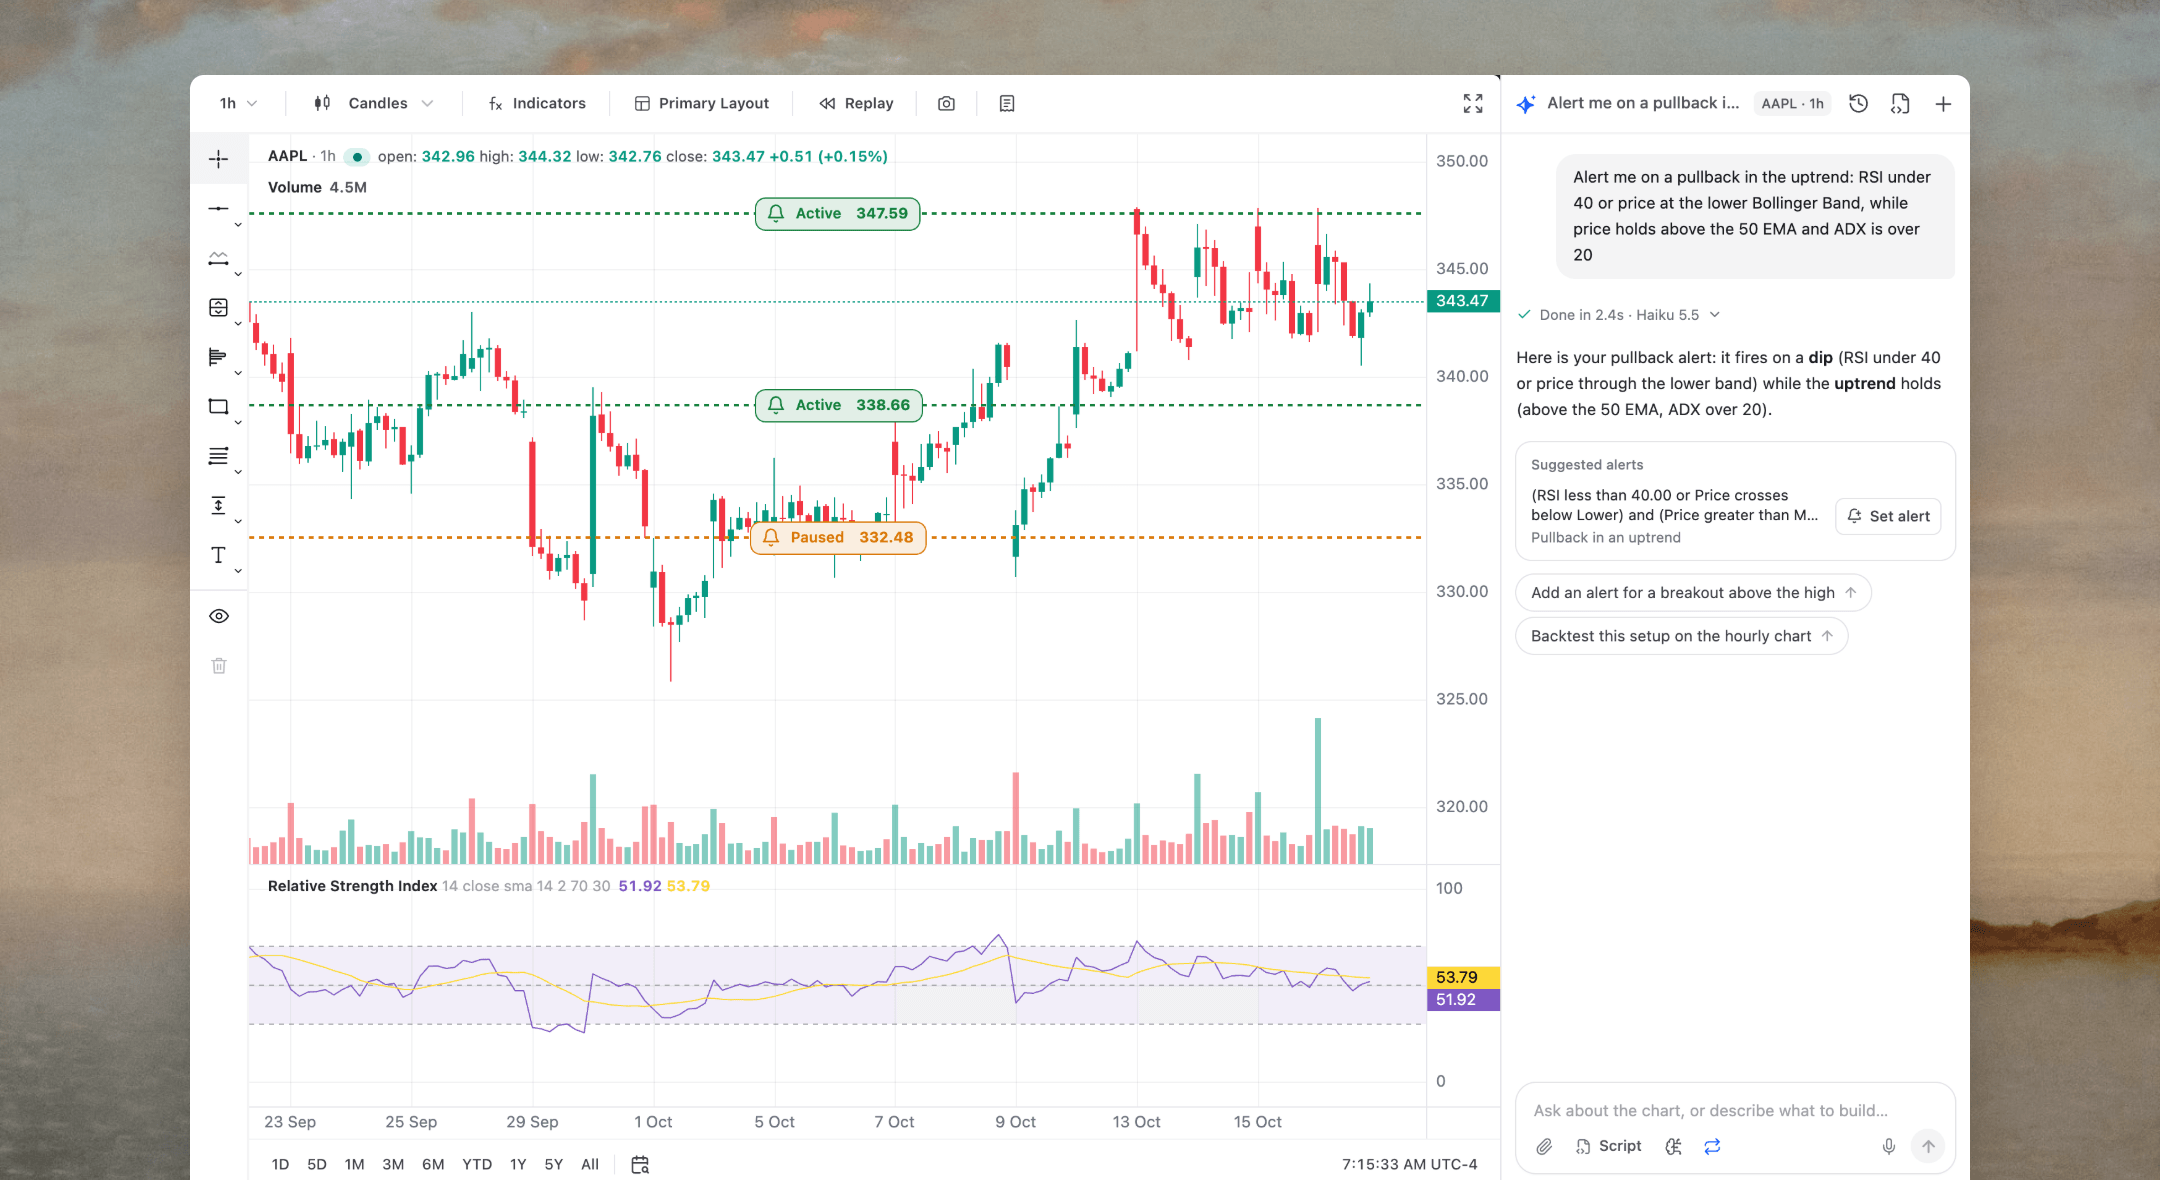
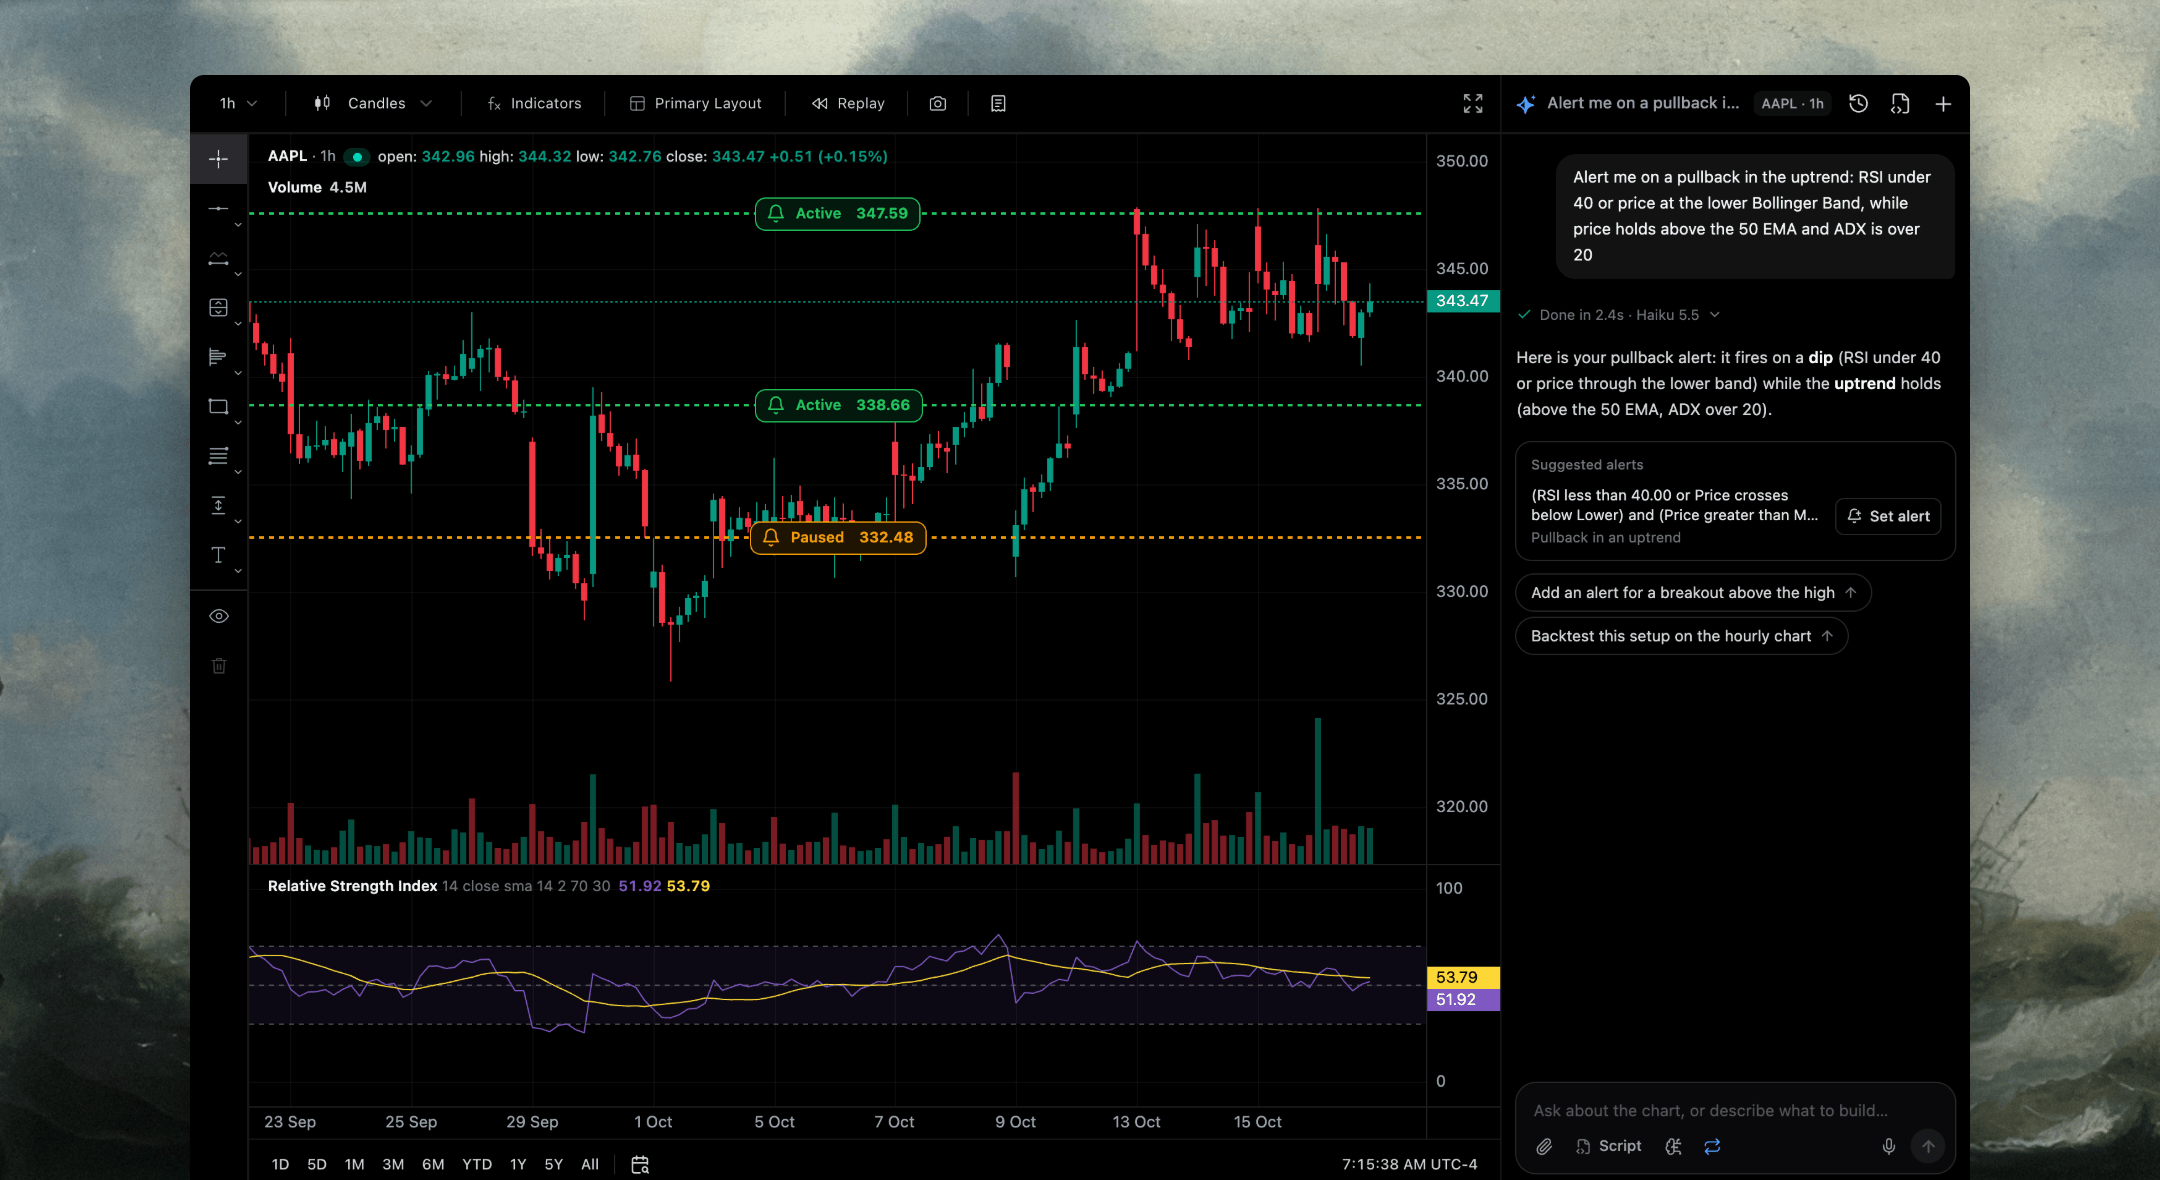
Up to 10 conditions
RSI crossing 30 and price above its moving average, in one alert.
And / or, in brackets
Group conditions so (A and B) or C means exactly that.
Crossings that remember
A crossing alert knows which side it started on, so it fires only on a real cross.
Every common indicator
RSI, MACD, moving averages, Bollinger Bands, ADX, SuperTrend, Ichimoku and many more.
Their own settings
Each condition keeps its indicator’s length, source and smoothing.
9 timeframes
Each alert checked on the timeframe you choose, intraday or daily.
From the legend bell
Set an alert on any indicator straight from its legend.
Divergence and volume
Bullish or bearish divergences, and volume above its average.
From the pane’s +
Add an alert at a level on an indicator pane in one click.
Describe the setup
“RSI crosses back above 30 while price is above the 200 EMA” becomes an alert.
Brackets included
Flow Agent builds and / or groups for you, ready to review before saving.
Levels from the chart
Ask for alerts at the nearest support and resistance and it finds them.
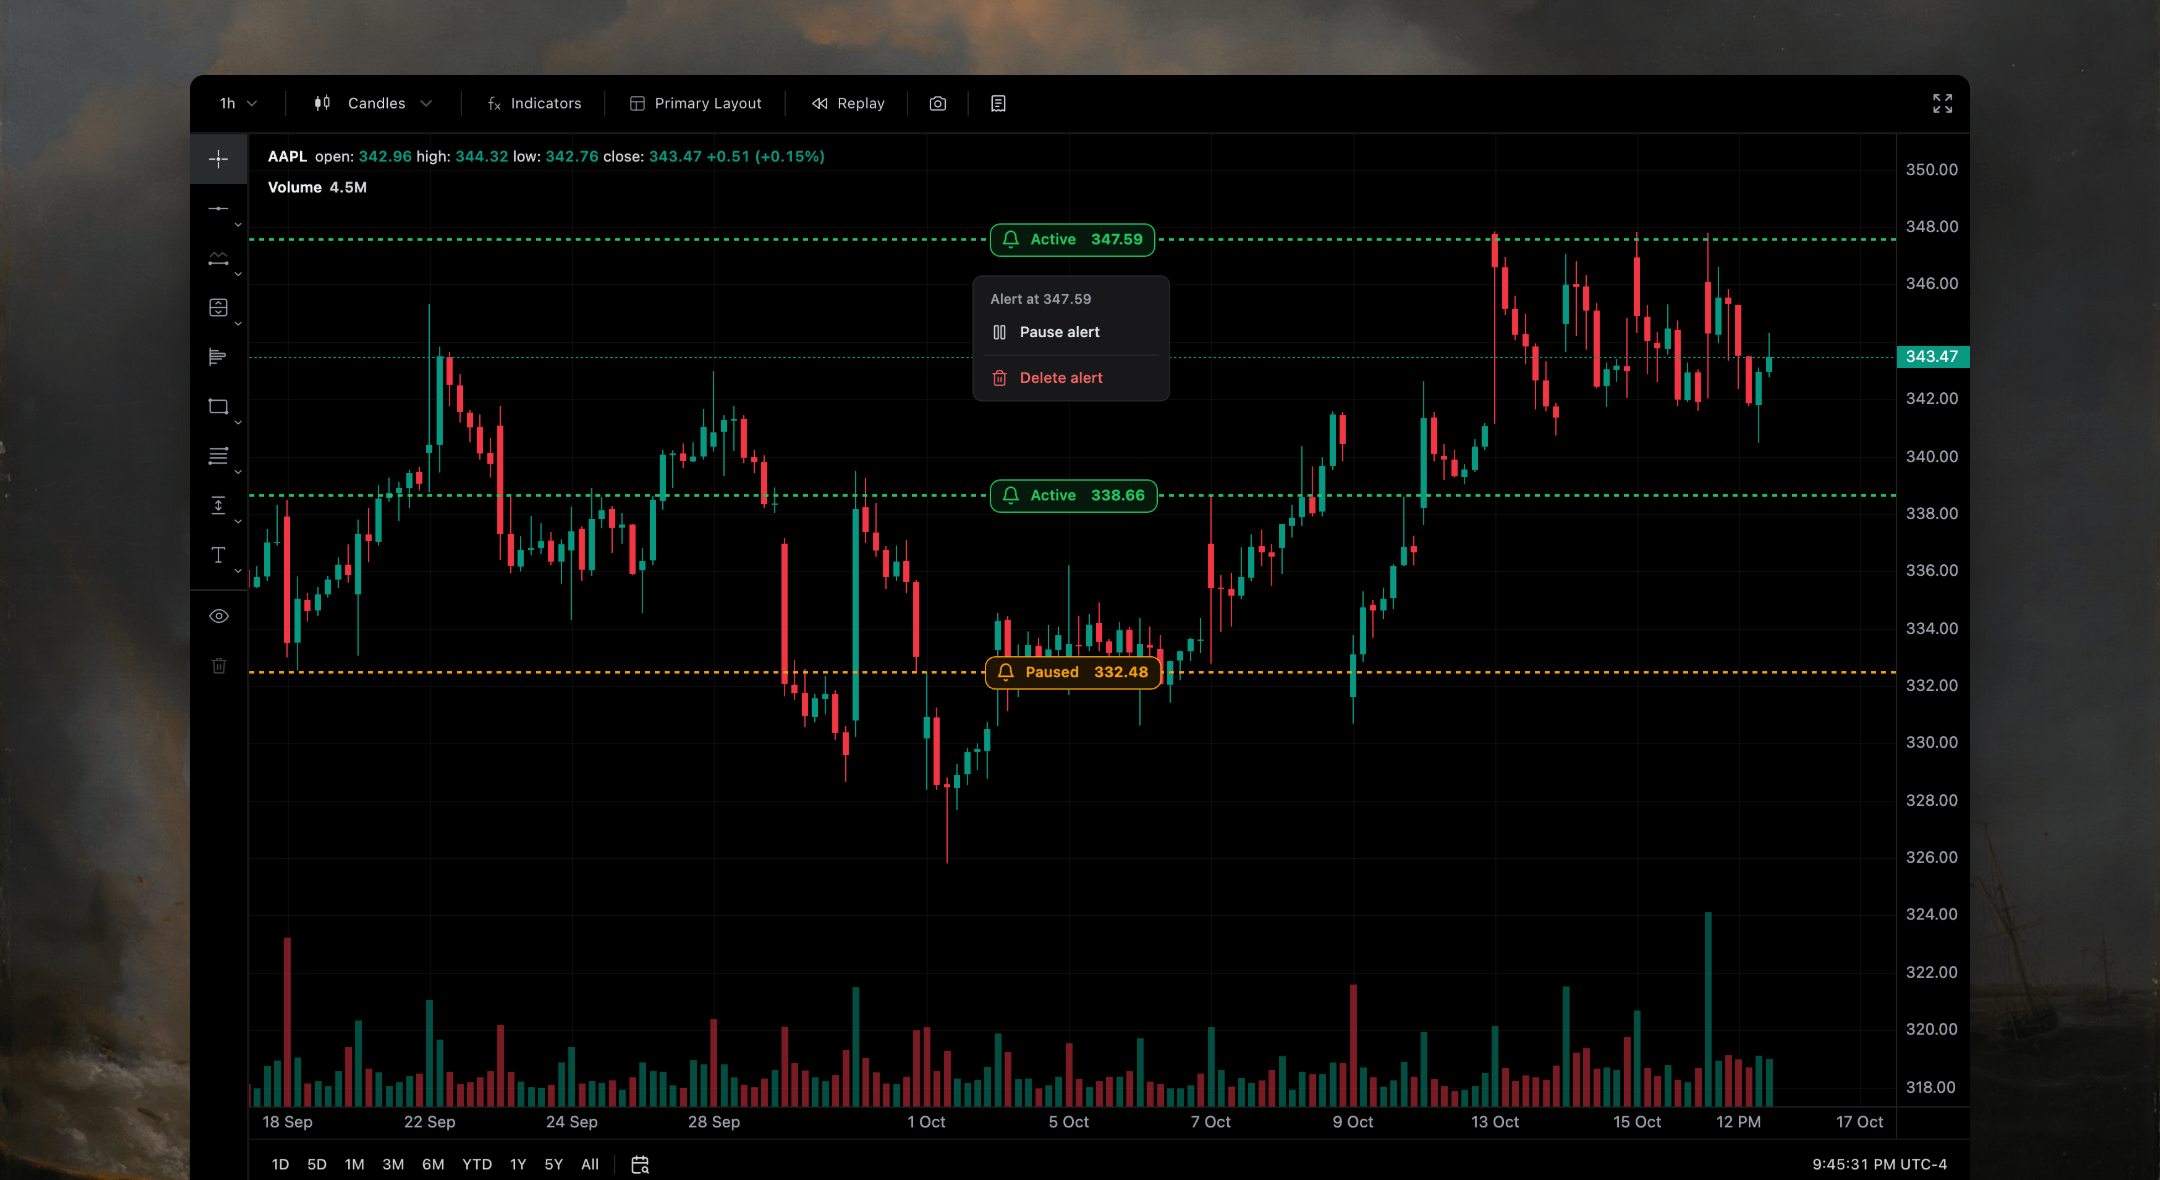
On the chart
Set price alerts as lines on the chart and drag them to a new level.
Every asset
Stocks, indices, ETFs and funds, crypto and commodities.
Where you are
Email, SMS for critical alerts, or webhooks into Slack, Teams, Discord and Telegram.
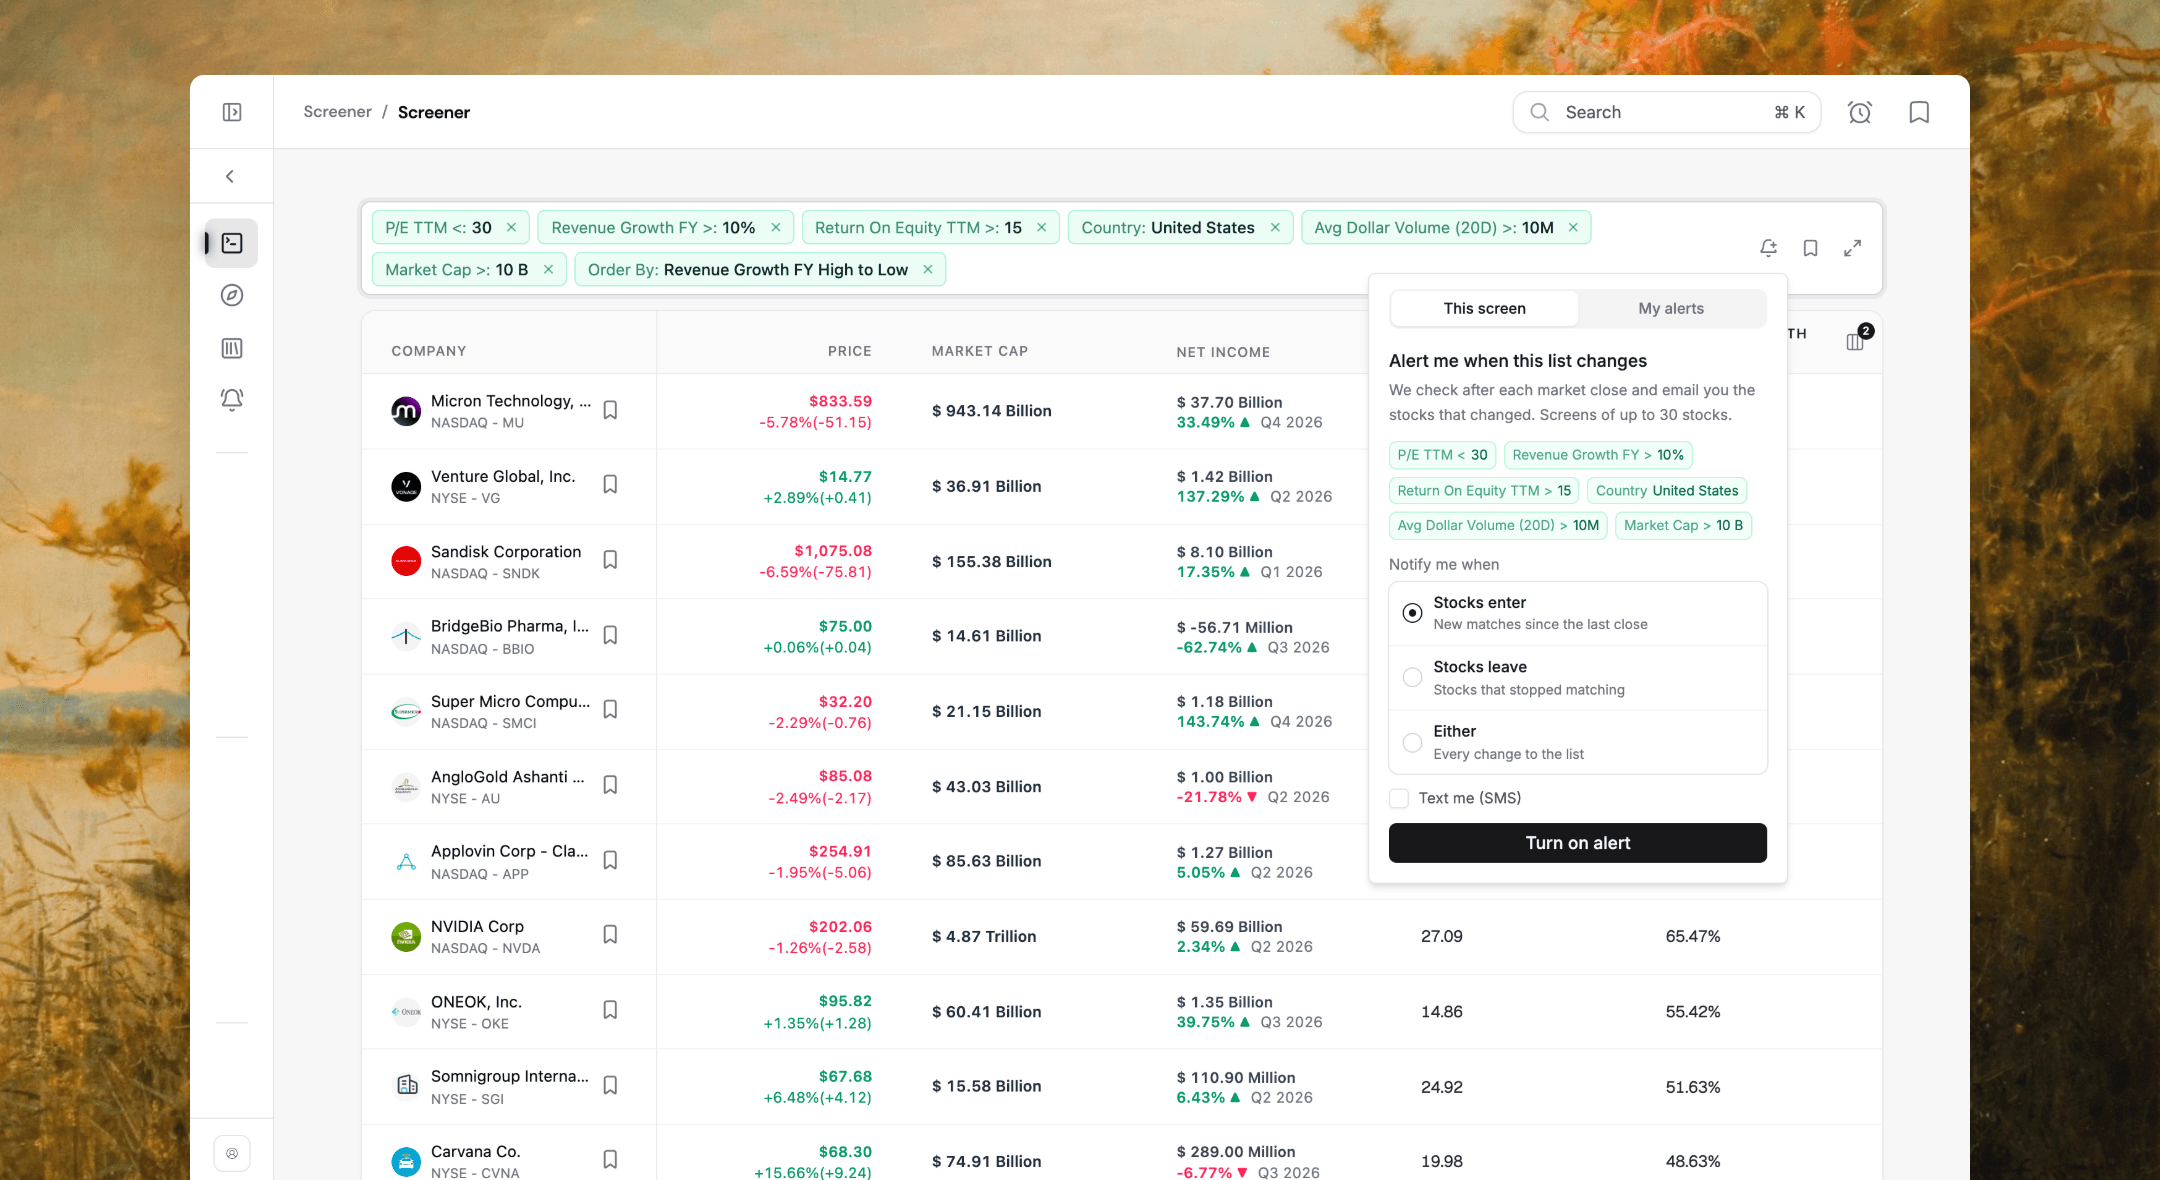
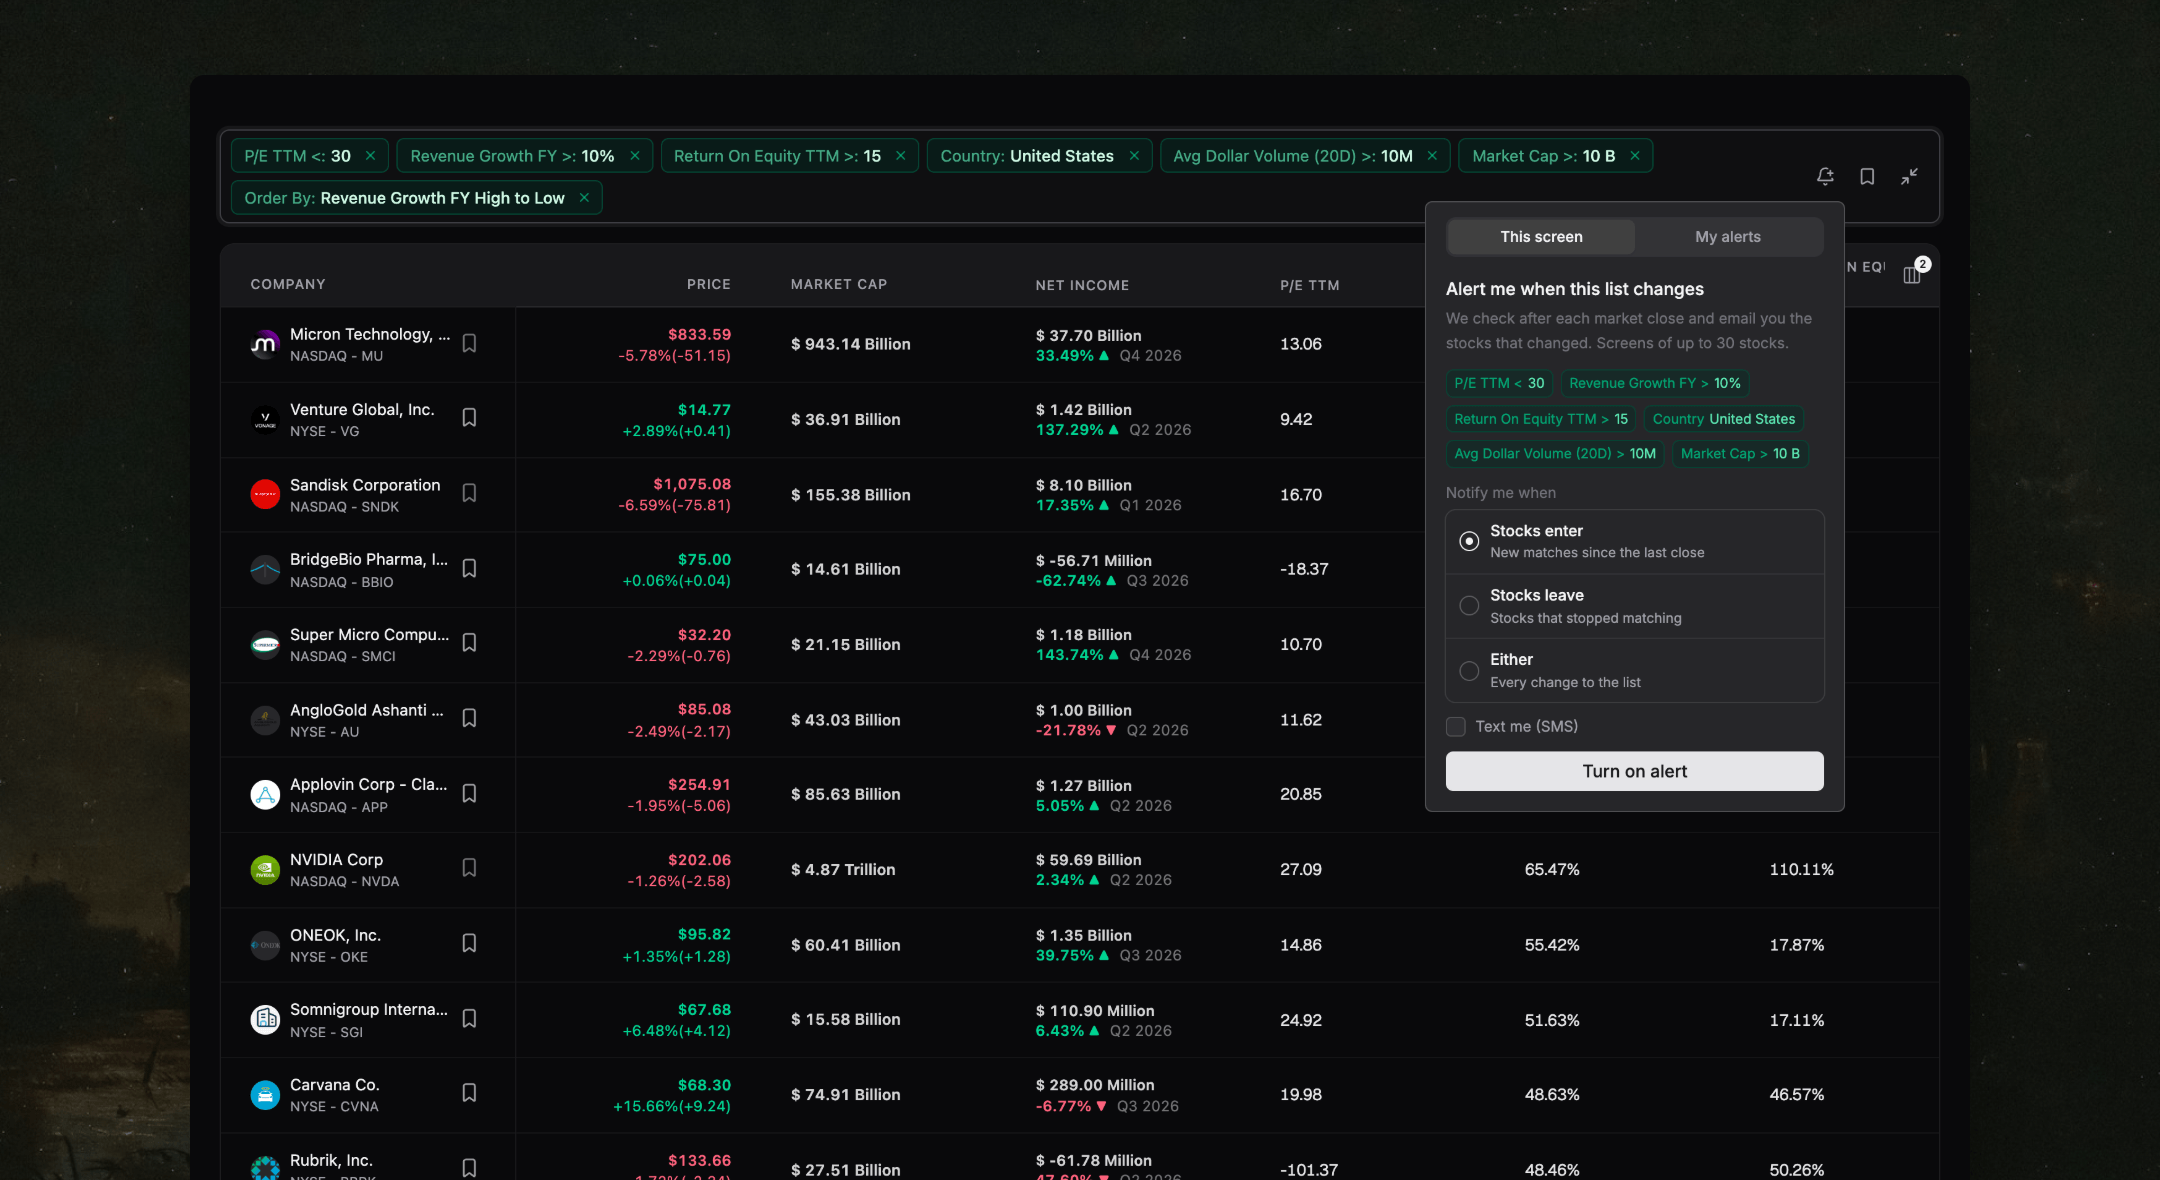
When a screen changes
The stocks that entered or left a screen, after each close.
Email or SMS
The changes with the screen’s filters, wherever you want them.
Fundamental alerts too
Revenue, margins, P/E and debt alerts on the companies you follow.
Lisa and X-Ray
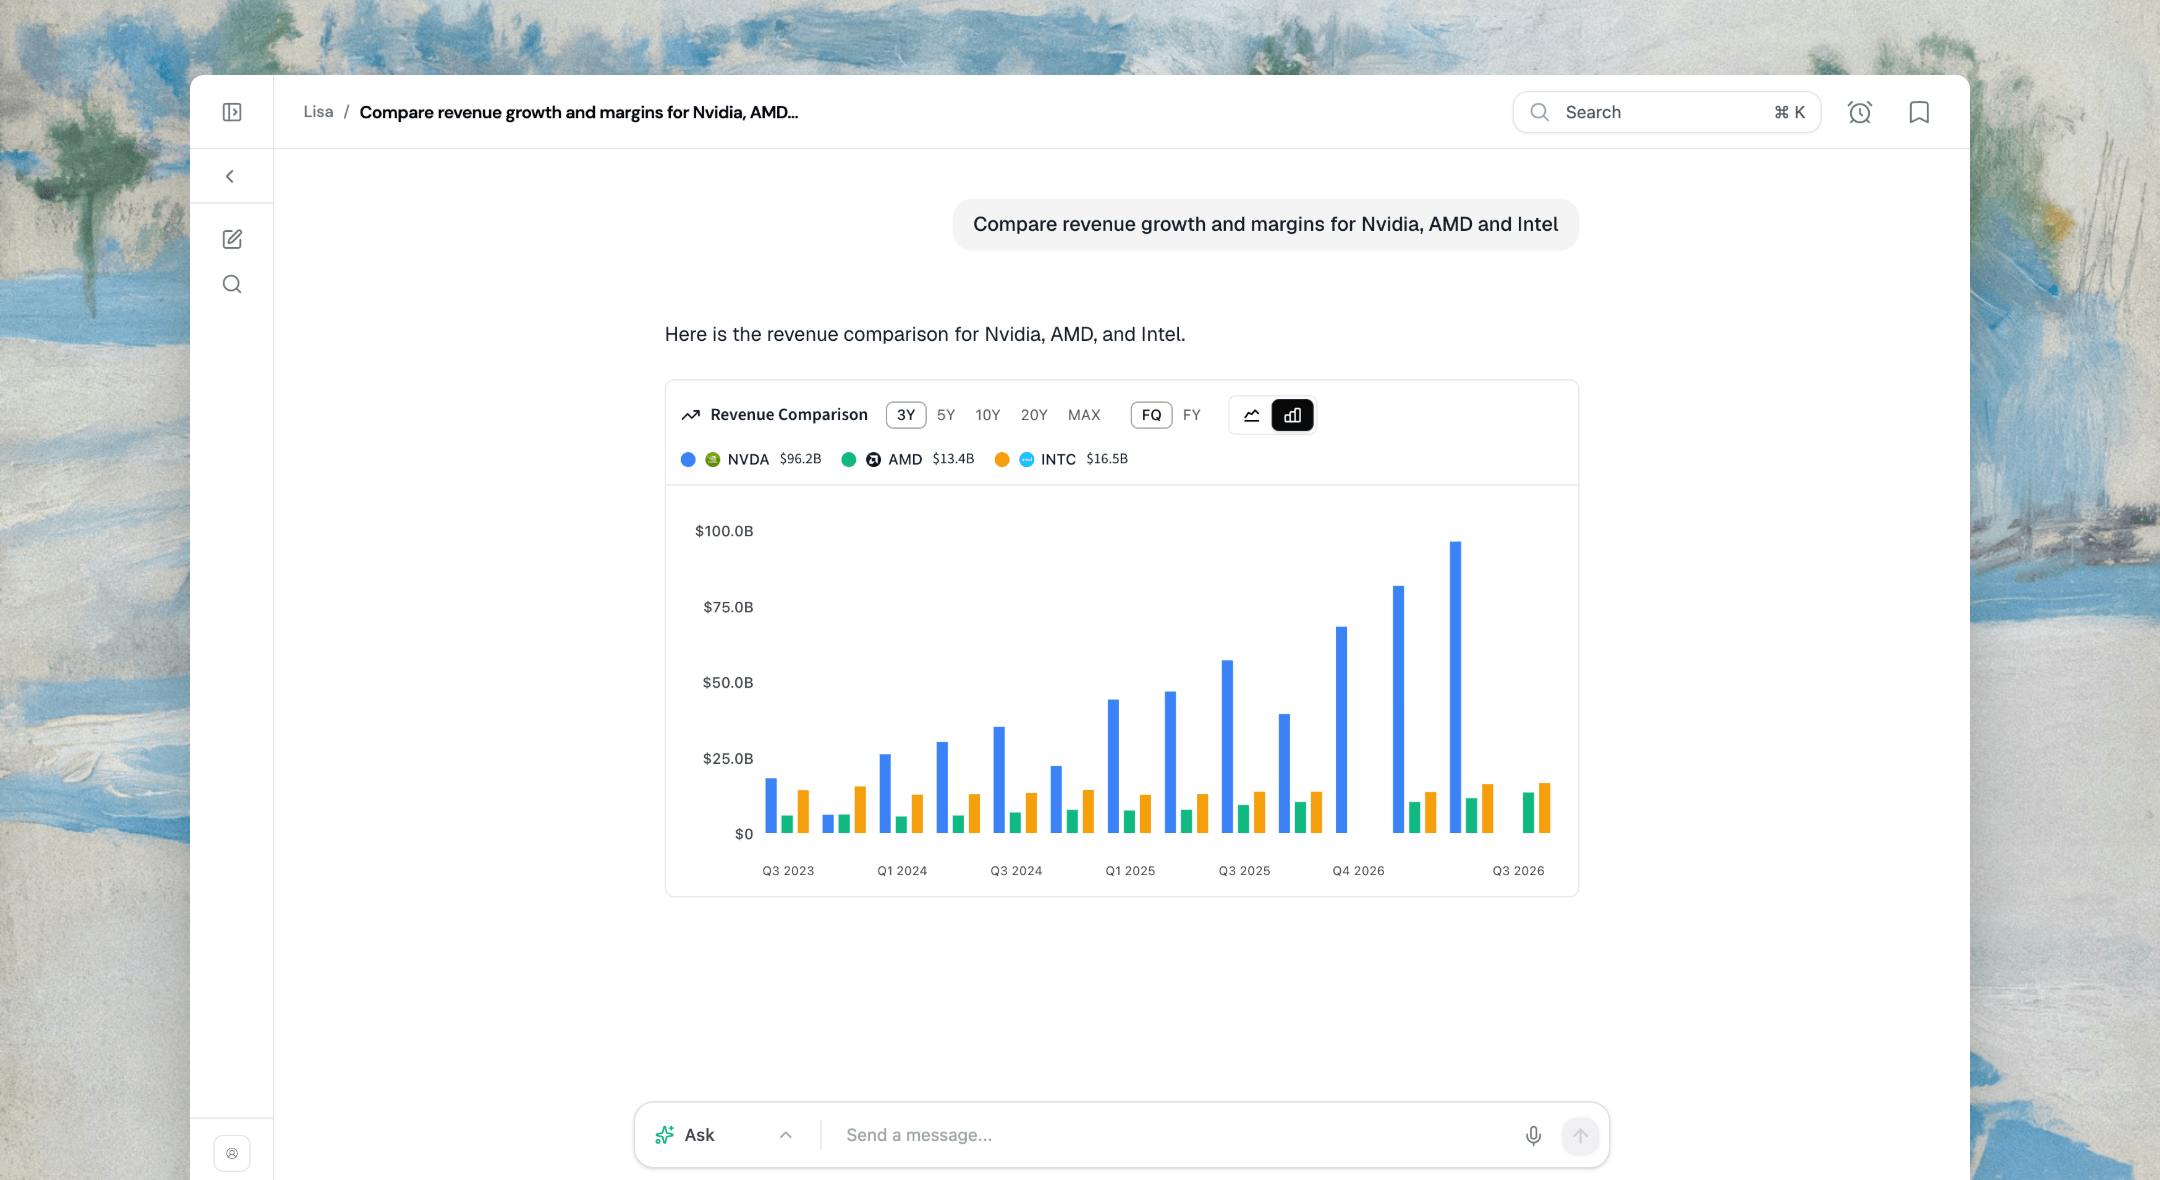
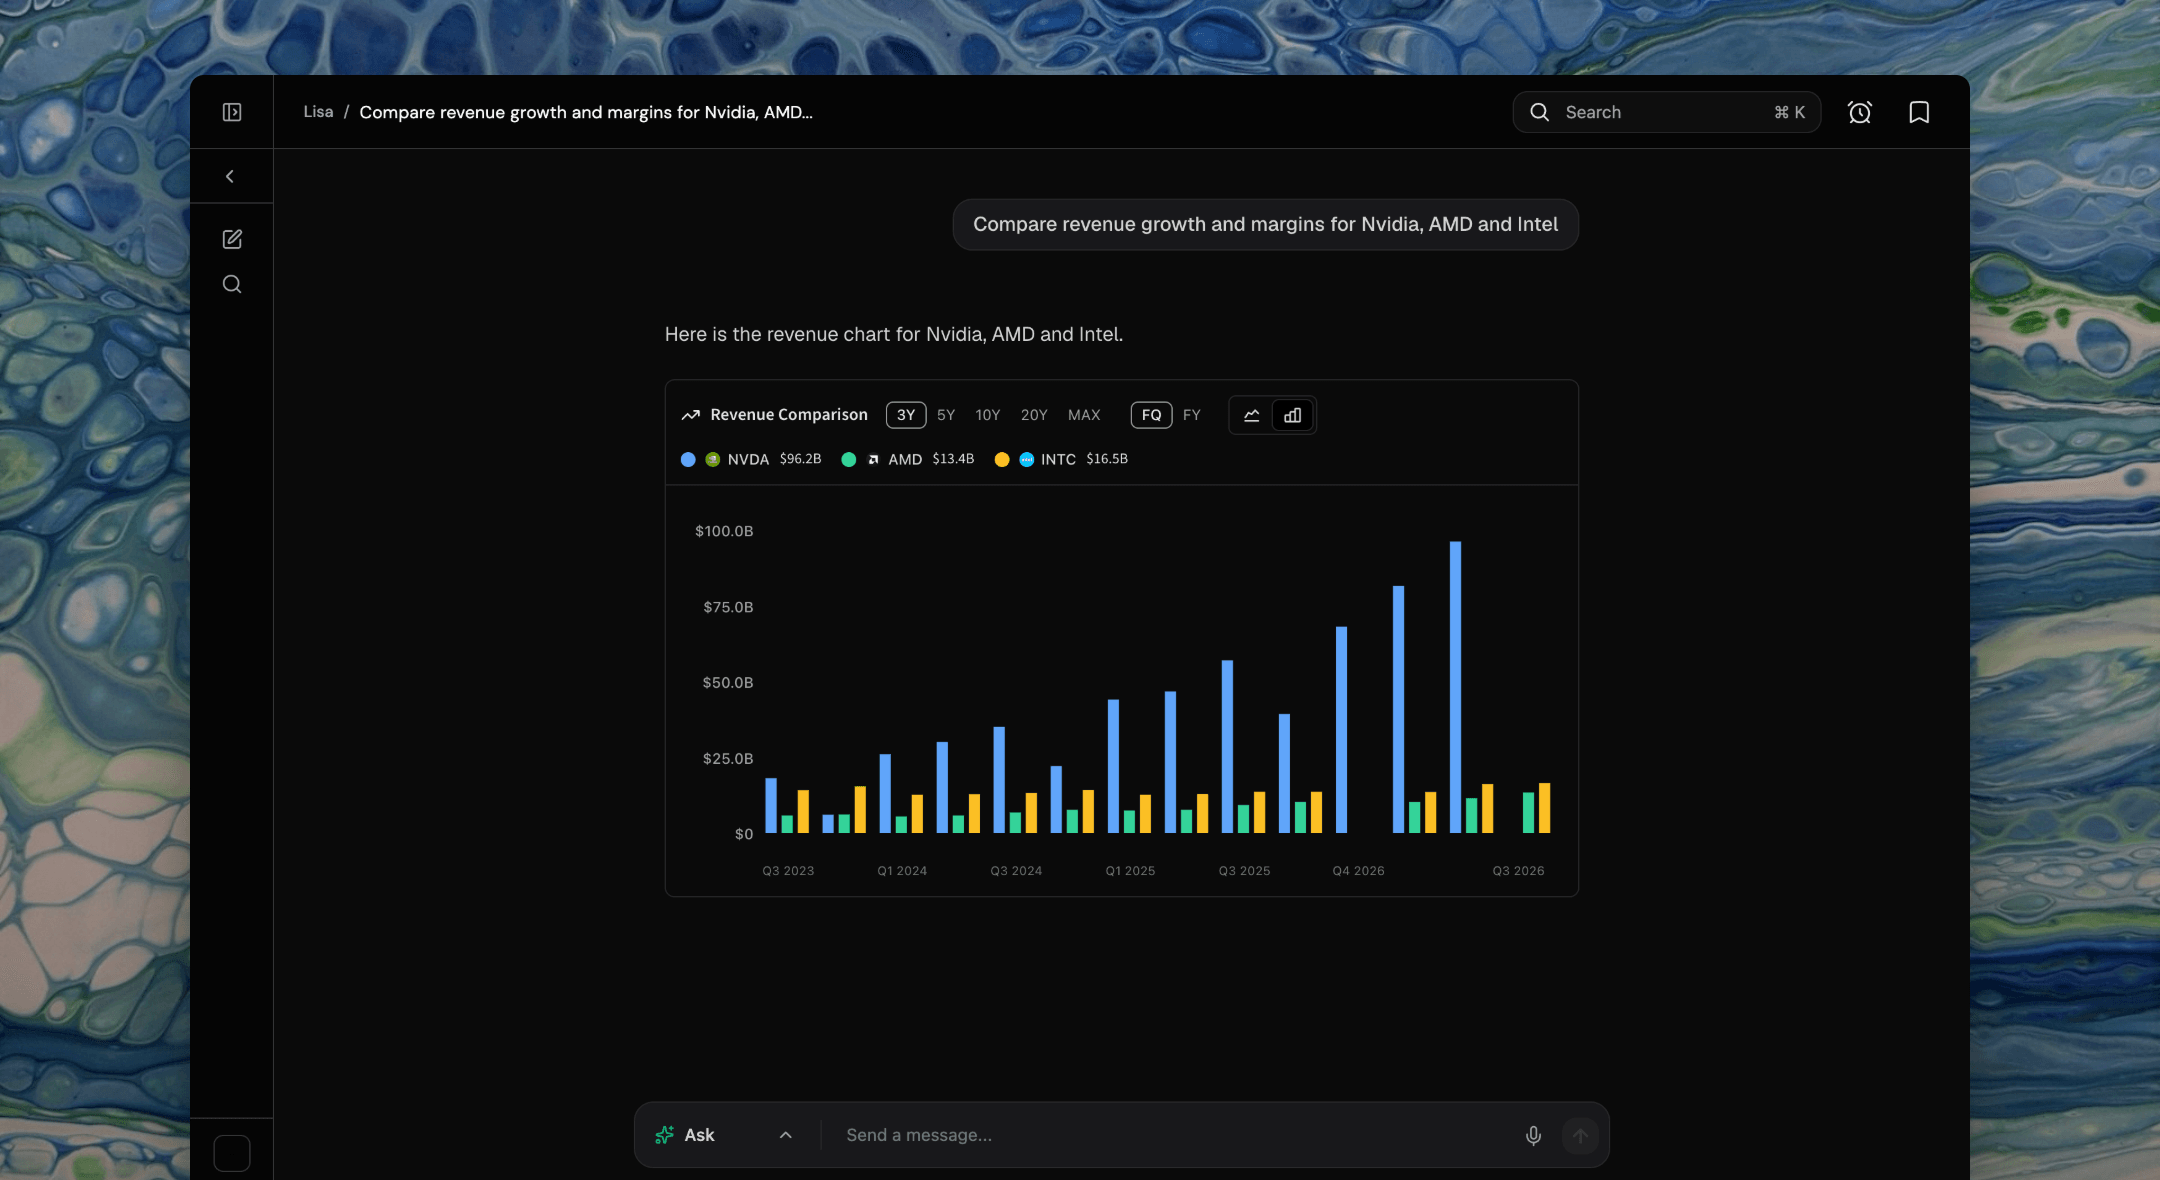
Ask a question. Get the answer with the chart.
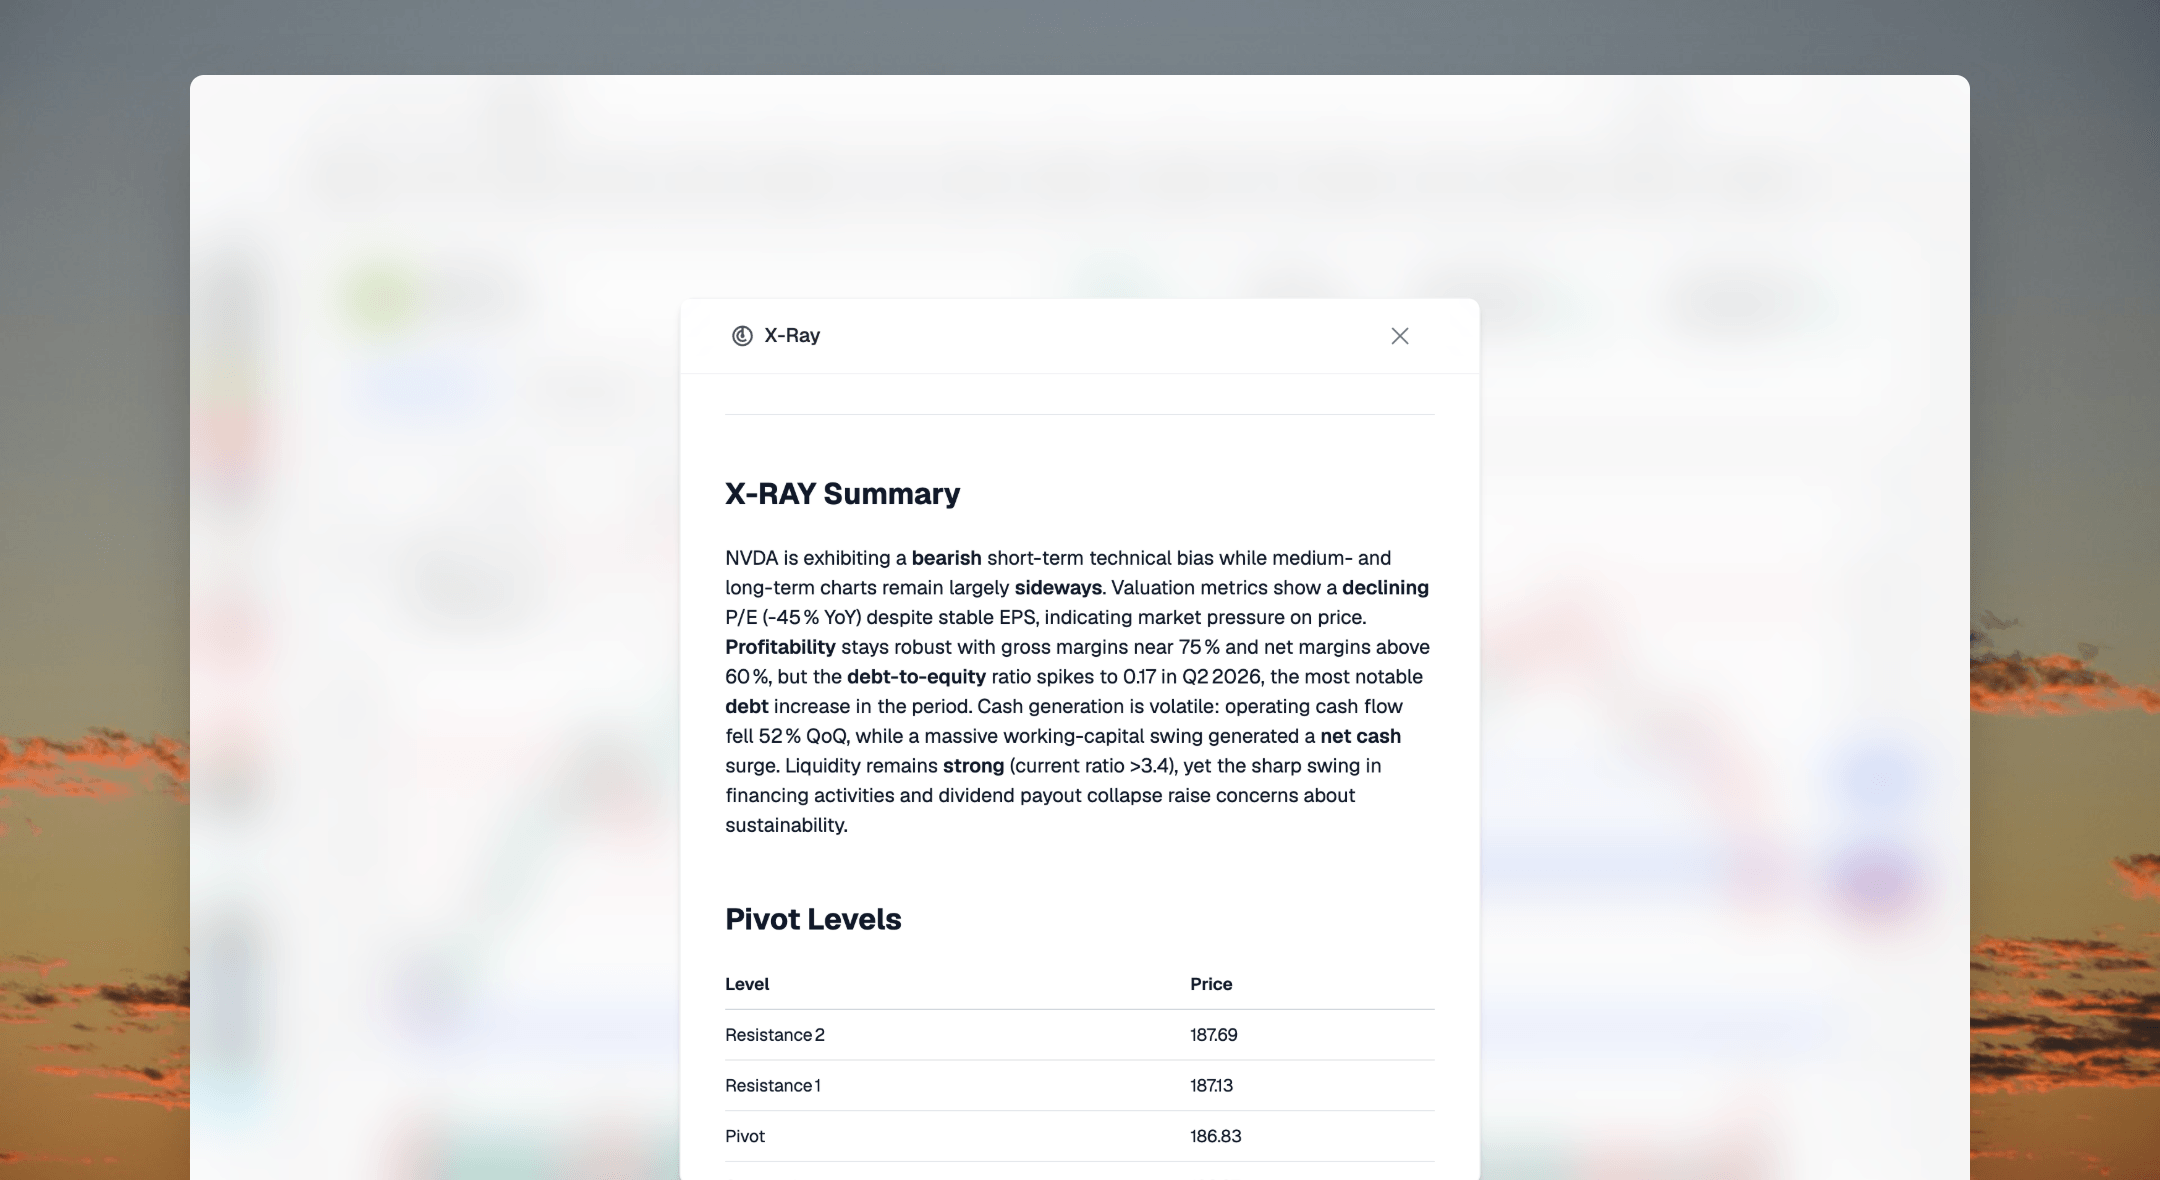
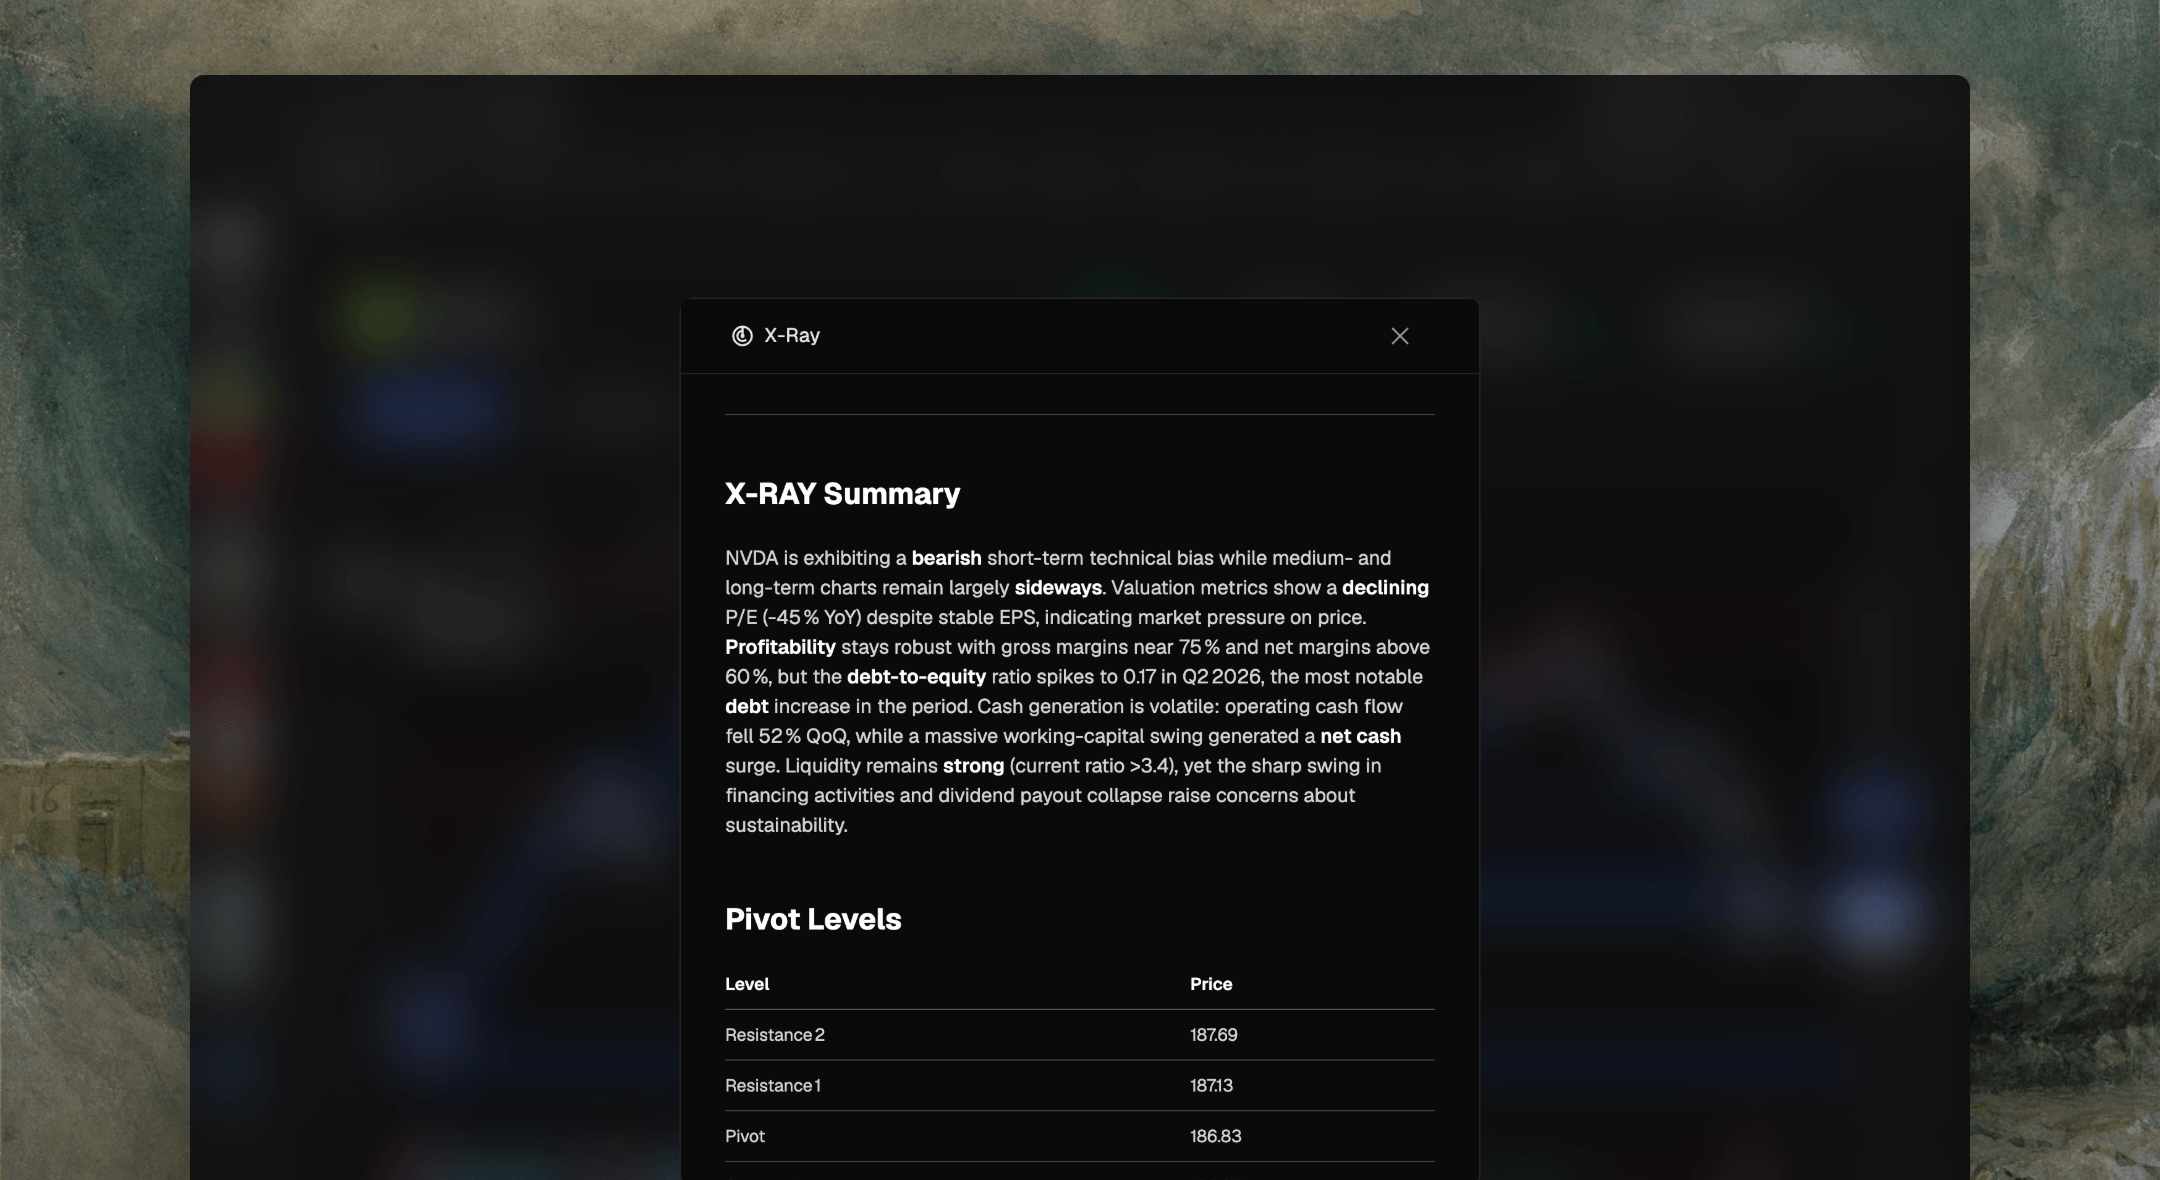
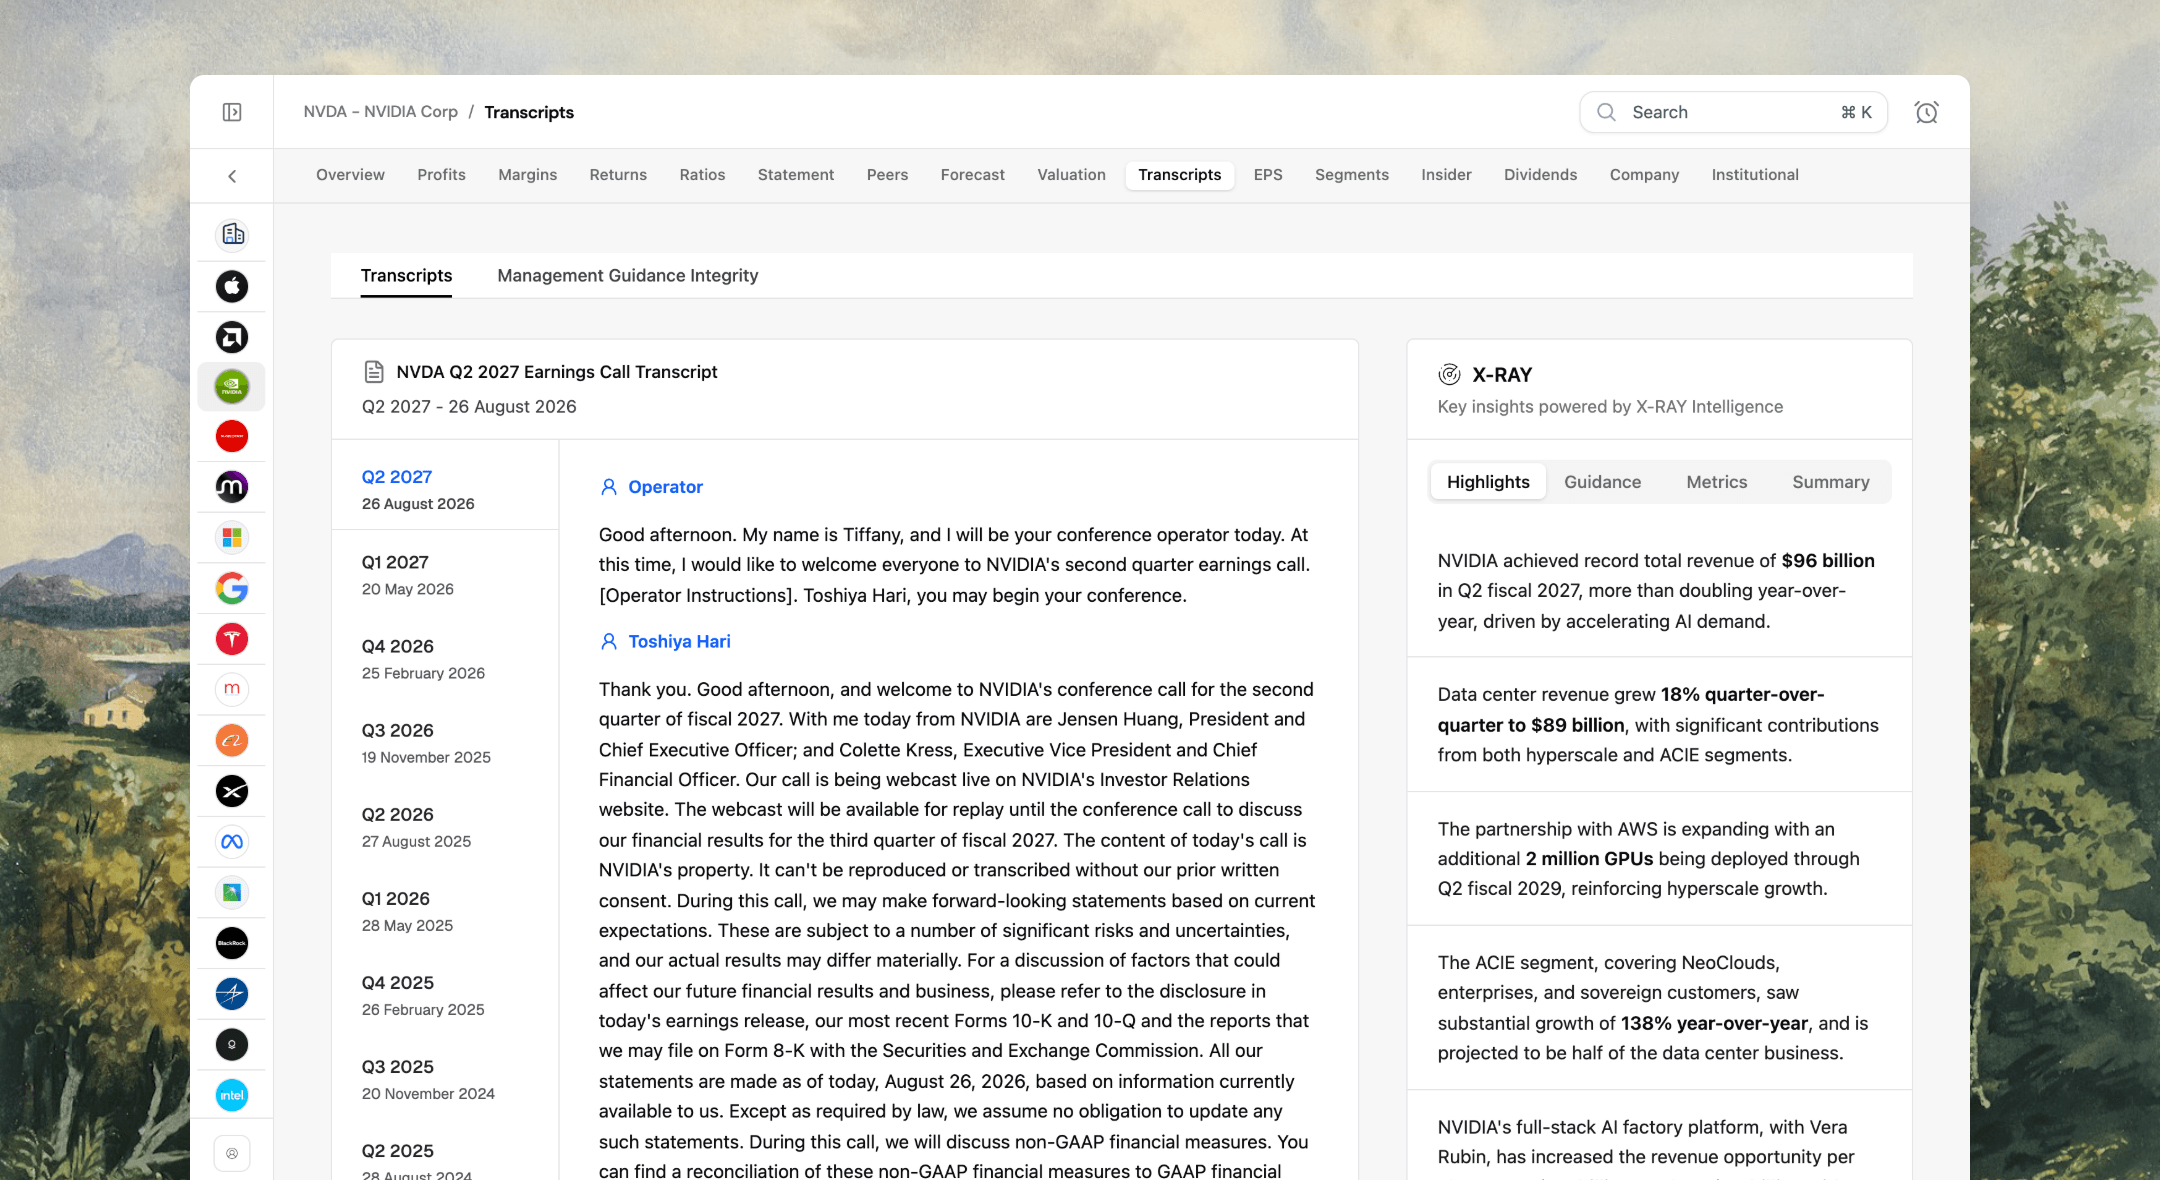
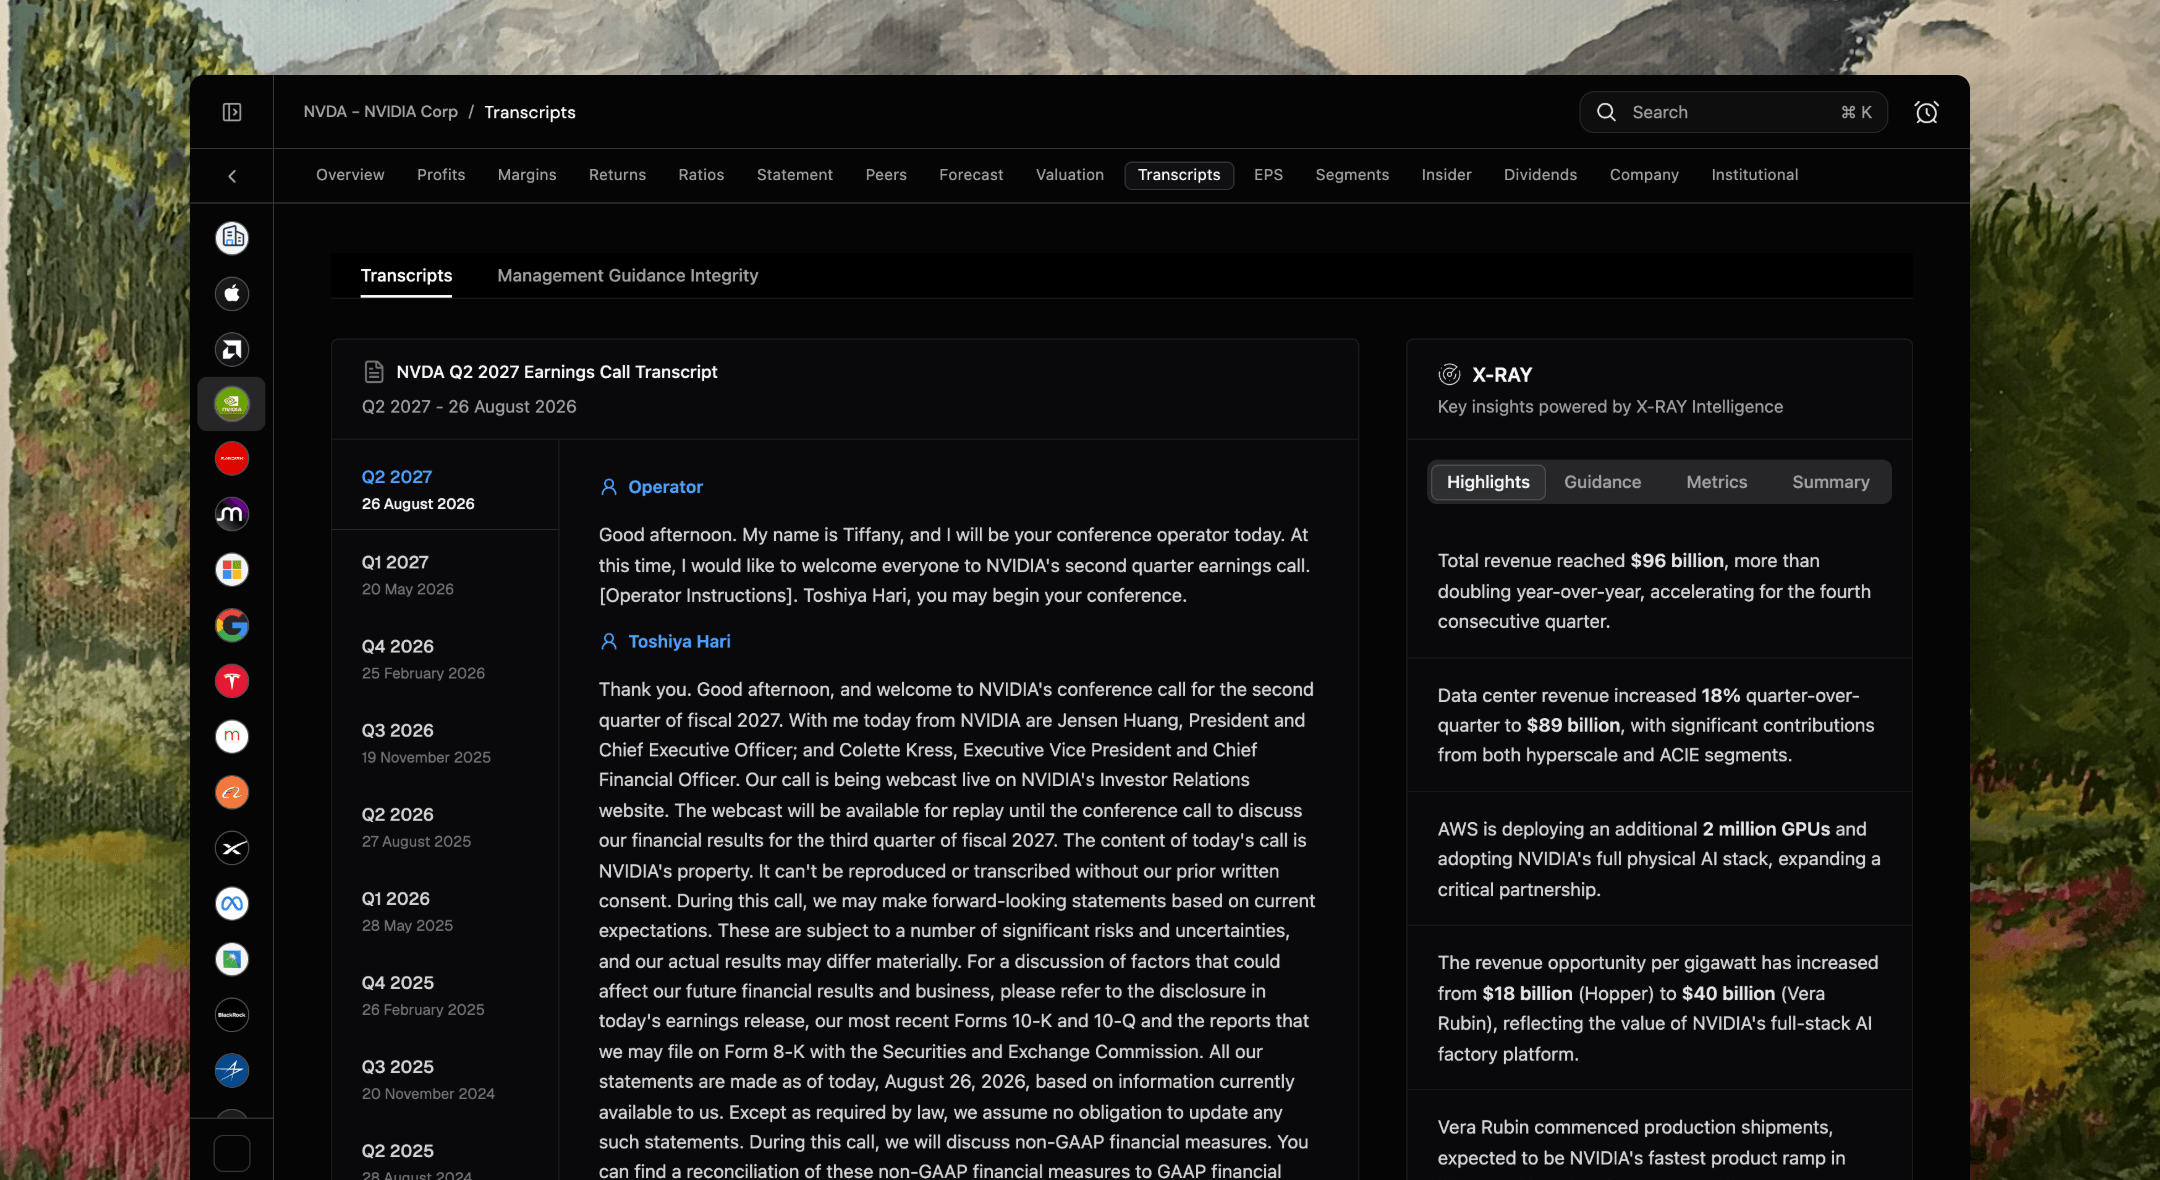
Lisa researches filings, fundamentals and earnings calls, and answers with live charts you can change. X-Ray reads any stock in one click, and scores whether management delivers on its own guidance.
Ask mode
Prices, ratios, margins and growth, answered with live charts in a credit or two.
Research mode
Valuation, bull and bear cases and growth comparisons, in depth.
Keeps the thread
“Compare Google and Microsoft”, then “also add Nvidia”, continues the same question.
Highlights and anomalies
What matters about the company, and what changed in its numbers.
Scorecard
The main financial metrics scored side by side.
Levels and technicals
Multi-timeframe pivot points and a read on the main indicators.
Every transcript
Earnings-call transcripts quarter by quarter, on the company’s page.
X-Ray beside the call
Highlights, guidance, metrics and a summary, so a call reads in minutes.
Guidance integrity
Management Guidance Integrity scores whether past guidance actually held up.
Built from a prompt
“Track the Magnificent 7” or a screener-style brief becomes a board of widgets.
Edit by asking
Add analyst ratings, drop ratios or track margins with a follow-up.
Shared with your team
Resize and reorder widgets, and share boards on the Team plan.
Explore more
Every part of Amsflow has its own page, with what it does, how it looks and how to use it.
See all features
The full tour of Amsflow: every tool, chart and agent, with screenshots and videos.
Charting
74 indicators, 59 drawing tools and 19 chart types on a chart engine we built ourselves.
Screener
1,390+ filters across fundamentals, chart patterns and strategy signals.
Lisa
Ask about any company and get the answer with a live chart you can change.
Advanced Alerts
Up to 10 conditions in one alert, so you hear about it only when the whole setup holds.
Rotation
Watch money move between sectors in 14 markets, with a decade of playback.
Portfolio
Six-factor attribution shows what drives your returns, not just what they are.
Crypto
Funding, liquidations and on-chain cycle metrics, past the price chart.
Planner
Project your net worth through retirement with Monte Carlo, linked to your portfolio.
Journal
See what every mood and mistake cost you, in money.
Dash
Build a live dashboard from one prompt, then edit it by asking.
What customers say about Amsflow
In their own words, from customers who use Amsflow.
“Amsflow packs a lot into one place without feeling overly complicated. I like being able to research stocks, compare financials, use the screener, set alerts, and dig into charts without bouncing between several different sites. The AI tools are useful for getting a quick second look at a company, while the portfolio and planning features add some depth.”
“Amsflow looks like a powerful all-in-one solution for financial teams! Love the seamless integration of AI insights and collaboration tools.”
“That a great tool and after you go ahead you find the point that you like. For me perfect to make a portfolio and check it out. And also Support with good support. And also nice dashboard. I like it very well and happy with selection (after seaching other tools in internet). For me perfect.”
“Great software for stock monitoring and trading. Both Amsflow and my personal investment account matches in terms of profit and losses. Only wished that choosing a date would generate the price like Tykr for that specific day, but I get why it shouldn't. I love how I could generate an AI report for the income statement and balance sheet for each company and it condense it into an easy to digest format.”
“This AI-based stock analysis tool is spot-on I feel, and seems to give good, rounded advice and results. The UI and layout are easy to follow and so far, I've not run into any major issues. Overall, a good analysis tool to use!.”
“An absolute game-changer! The platform is super sleek and easy to use for financial analysis. Honestly, what impressed me the most is how amazing their customer support is—I asked them to add the Saudi market, and they actually did it so fast. Really appreciate their effort, and I totally recommend it to any investor!”
“Amsflow is an impressive all-in-one platform for financial research and portfolio tracking. The interface is sleek, intuitive, and packed with useful tools—from global screeners and detailed fundamental data to customizable alerts, technical charts, and AI-powered analysis through Lisa and X-Ray. The lifetime plan offers strong value, especially considering the frequent updates and expanding features like Dash, Planner, and Journal. I also appreciate that the team seems responsive to user feedback and actively improves market coverage and functionality. A great option for investors who want powerful analytics in one convenient web-based platform.”
“I can only offer my compliments. Initially, I gave it 4 stars in my review because the list of cryptocurrencies was very limited. Within a week, the founder contacted me to let me know that he had added 4,300 cryptocurrencies.”
“Nice software and value for money, it would be far better if it included API.”
“I've been using Amsflow Screener for a while now, and it's been a game-changer. Typing metrics and filters is easy and fast; it's by far the best screener I've used. Most screeners are complex, but Amsflow is intuitive.”
“Recently I’ve been using Amsflow to manage my portfolio across multiple assets, and it has truly simplified the way I track investments. Instead of juggling different platforms, I can monitor equities, indices, commodities, and watchlists all in one place. The real-time data and advanced charting tools give me clear insights into performance, trends, and correlations, which helps me make faster and more informed decisions. What I appreciate most is the flexibility of customizable watchlists. I can organize assets by sector, geography, or risk profile, which makes it easy to align the platform with my personal strategy. The analytics are robust, offering a detailed view of volatility, sentiment, and overall portfolio health. Navigation feels smooth and intuitive, so I never waste time searching for information. Overall, Amsflow has become a reliable tool that saves me time, reduces complexity, and gives me confidence in managing diverse investments efficiently.”
“Amsflow is an exceptional investment research and portfolio management tool that I highly recommend. .The fundamental data, and custom screening features empower me to make well- informed investment decisions.on top of it AJAY is very efficient and top of things, intially canada etf data were missing and he updated in just couple of hours, i am really impress with support”
“This is all web browser based, making it convenient to launch almost anywhere with internet. The GUI is easy to understand, and it provides great information with the opportunity to use AI to analyze things further. ”
“I am quite happy with the subscription that I have purchased. It is excellent value for money as compared to some of the other services out there. I purchased it for the real time global data available in Amsflow and it does have data on major global markets. The Developers are also super quick - I suggested 4 enhancements to make it easier to use this product - all these were implemented in 1 day. Overall very happy with the purchase.”
“X-Ray transforms hours of my analysis into instant insights. One click delivers comprehensive stock evaluation with technical signals, pivot points, and anomaly detection - it's like having a seasoned analyst at my fingertips.”
“Most screeners I've used are complex, hard to use, and overcomplicated, but Amsflow Screener is intuitive and straightforward. Finally, using a screener makes sense.”
“WORTH EVERY DOLAR!!!. The Amsflow support team is AWESOME, they solve the problem with indicators after weeks of hard work. They are all ears and that is for me a FULL 5 STARS APP. YOU CAN BUY WITH CONFIDENCE. I think this is a massive solid project. Thank you Amsflow.”
“It is a helpful stock analysis tool that makes it easier to evaluate market trends, company performance, and potential investment opportunities. The platform delivers clear insights in a simple, user-friendly way.”
“Been using Amsflow for a few months now, and it is my go-to tool for analysis. The Screener is the highlight! I can slice through global markets, filter by metrics that matter to me, and even get AI suggestions from Lisa. The combo of data + AI saves serious time and, more importantly, helps find 'HIDDEN GEMS'. feature, and you should explore it. The Series feature lets me line up different assets, sectors, or even macro indicators and actually see how they’re moving together (or not). Found a few interesting correlations I’d have 100% missed otherwise.”
“I’ve been using Amsflow for the last 6–7 months, and it’s by far the best financial research platform I’ve used. I was fortunate enough to get early access to the Amsflow Screener, and it truly feels magical. As far as I know, only two screeners offer global data: TradingView and the Amsflow Screener. I prefer the Amsflow Screener because it’s so simple to use, especially with its query builder. The Lisa Screener Agent is also incredibly helpful whenever I’m unsure which metrics to use. I would highly recommend it for finding swing stocks or for long-term investing.”
All reviews are from verified purchasers, collected after purchase. Reviews may not be representative of all customers and are not a guarantee of future performance or success.
