Portfolio
Professional portfolio tracking for curious investors. Transform how you monitor, analyze, and grow your investments across global markets. Track stocks, crypto, ETFs, and funds with institutional-grade analytics and intelligent insight with Amsflow Portfolio. Monitor multiple positions per symbol and benchmark against major indices with seamless performance tracking.


World-class Portfolio Management suite engineered for seamless tracking
Move beyond basic portfolio apps with Amsflow Portfolio's intelligent analytics and team collaboration. Monitor performance, analyze holdings, and make informed decisions with real-time insights across all major asset classes.
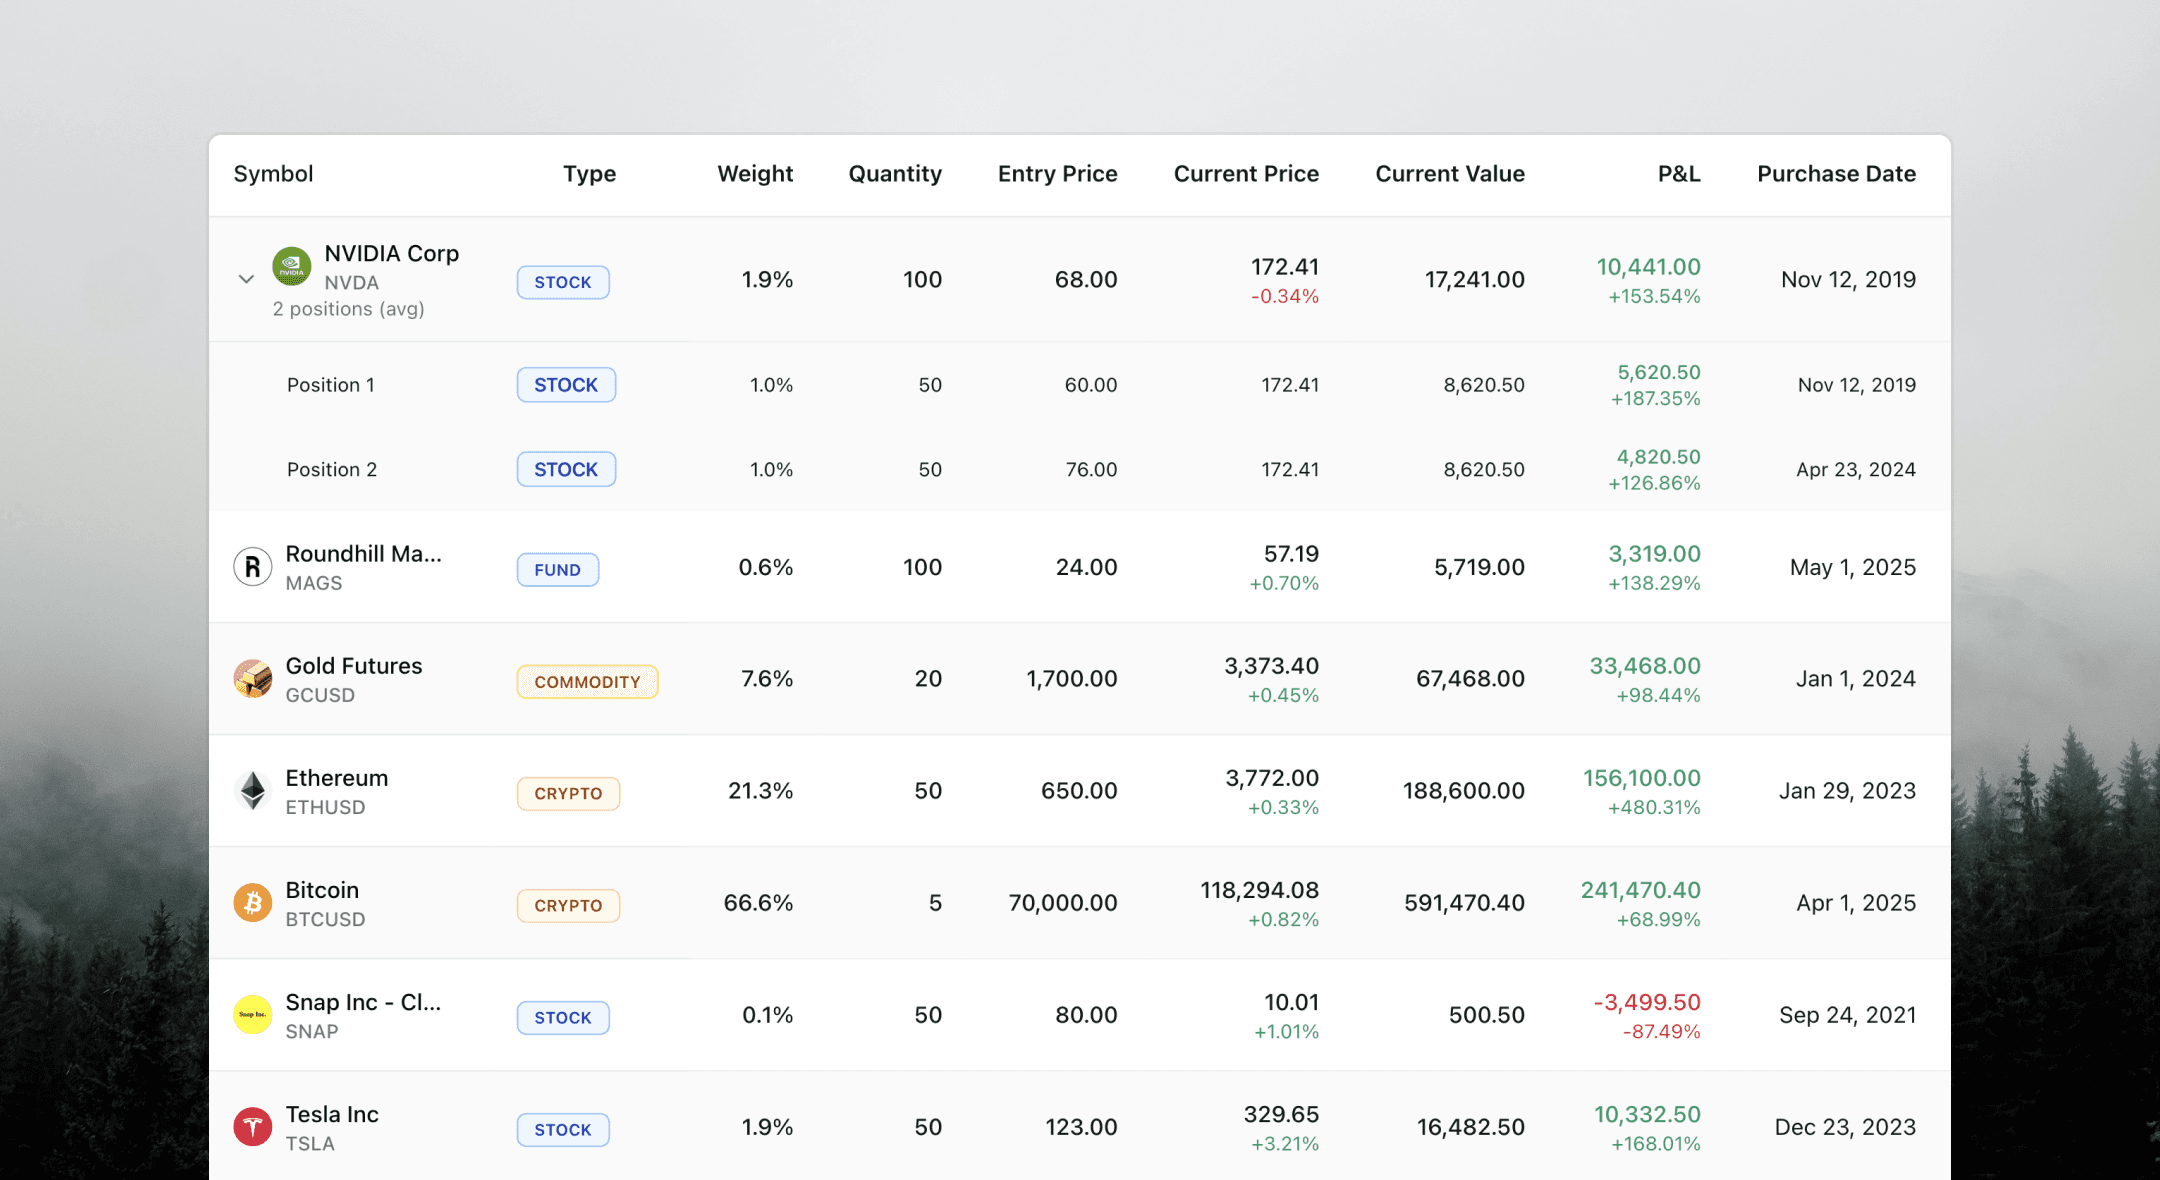
Multi-Asset
Track stocks, crypto, ETFs, and funds in one unified portfolio. Monitor your complete investment universe with real-time performance insights and seamless asset class integration.
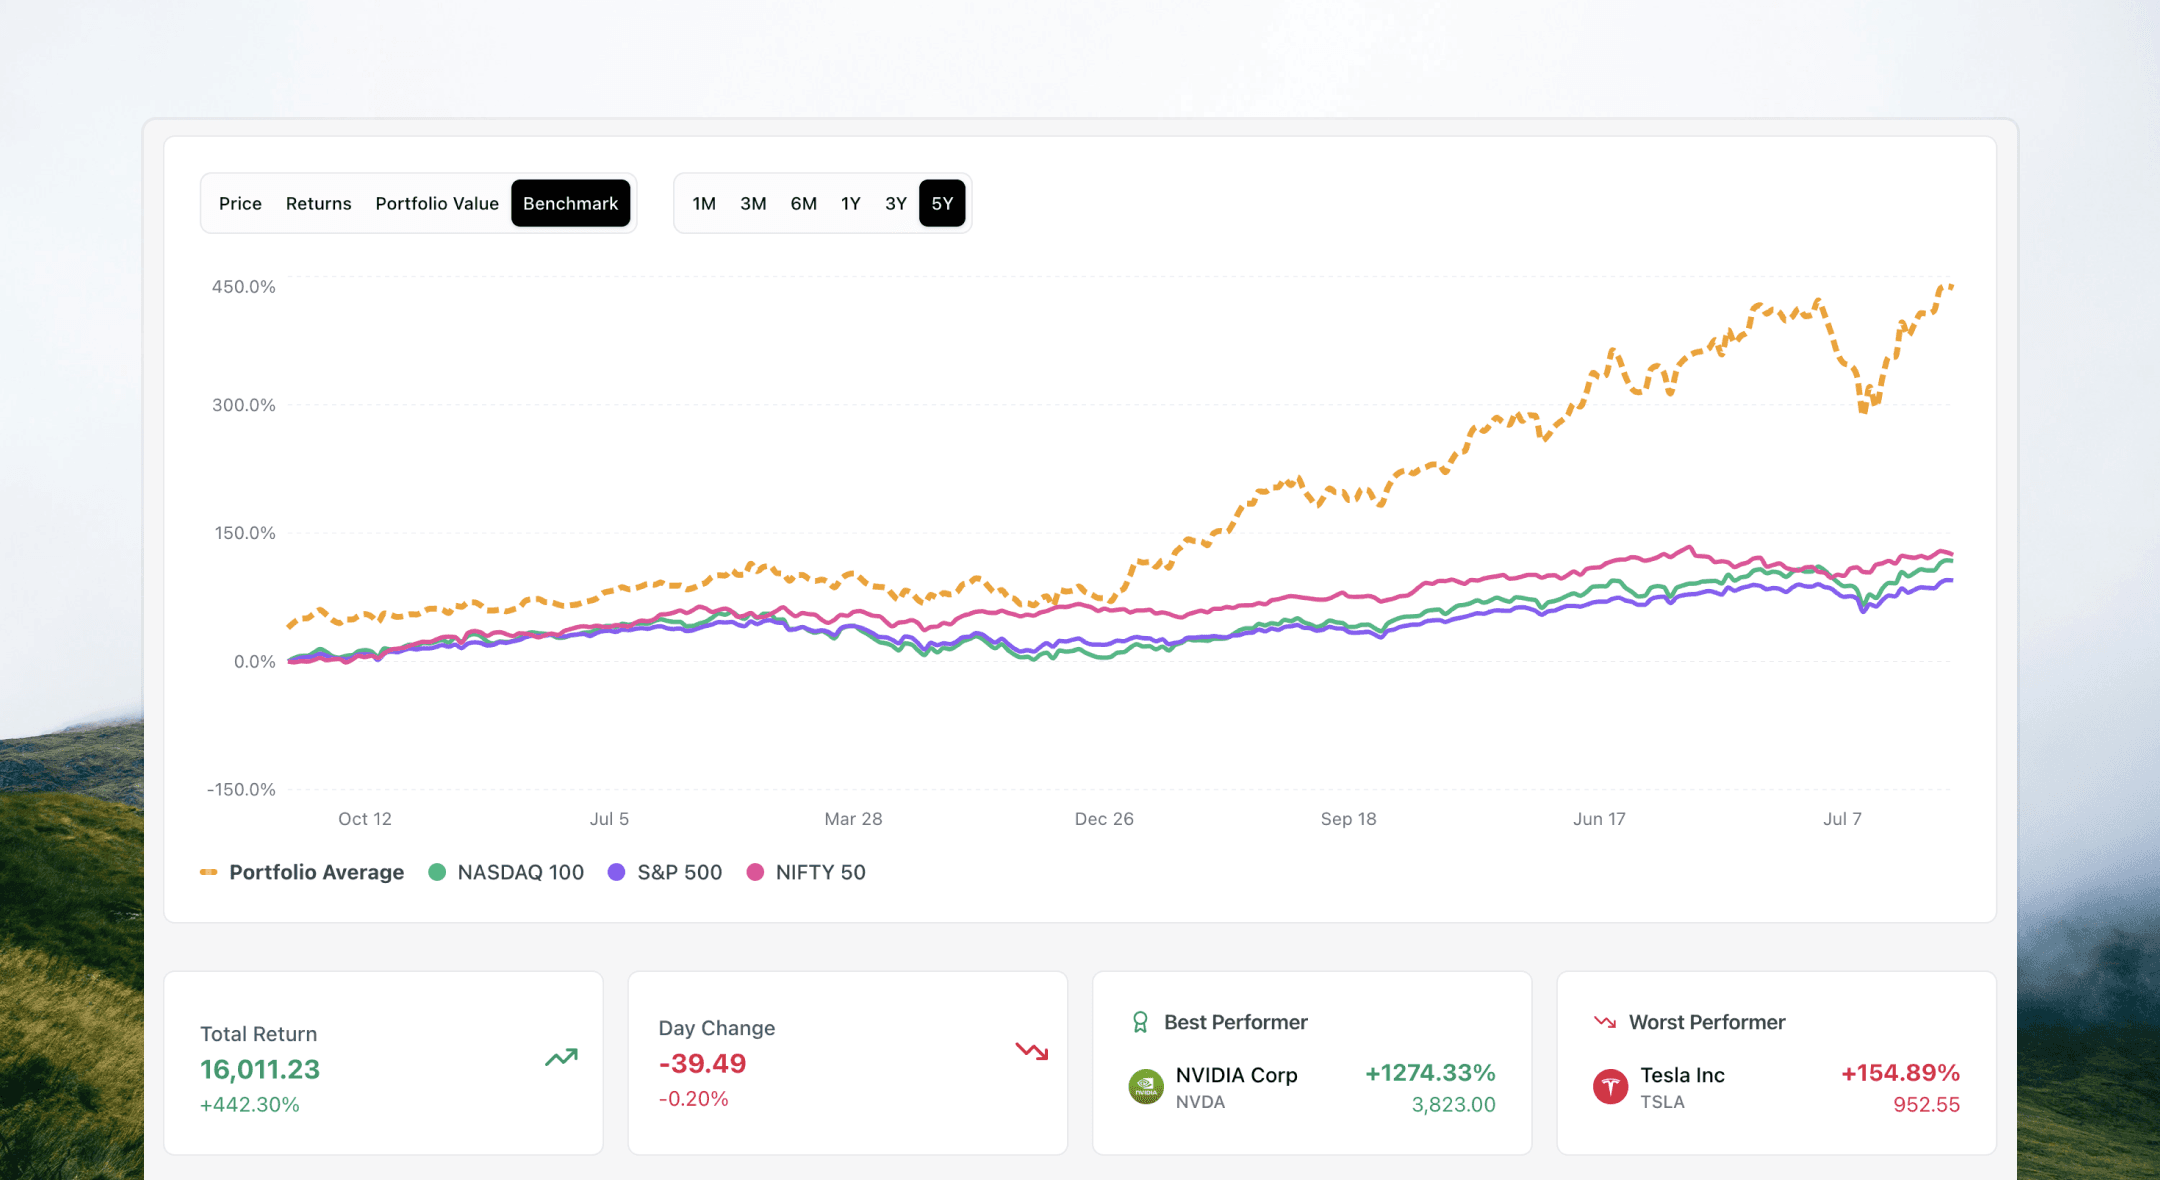
Benchmark
Benchmark portfolio against major indices with instant health scoring. Compare returns to S&P 500, NASDAQ 100, and global markets through performance visualization.
Multiple Position Tracking
Multiple holdings per symbol with individual P&L calculations. Support for different entry prices and dates, with automated averaging and weighted return insights.
Monitoring
24/7 portfolio monitoring with threshold alerts. Customizable notifications for significant movements, tailored to your portfolio size and risk tolerance.
Transform your portfolio tracking
Start your free 7-day, risk-free trial. We'll email you one day before it ends.
FAQ
What assets can I track in Amsflow Portfolio?
Amsflow Portfolio supports multi-asset tracking across stocks, cryptocurrencies, ETFs, and mutual funds in a single unified view. You can monitor your complete investment universe across global markets with real-time performance insights and seamless asset class integration.
How does portfolio performance benchmarking work?
Amsflow Portfolio provides advanced performance analytics with benchmark comparison against major global indices including S&P 500, NASDAQ 100, and NIFTY 50. You get portfolio health scoring through profitability metrics, financial health indicators, and real-time day change tracking with percentage movement visualization.
Can I track multiple positions in the same stock with different entry prices?
Yes, Amsflow Portfolio supports multiple position holdings for the same symbol/ticker with different entry prices and purchase dates. Each position is tracked individually with separate P&L calculations, plus automated position averaging and weighted return calculations across multiple entries.
How do portfolio alerts and monitoring work?
Amsflow Portfolio provides 24/7 portfolio monitoring with customizable threshold-based alerts for significant changes. You can set Portfolio Monitor notifications for major P&L movements beyond user-defined thresholds, with configurable alert sensitivity tailored to different portfolio sizes and risk tolerances.
What team collaboration features are available for portfolios?
Team plan customers get shared portfolio access enabling collaborative investment management. Features include team-wide portfolio visibility with shared performance metrics, holdings analysis, and collaborative decision-making through unified portfolio insights and team discussions.
How does the Portfolio Digest feature work?
Portfolio Digest provides opt-in performance summary emails with comprehensive performance summaries and holdings analysis. You can choose flexible digest frequency options including daily, weekly, or monthly delivery schedules, featuring holdings performance breakdown with key changes and notable movements.
What financial metrics are integrated into portfolio analysis?
Amsflow Portfolio integrates quarterly and annual financial metrics for all portfolio holdings, including revenue, net income, and profitability analysis for individual positions. You get P/E ratios, ROE, and margin analysis across portfolio companies, plus fundamental analysis integration with portfolio weighting considerations for informed decision-making.
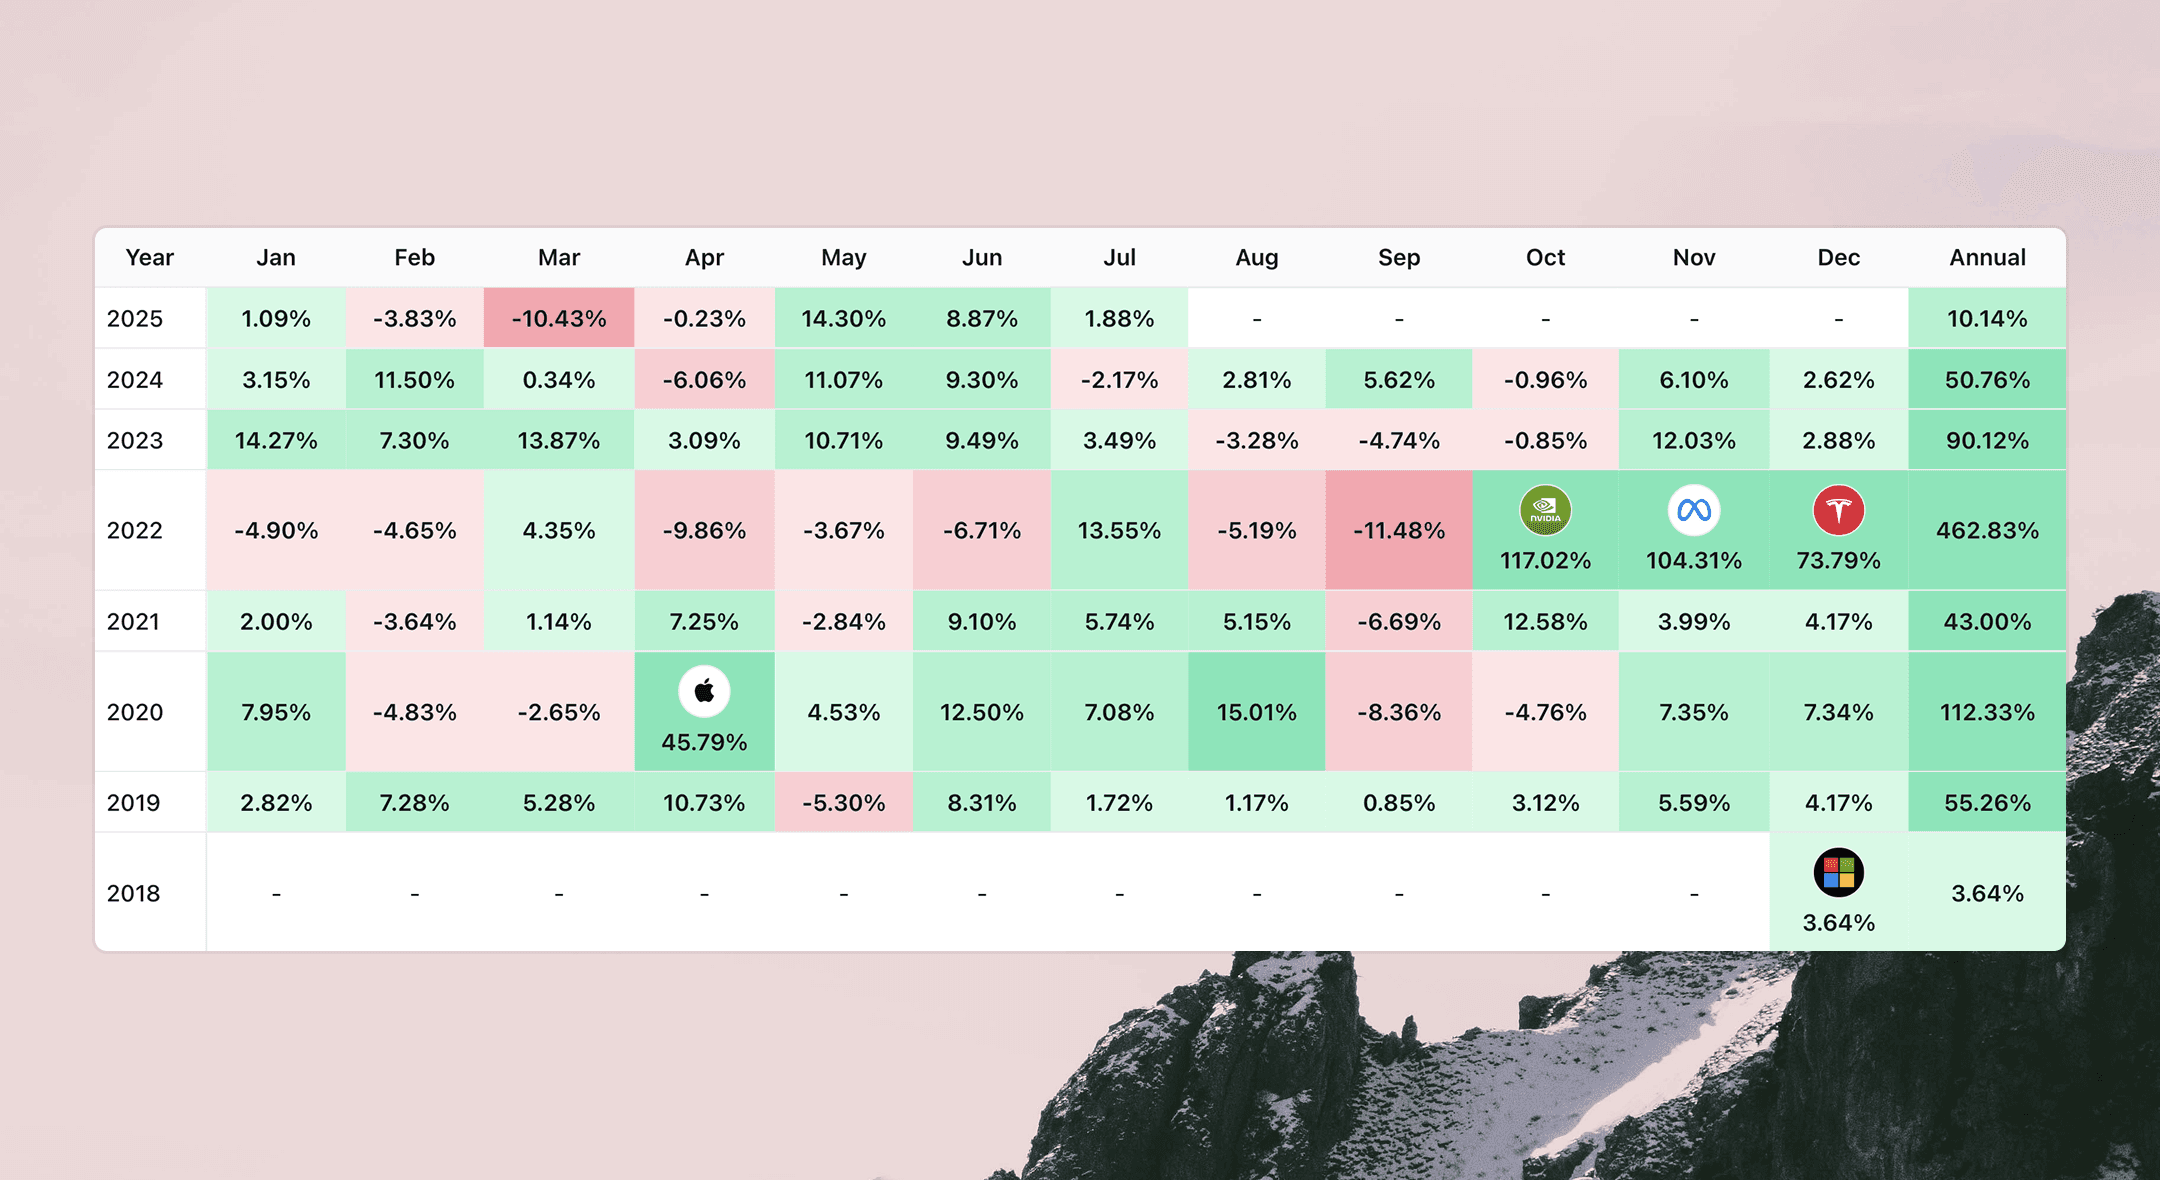
How does the Portfolio Returns Heat Map work?
The Portfolio Returns Heat Map provides month-over-month portfolio performance visualization in an intuitive color-coded matrix. This powerful visualization tool transforms your historical performance data into an easy-to-read format, helping you quickly identify performance patterns, seasonal trends, and portfolio behavior over time.
Amsflow is for research and educational purposes only. Not financial advice. Amsflow doesn't recommend specific investments or securities. Market participation involves substantial risk, including potential loss of principal. Past performance doesn't guarantee future results. Amsflow doesn't offer fund/portfolio management services in any jurisdiction. Amsflow is a data platform only. Amsflow doesn't provide investment tips. Be cautious of imposters claiming to be Amsflow.


