Charting
Professional technical analysis for informed decision-making. Transform how you analyze market movements, identify patterns, and understand price action across global markets. Chart stocks, crypto, ETFs, and funds with institutional-grade tools and real-time market data with Amsflow Charting.


Advanced Charting suite engineered for precision analysis
Move beyond basic charting tools with Amsflow Charting's professional-grade capabilities and customizable layouts. Analyze price action, deploy technical indicators, and make informed decisions with real-time data across all major asset classes.
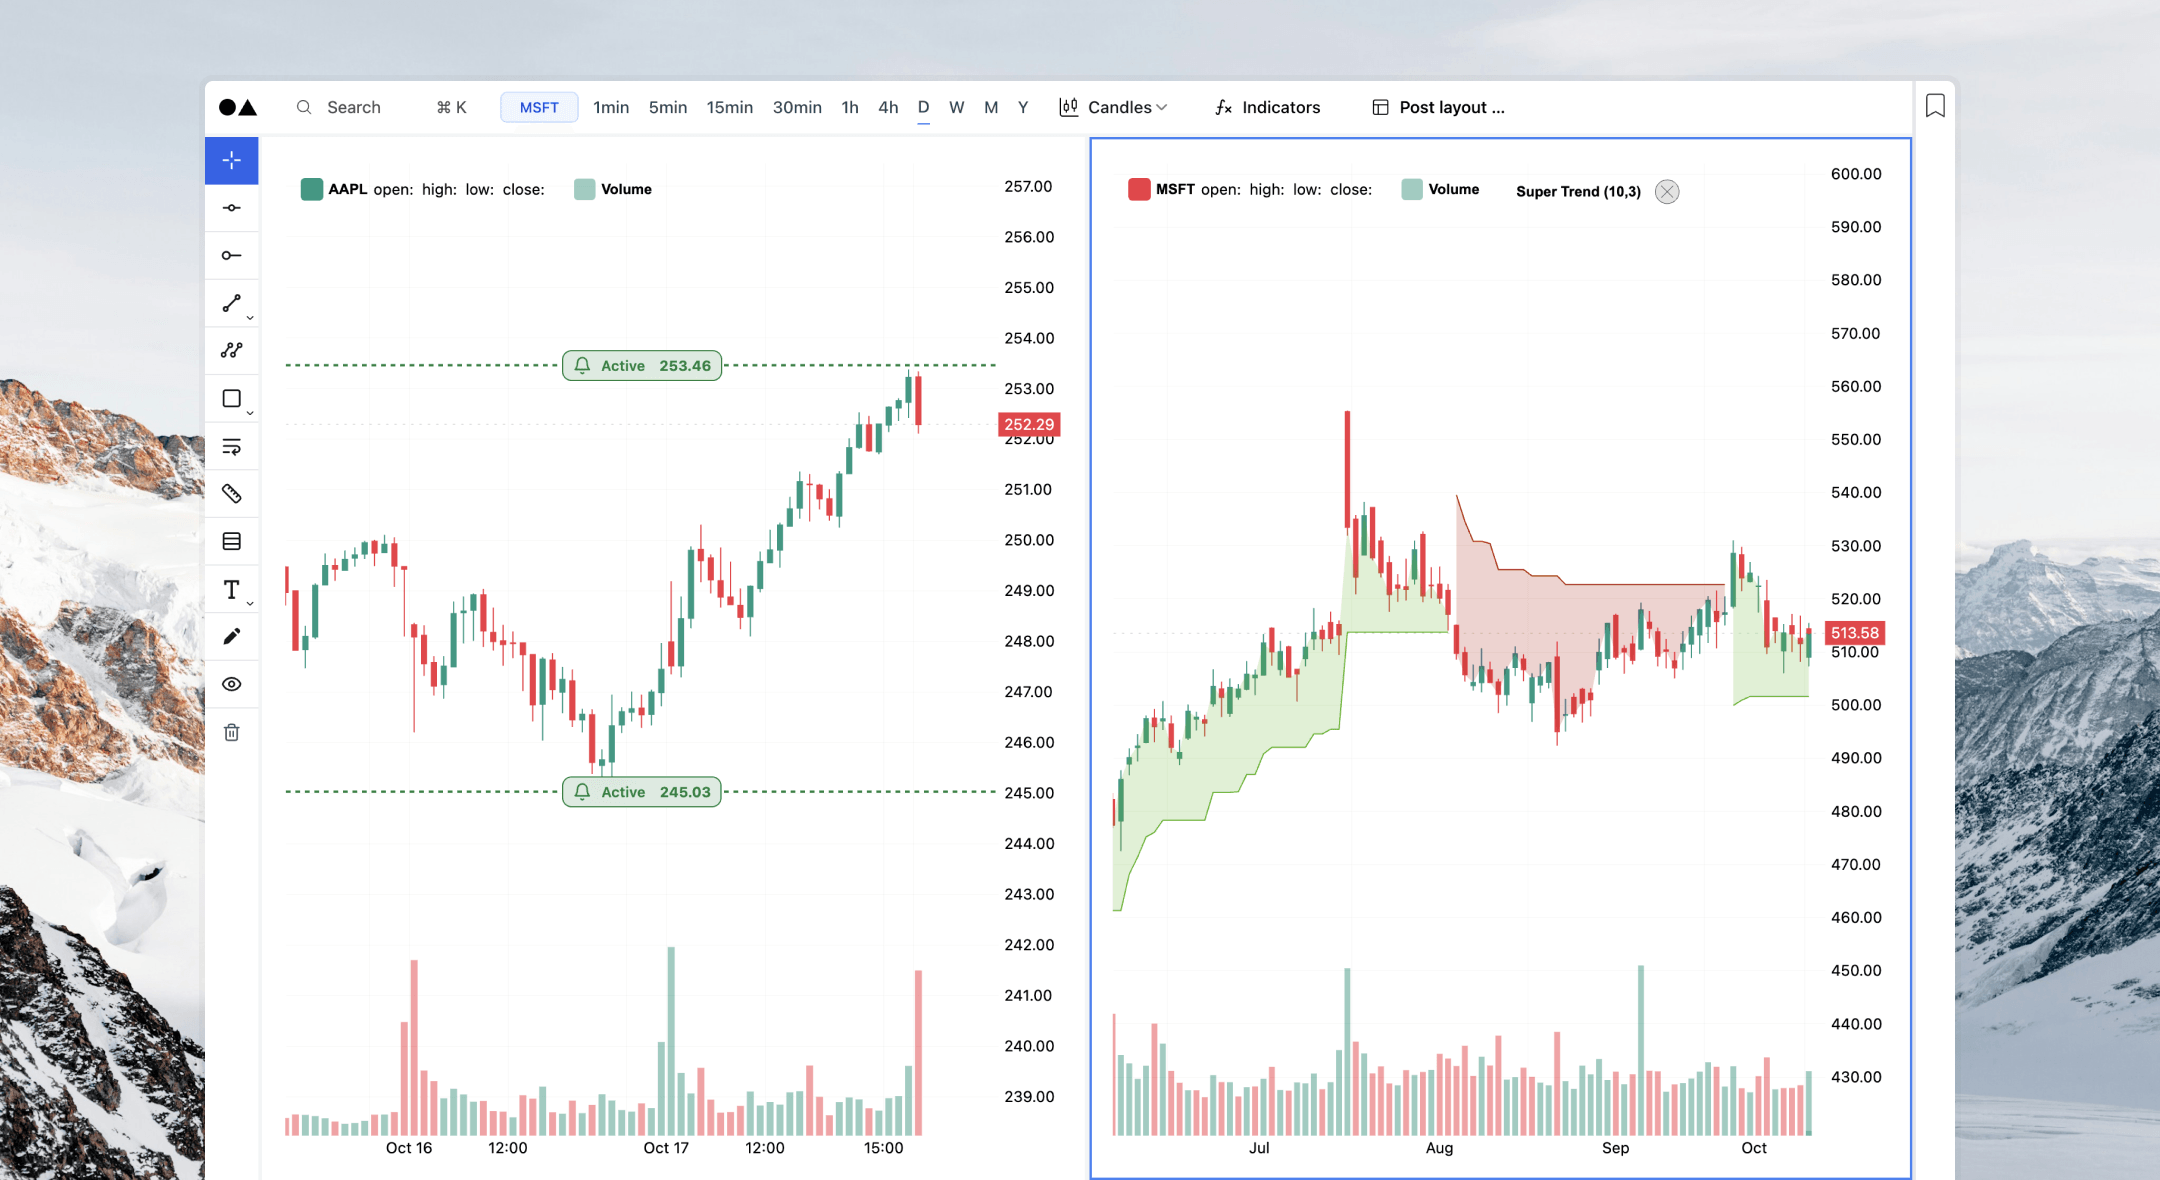
Multi-Panel Chart Layouts
View multiple charts simultaneously with customizable grid configurations. Compare markets, timeframes, and strategies side by side with layouts from two panels to nine-grid displays, each with resizable dimensions for optimal workspace control.
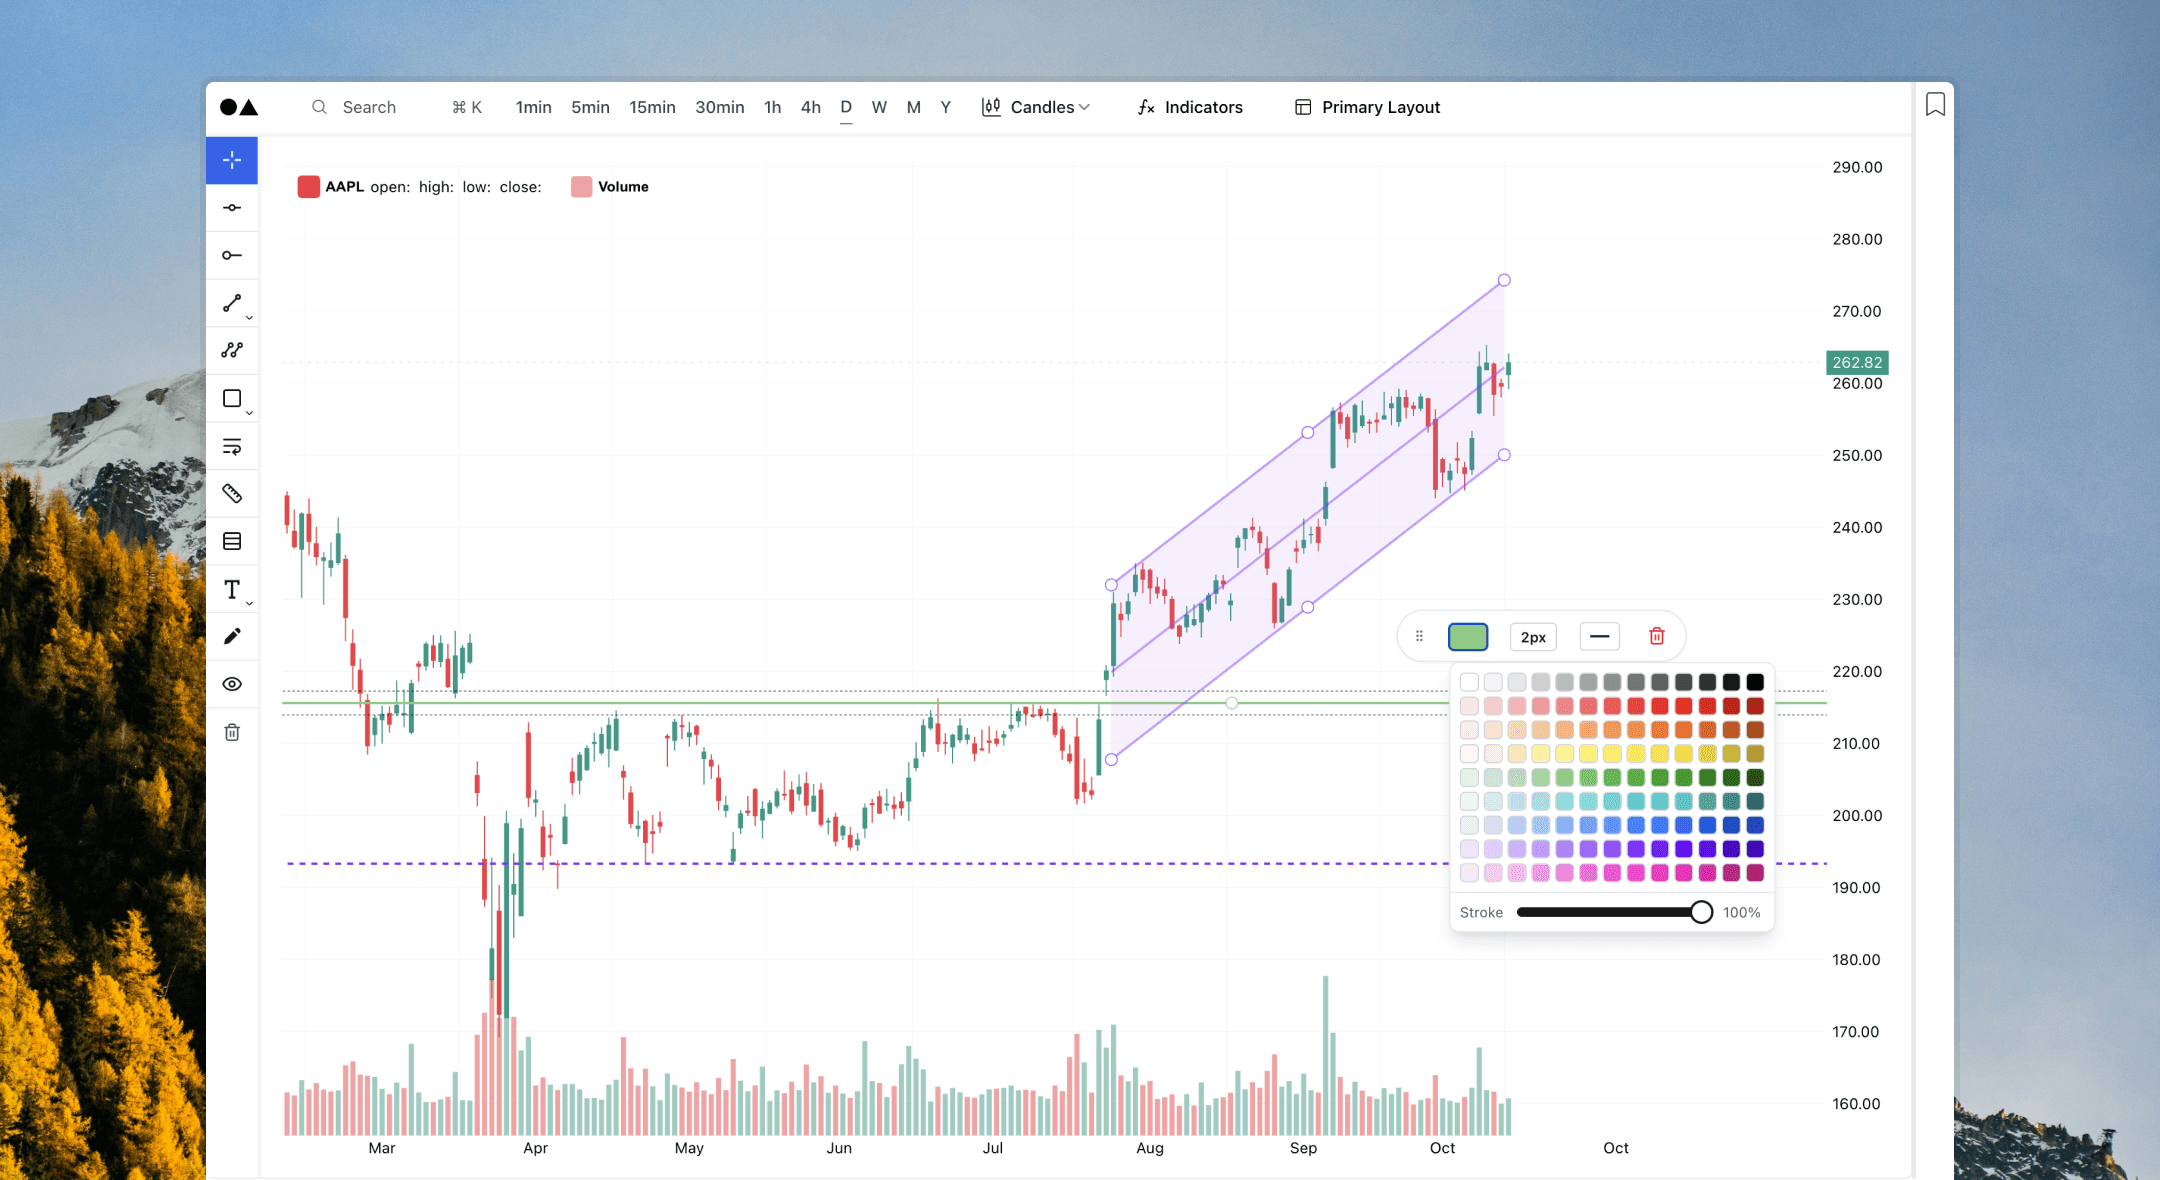
Drawing Tools
Over 18 professional drawing tools from horizontal lines to price measurement for personalized technical analysis. All indicators and drawings automatically save at the symbol level, preserving your work exactly as you left it.
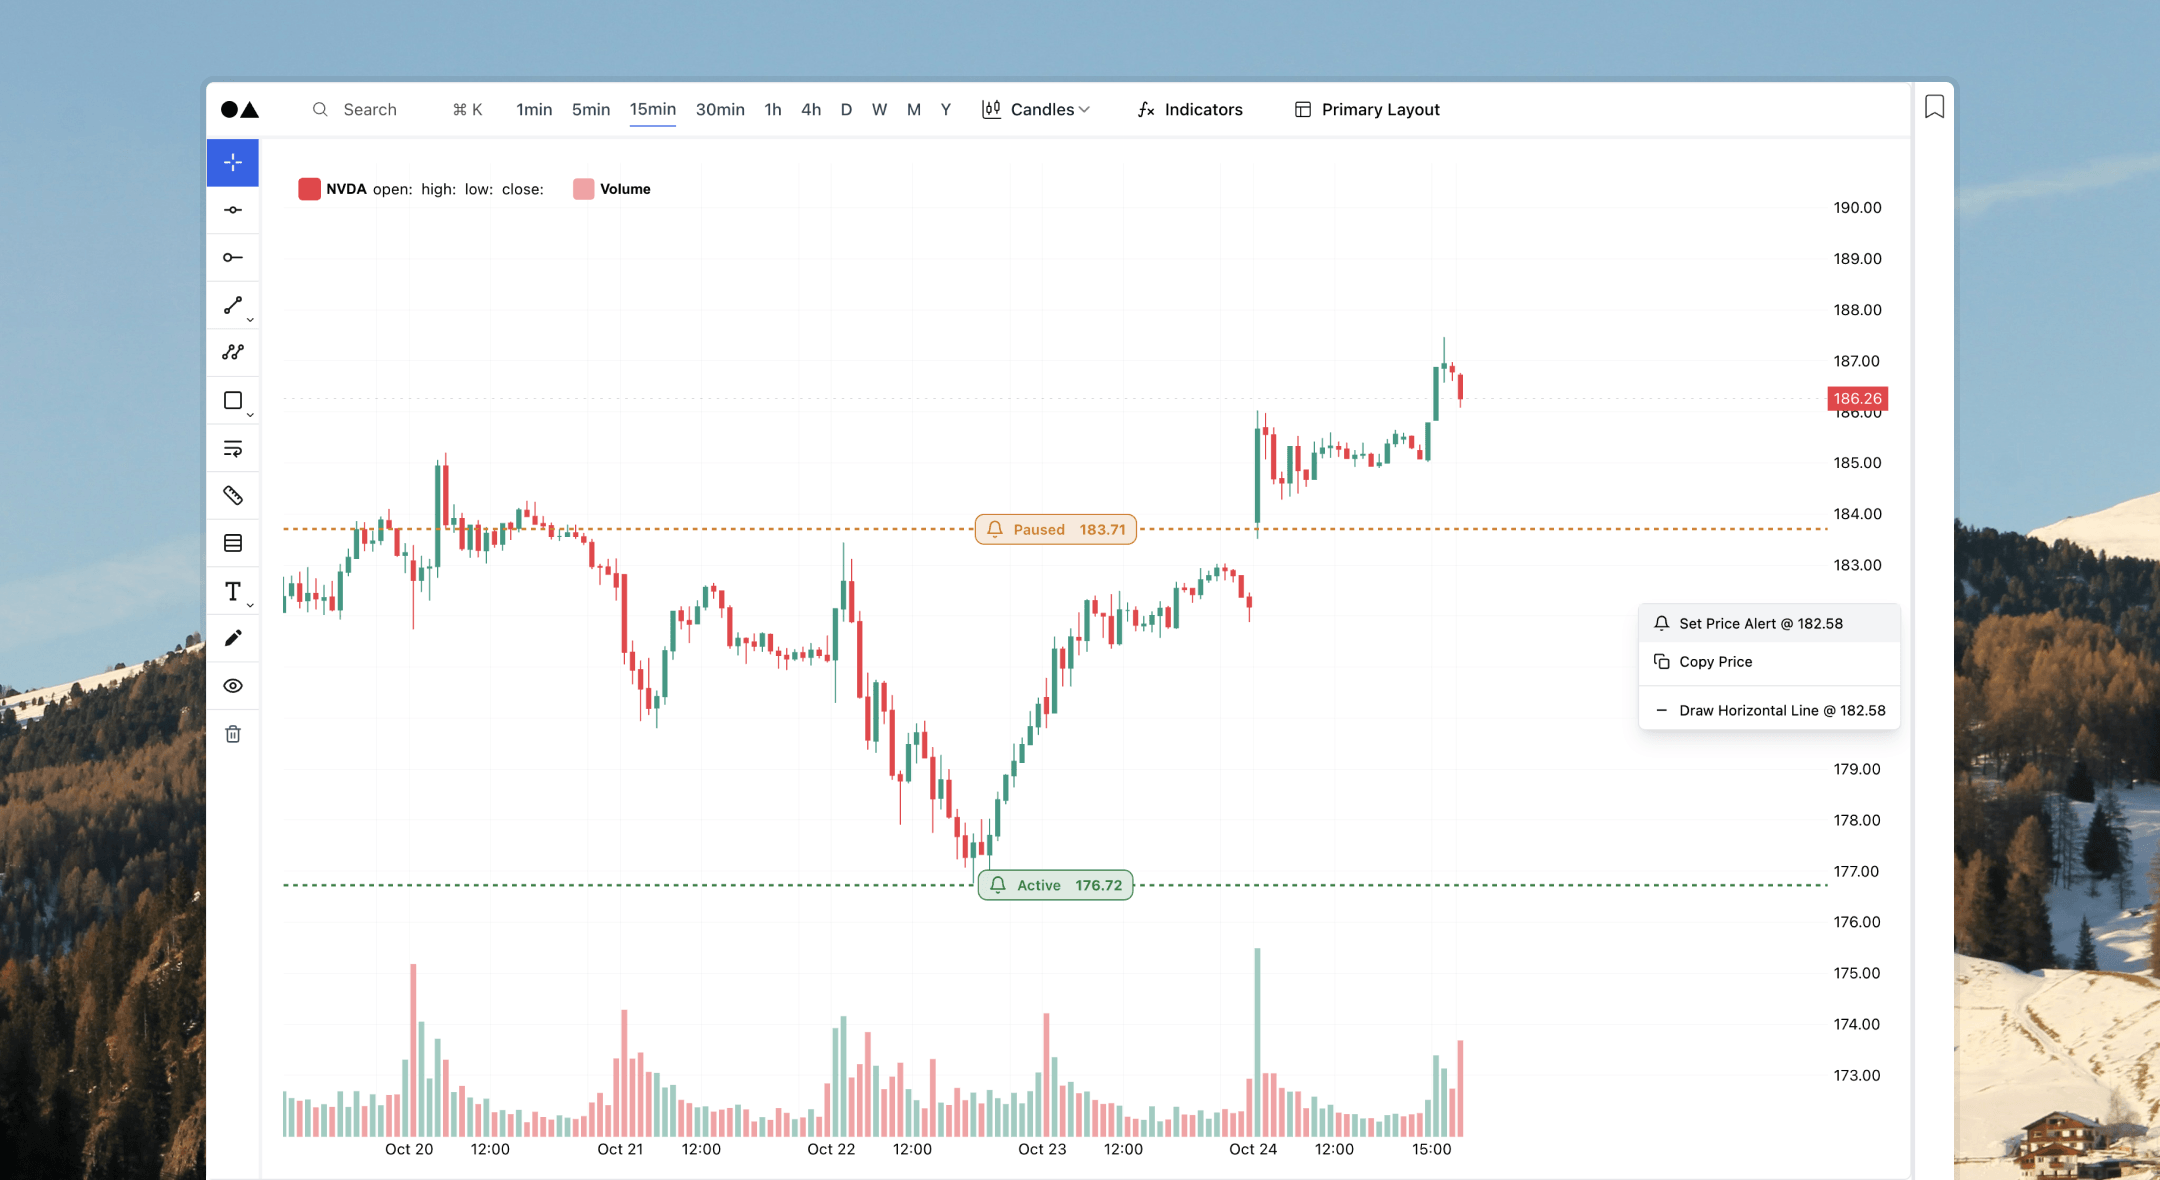
In-line Chart Alerts
Create and manage price alerts directly within your charts with instant visual feedback. Adjust trigger values by simply dragging alert lines to new levels for effortless threshold management.
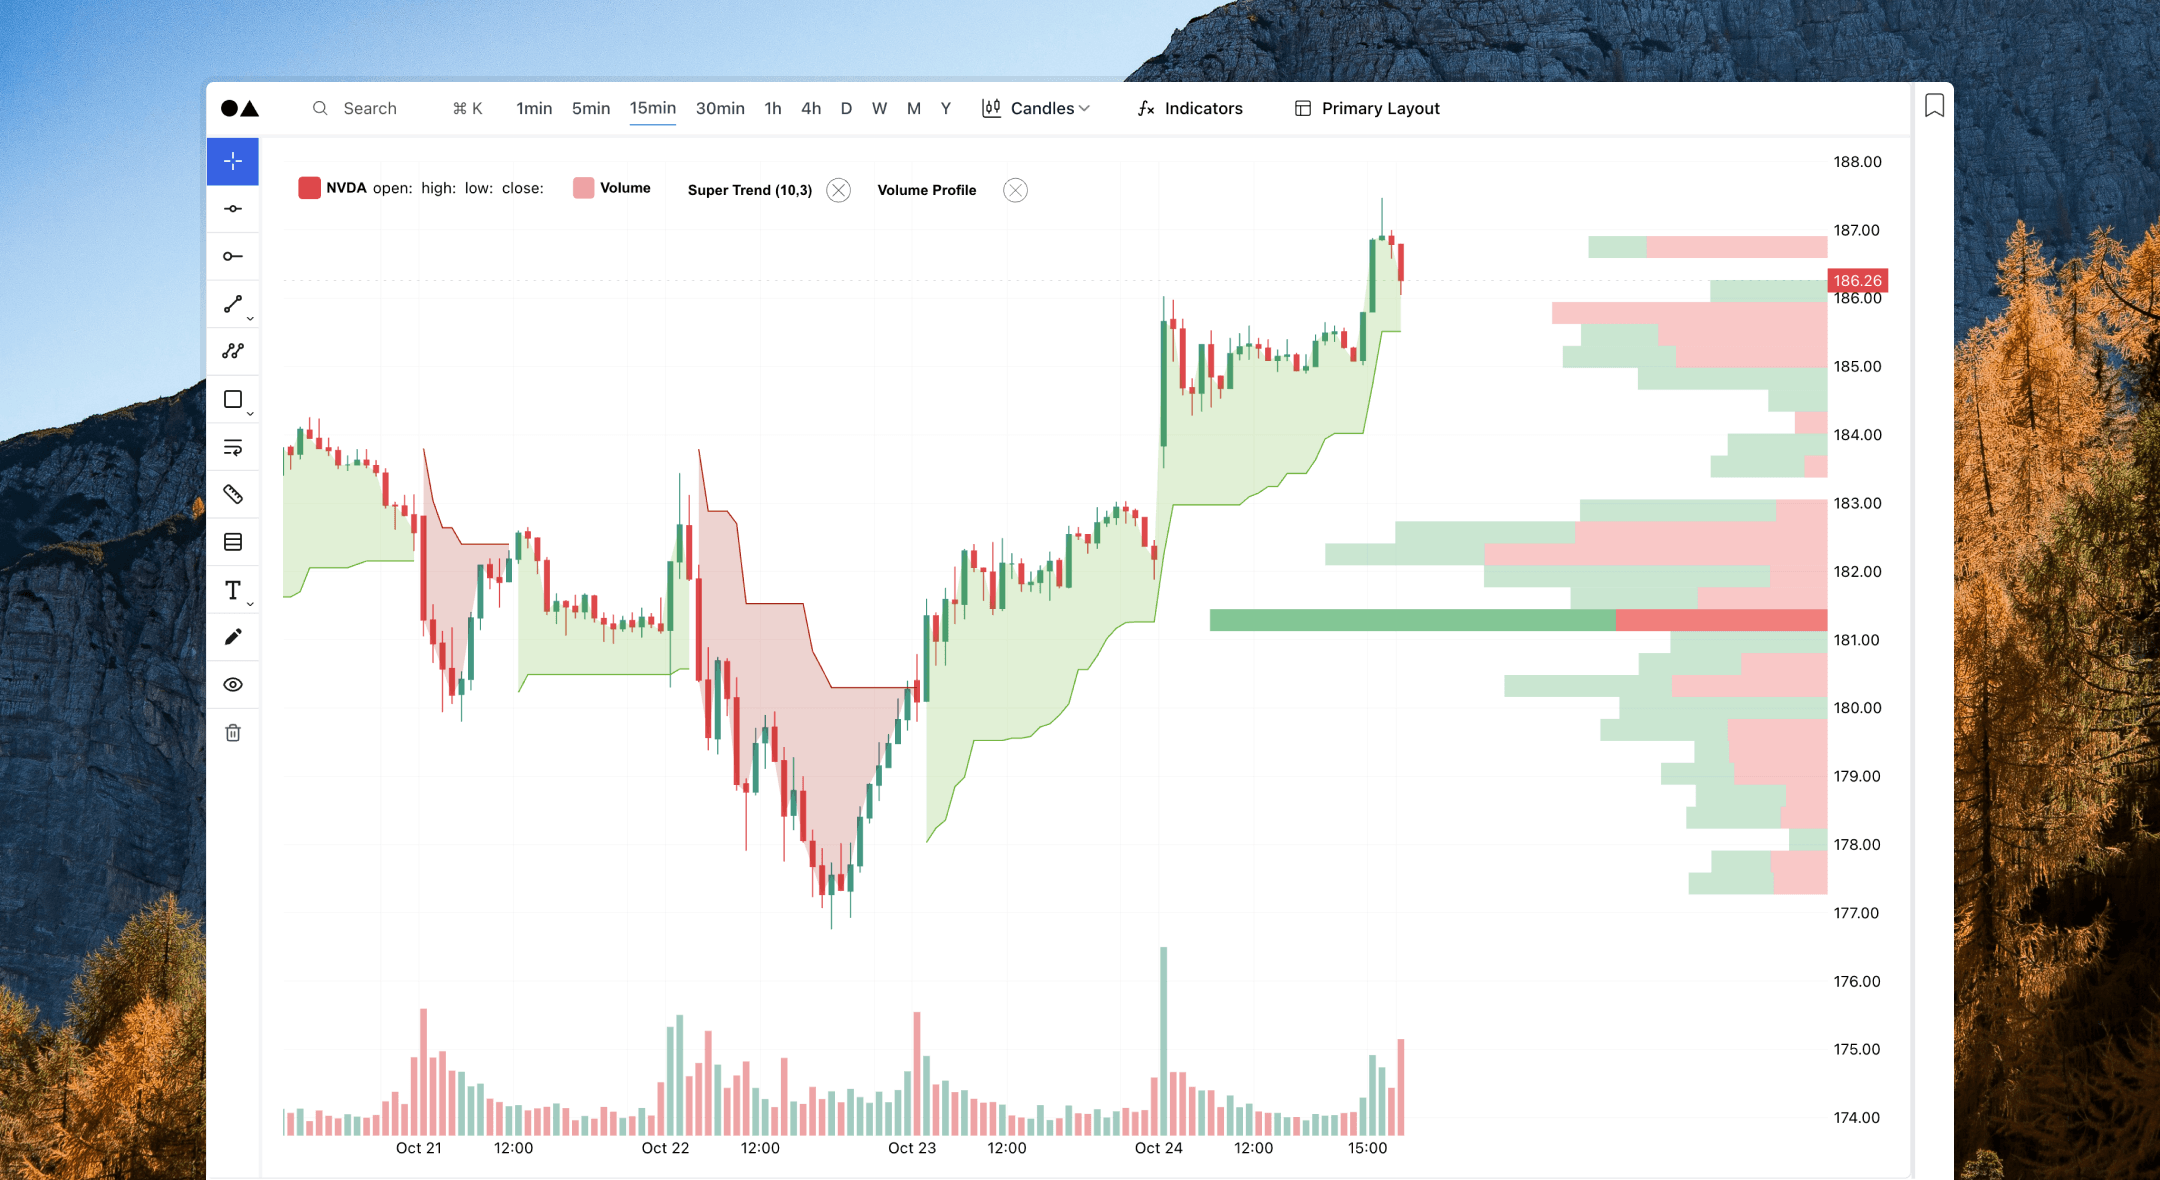
Technical indicators
Apply comprehensive technical analysis with industry-standard indicators integrated seamlessly into your charting workflow.
Plus, all Amsflow has to offer
From comprehensive research to AI-powered insights, Amsflow brings you everything needed for modern investment analysis. X-Ray and Lisa AI assist your workflow with intelligent tools that keep you ahead of market opportunities. One unified platform where you work smarter with cutting-edge analysis.
Core
Intelligence
Market Data
Alerts
Teams
Charting
Calendars
Transform your charting experience
Start your free 7-day, risk-free trial. We'll email you one day before it ends.
FAQ
What drawing tools are available in Amsflow Charting?
Amsflow Charting offers over 18 professional drawing tools including horizontal lines, trend lines, price measurement tools, and support and resistance markers. All drawing items are automatically saved and remain persistent at the symbol level, ensuring your technical analysis is preserved exactly as you left it.
How do in-line chart alerts work?
In-line chart alerts allow you to create and manage price alerts directly within your charts. You can set trigger values and adjust them instantly by dragging alert lines to new price levels. This provides instant visual feedback and effortless threshold management without leaving your charting interface.
What multi-panel chart layouts are supported?
Amsflow Charting supports five customizable layout options: 1x1 (Two Panels), 1x2 (One Left, Two Right), 1x3 (Three Columns), 2x2 (Four Grid), and 3x3 (Nine Grid). Each panel can be resized for optimal workspace configuration, allowing you to compare markets, timeframes, and strategies side by side with different chart styles.
Can I switch symbols quickly across multi-panel layouts?
Yes, you can quickly replace tickers or symbols across all panels directly from your watchlist or using chart search shortcuts (Mac: CMD + K or Windows: CTRL + K). This allows for rapid market analysis and comparison without manually updating each panel individually.
Are charting features available on all subscription plans?
Drawing Tools, In-line Chart Alerts, and Multi-Panel Chart Layouts are available across all plans for Amsflow customers without any plan changes or license upgrades required. This ensures all users have access to professional-grade technical analysis capabilities regardless of their subscription tier.
What markets and asset classes can I chart?
Amsflow Charting supports technical analysis across stocks, cryptocurrencies, ETFs, and mutual funds from global markets. You can apply drawing tools, indicators, and alerts to any supported symbol with real-time price data and comprehensive historical charting capabilities.

Amsflow is for research and educational purposes only. Not financial advice. Amsflow doesn't recommend specific investments or securities. Market participation involves substantial risk, including potential loss of principal. Past performance doesn't guarantee future results. Amsflow doesn't offer fund/portfolio management services in any jurisdiction. Amsflow is a data platform only. Amsflow doesn't provide investment tips. Be cautious of imposters claiming to be Amsflow.