

Rotation
Global sector and industry rotation across 14 markets.
See where capital is moving with relative rotation, a cross-market matrix, and valuation versus momentum.
- 01
Performance Ribbon
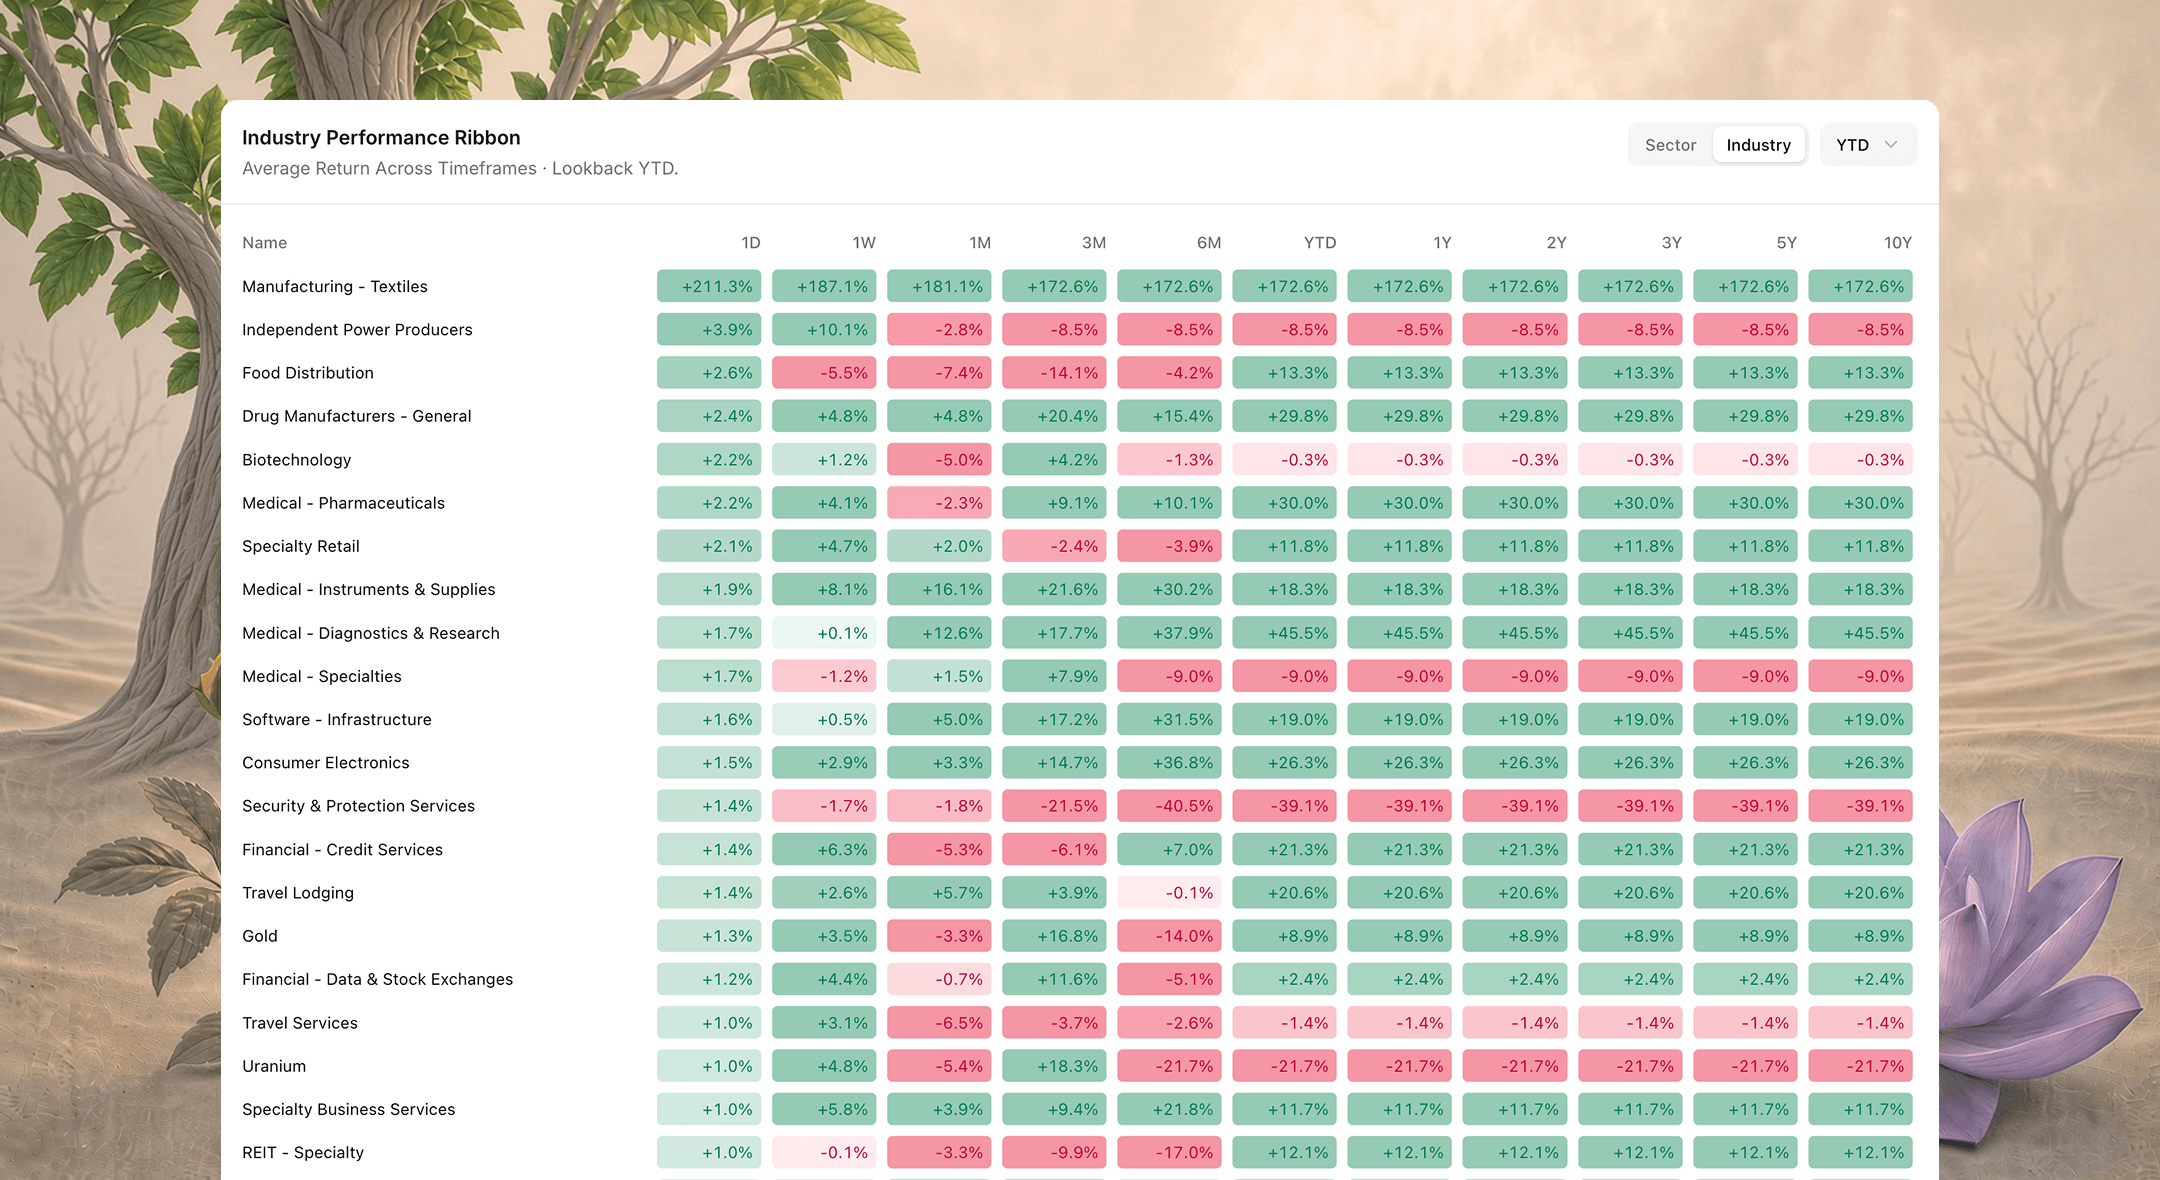
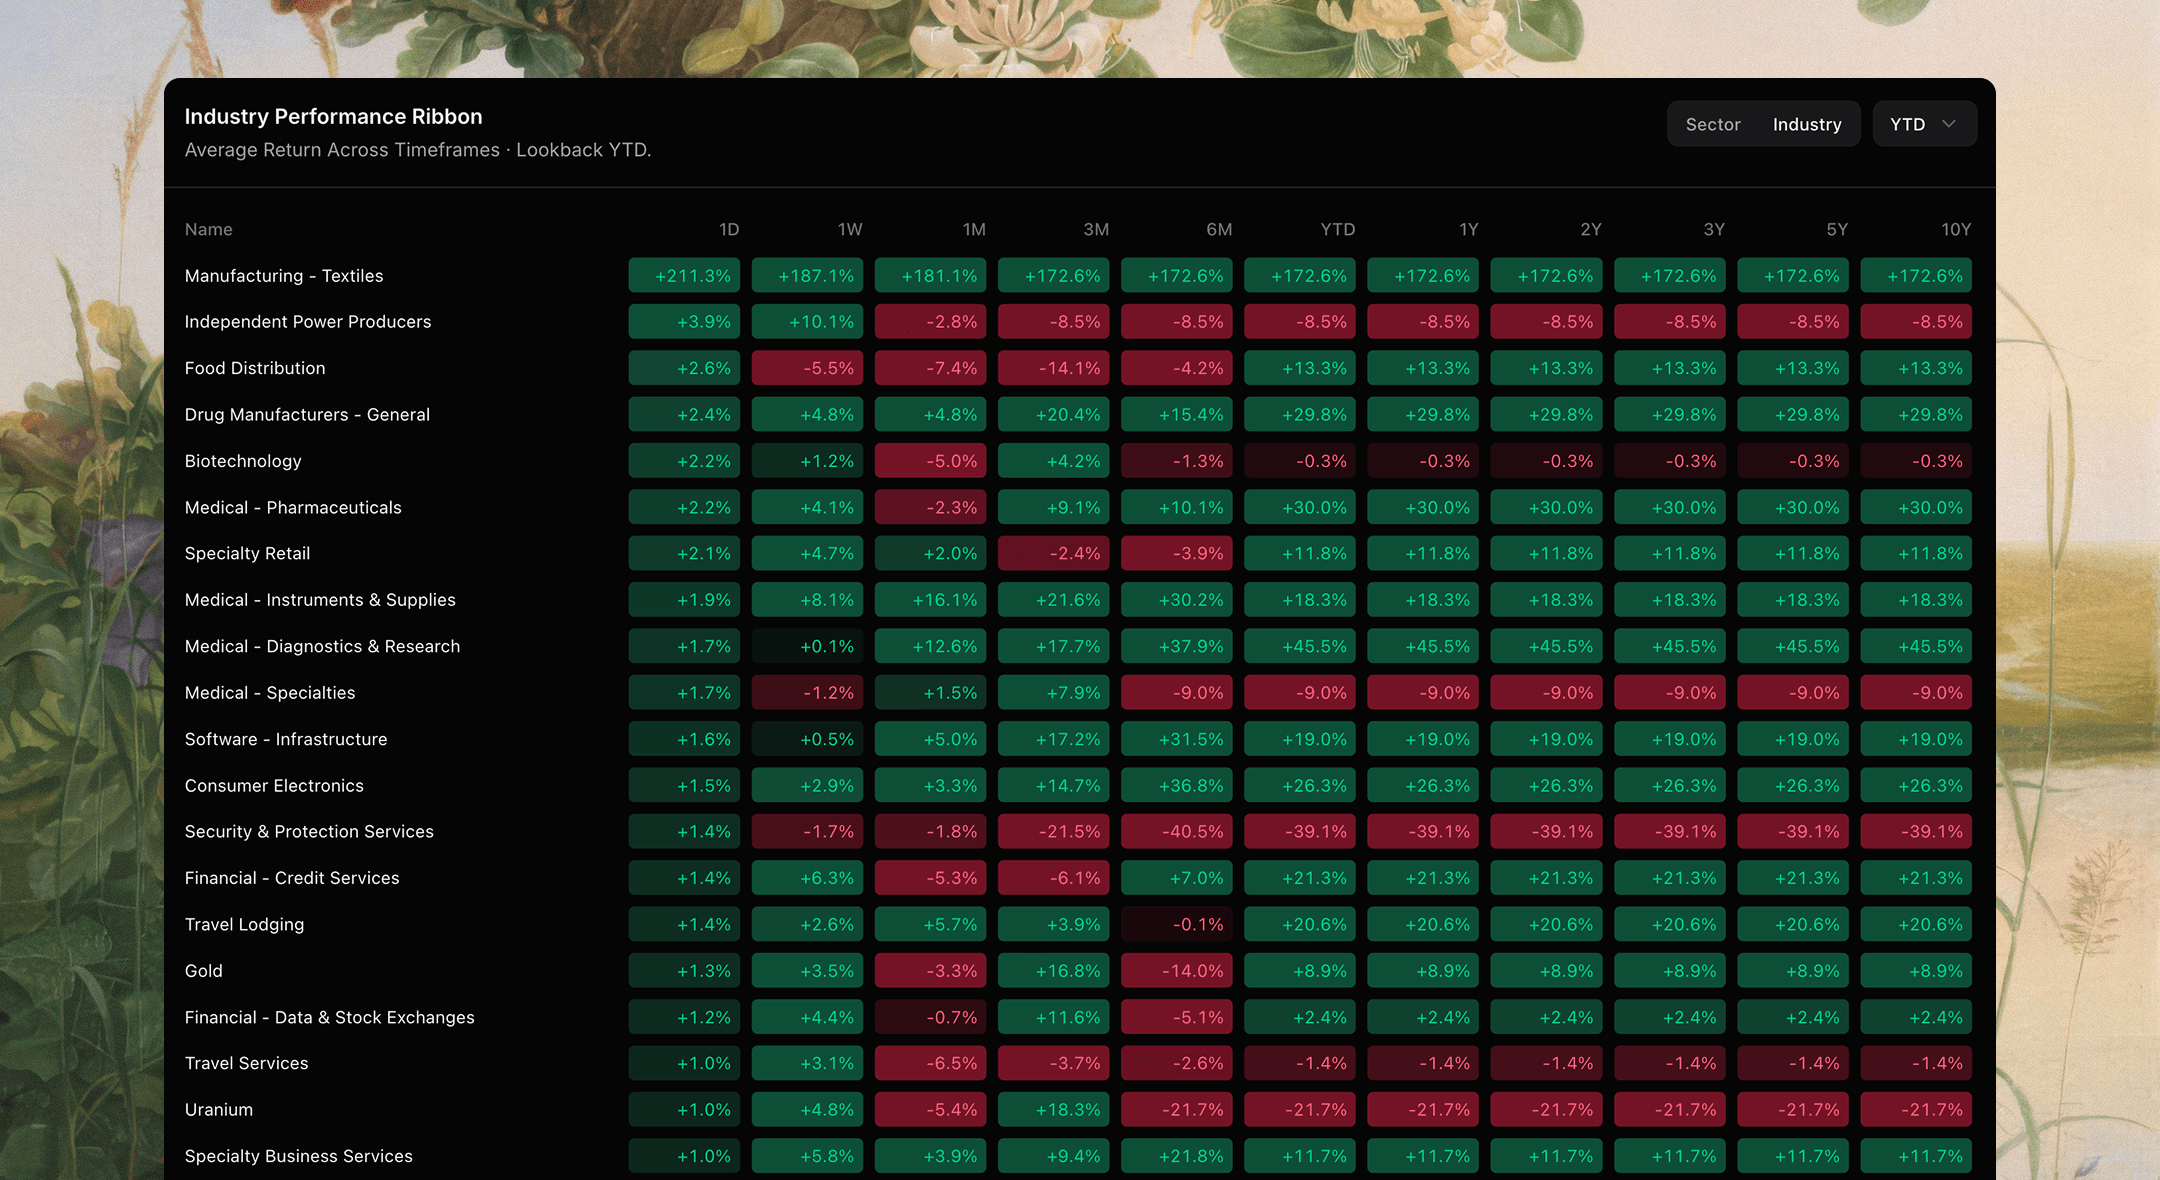
Read average return for every sector or industry across timeframes from 1D through long lookbacks, in one ribbon. Cumulative performance starts each group at 100 at the opening of the window, so leadership shows up as a path, and the top and bottom industries stay visible when you zoom to industry grain.
- 1D to 10Y for sectors
- Cumulative paths from 100
- Top and bottom industries
- Zoom to industry grain
- 02
Relative Rotation
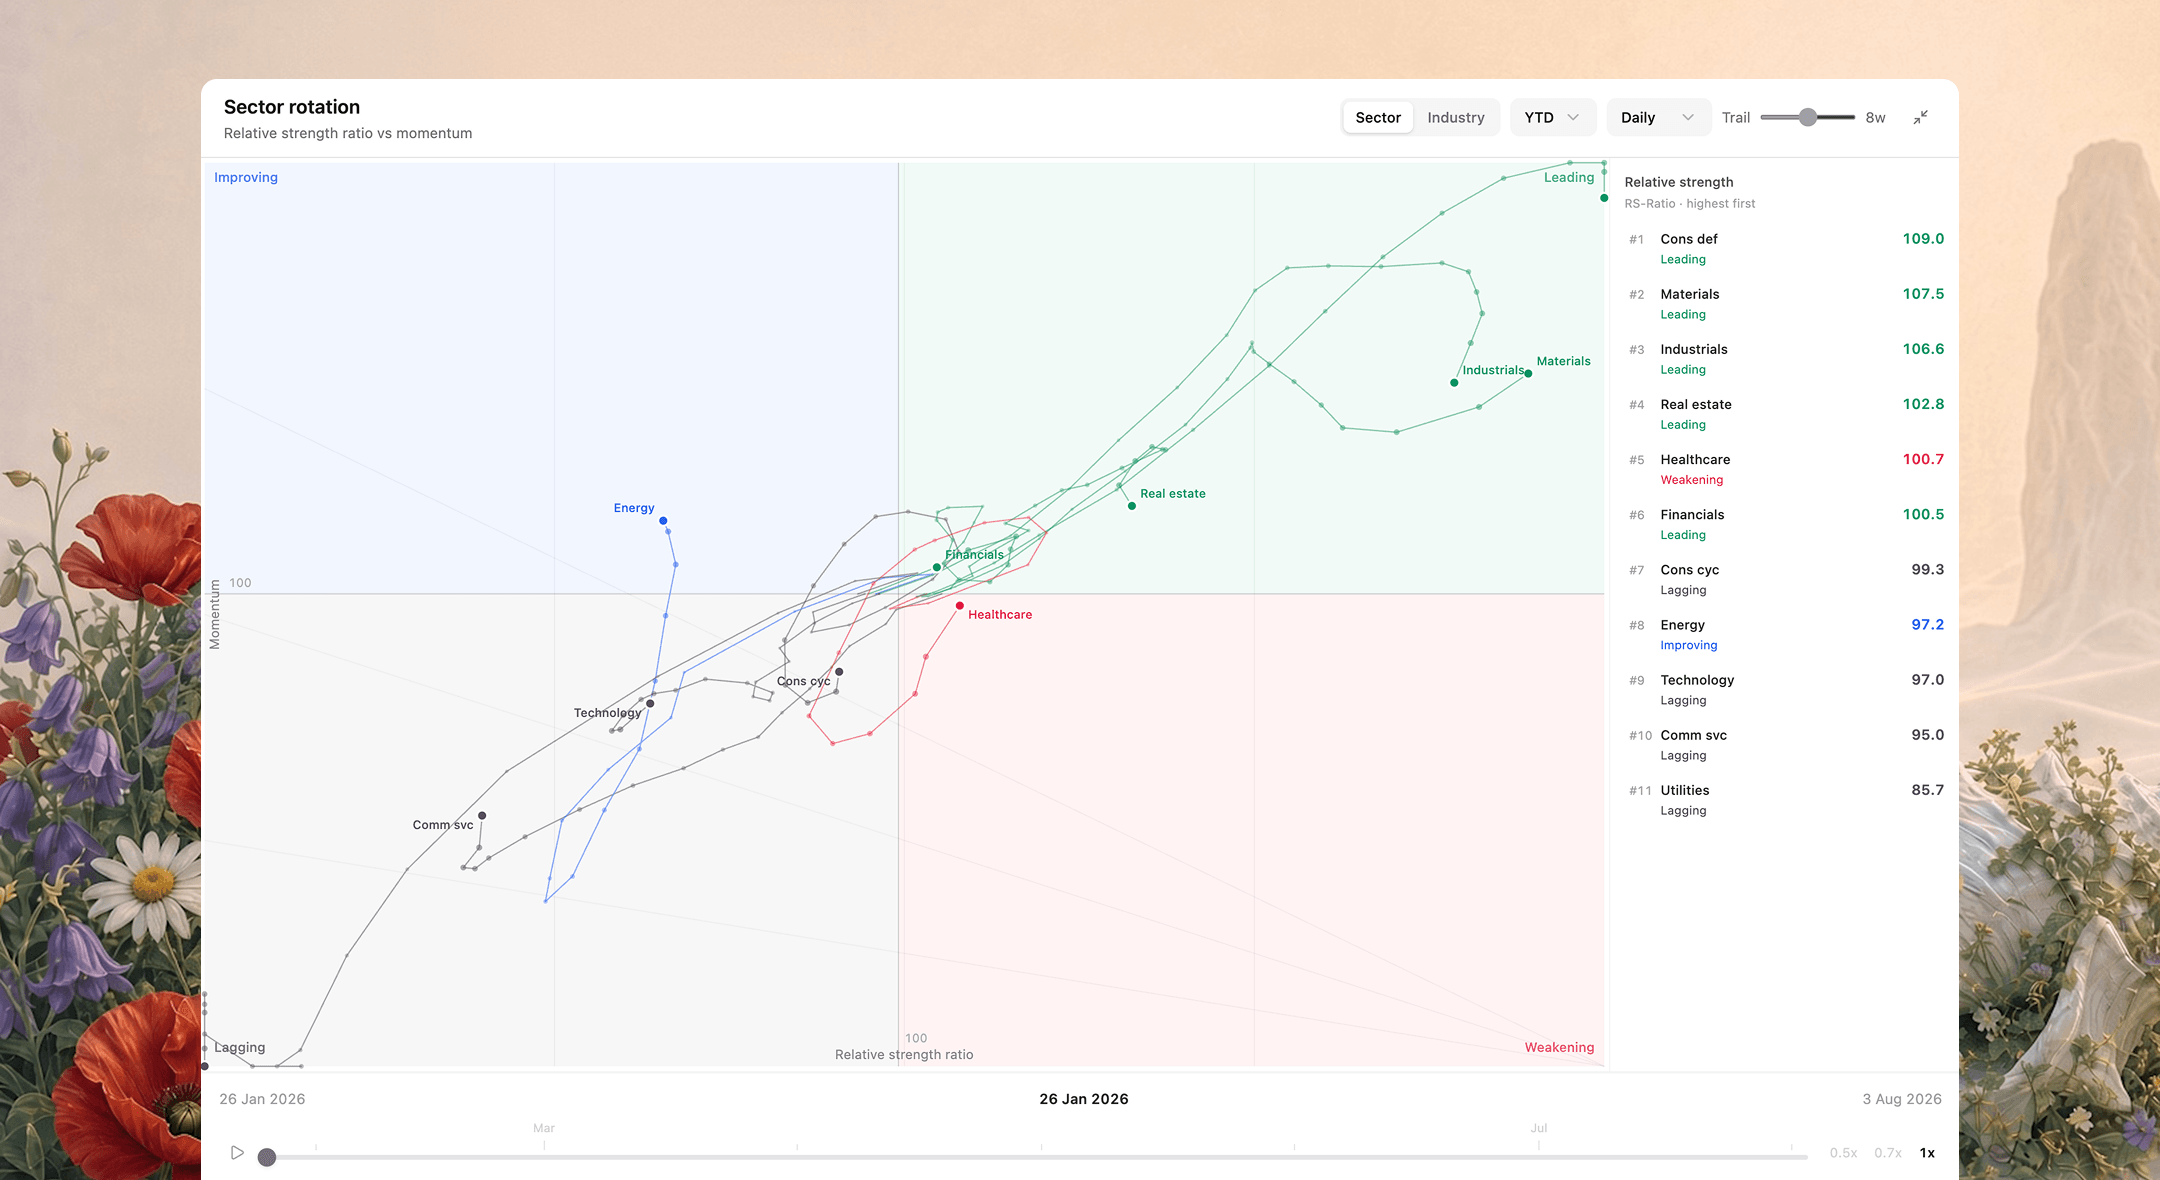
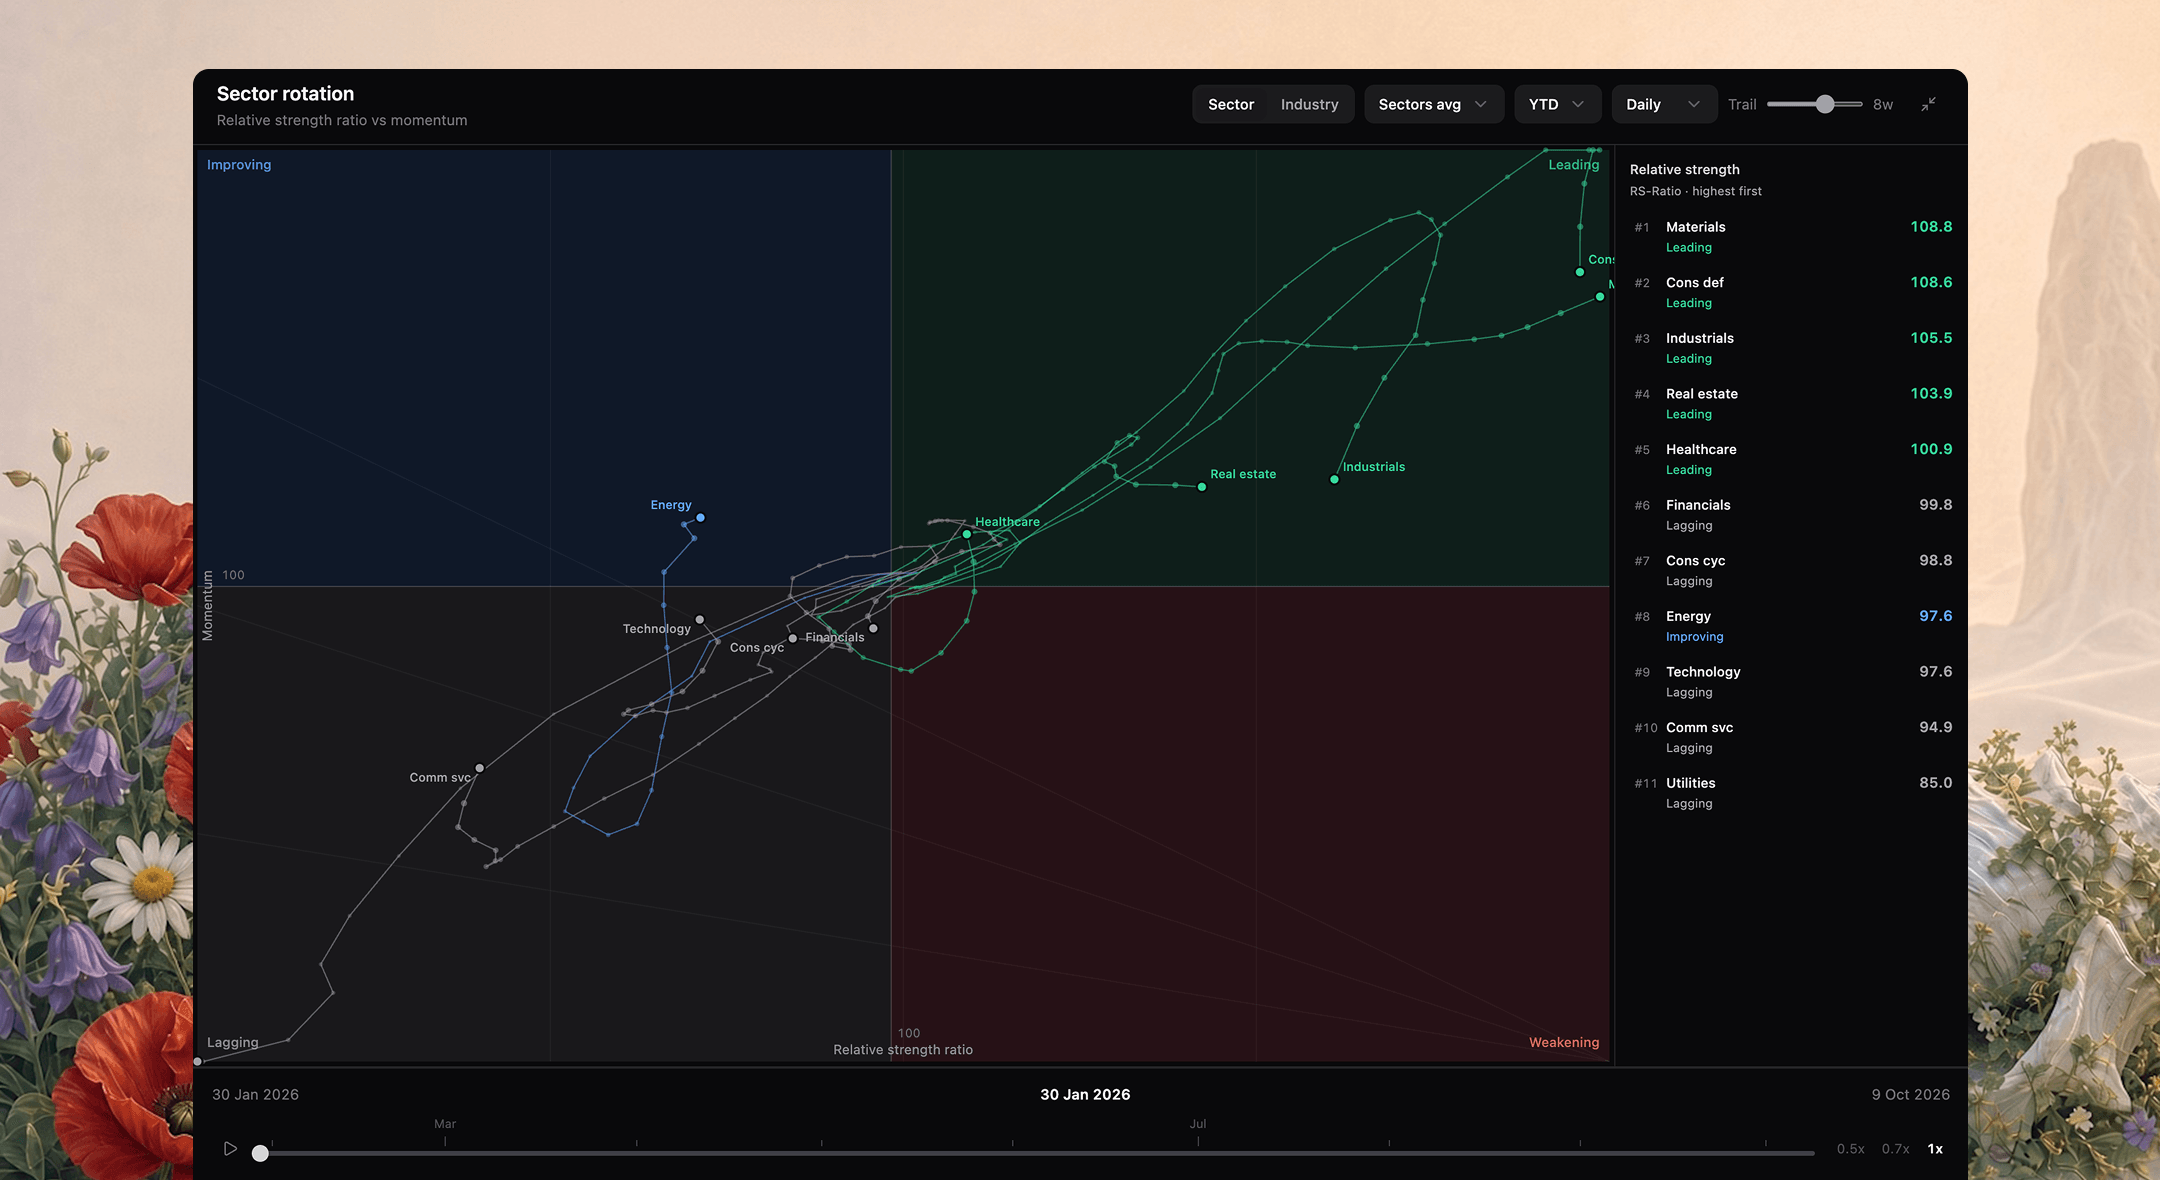
Plot sectors and industries by relative strength versus momentum, and watch them travel through Leading, Weakening, Lagging, and Improving. Scrub a decade of sector history, or five years at industry grain, and benchmark a market against its own index, such as the S&P 500, the Nikkei 225, or the Nifty 50.
- Leading, Weakening, Lagging, Improving
- Trails that show the path
- Ten years of sector history
- Five years at industry grain
- Premier index as benchmark
- 03
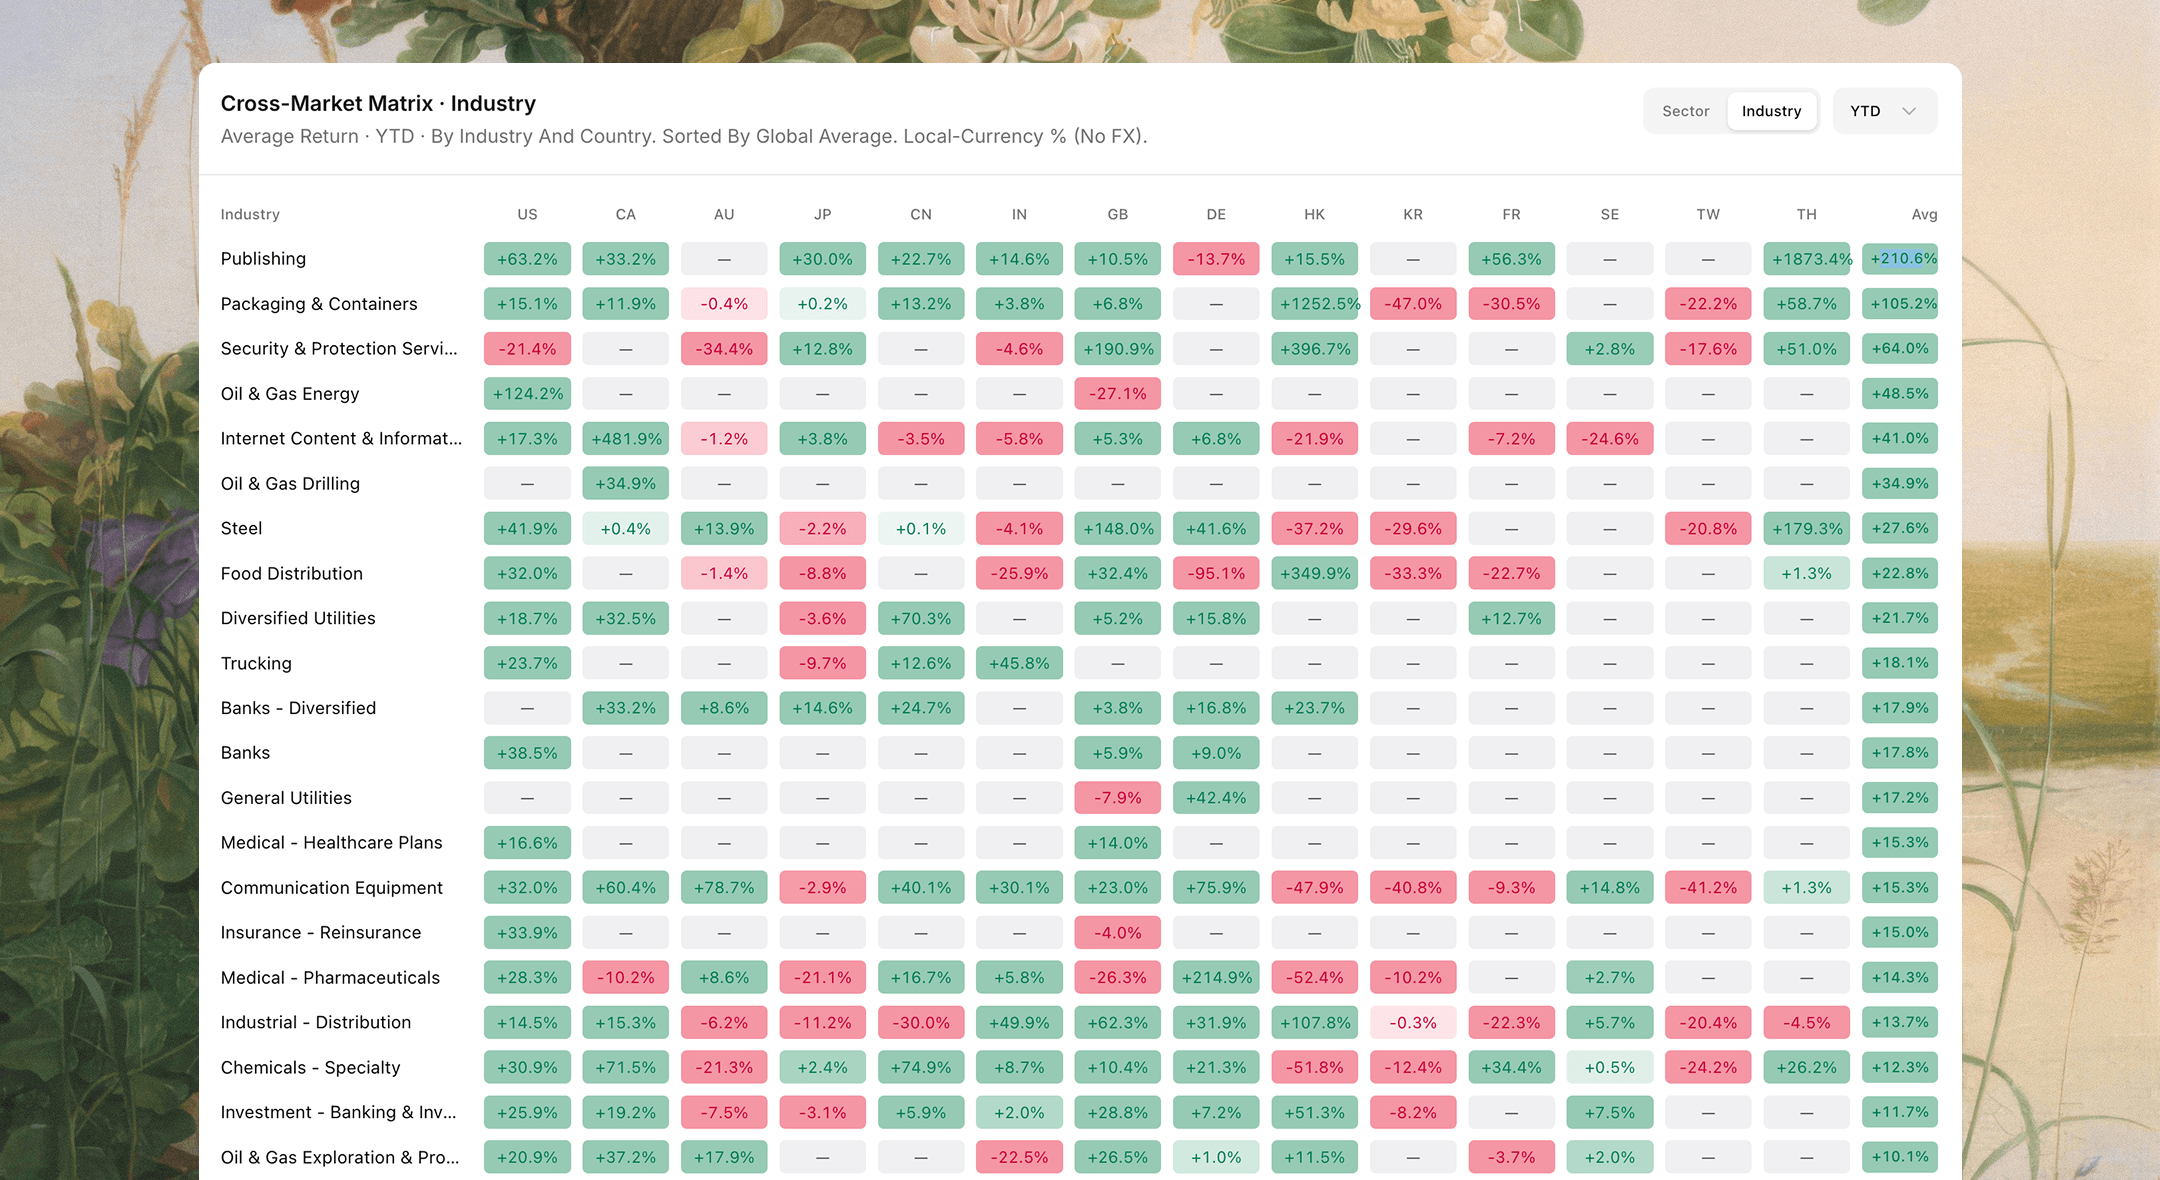
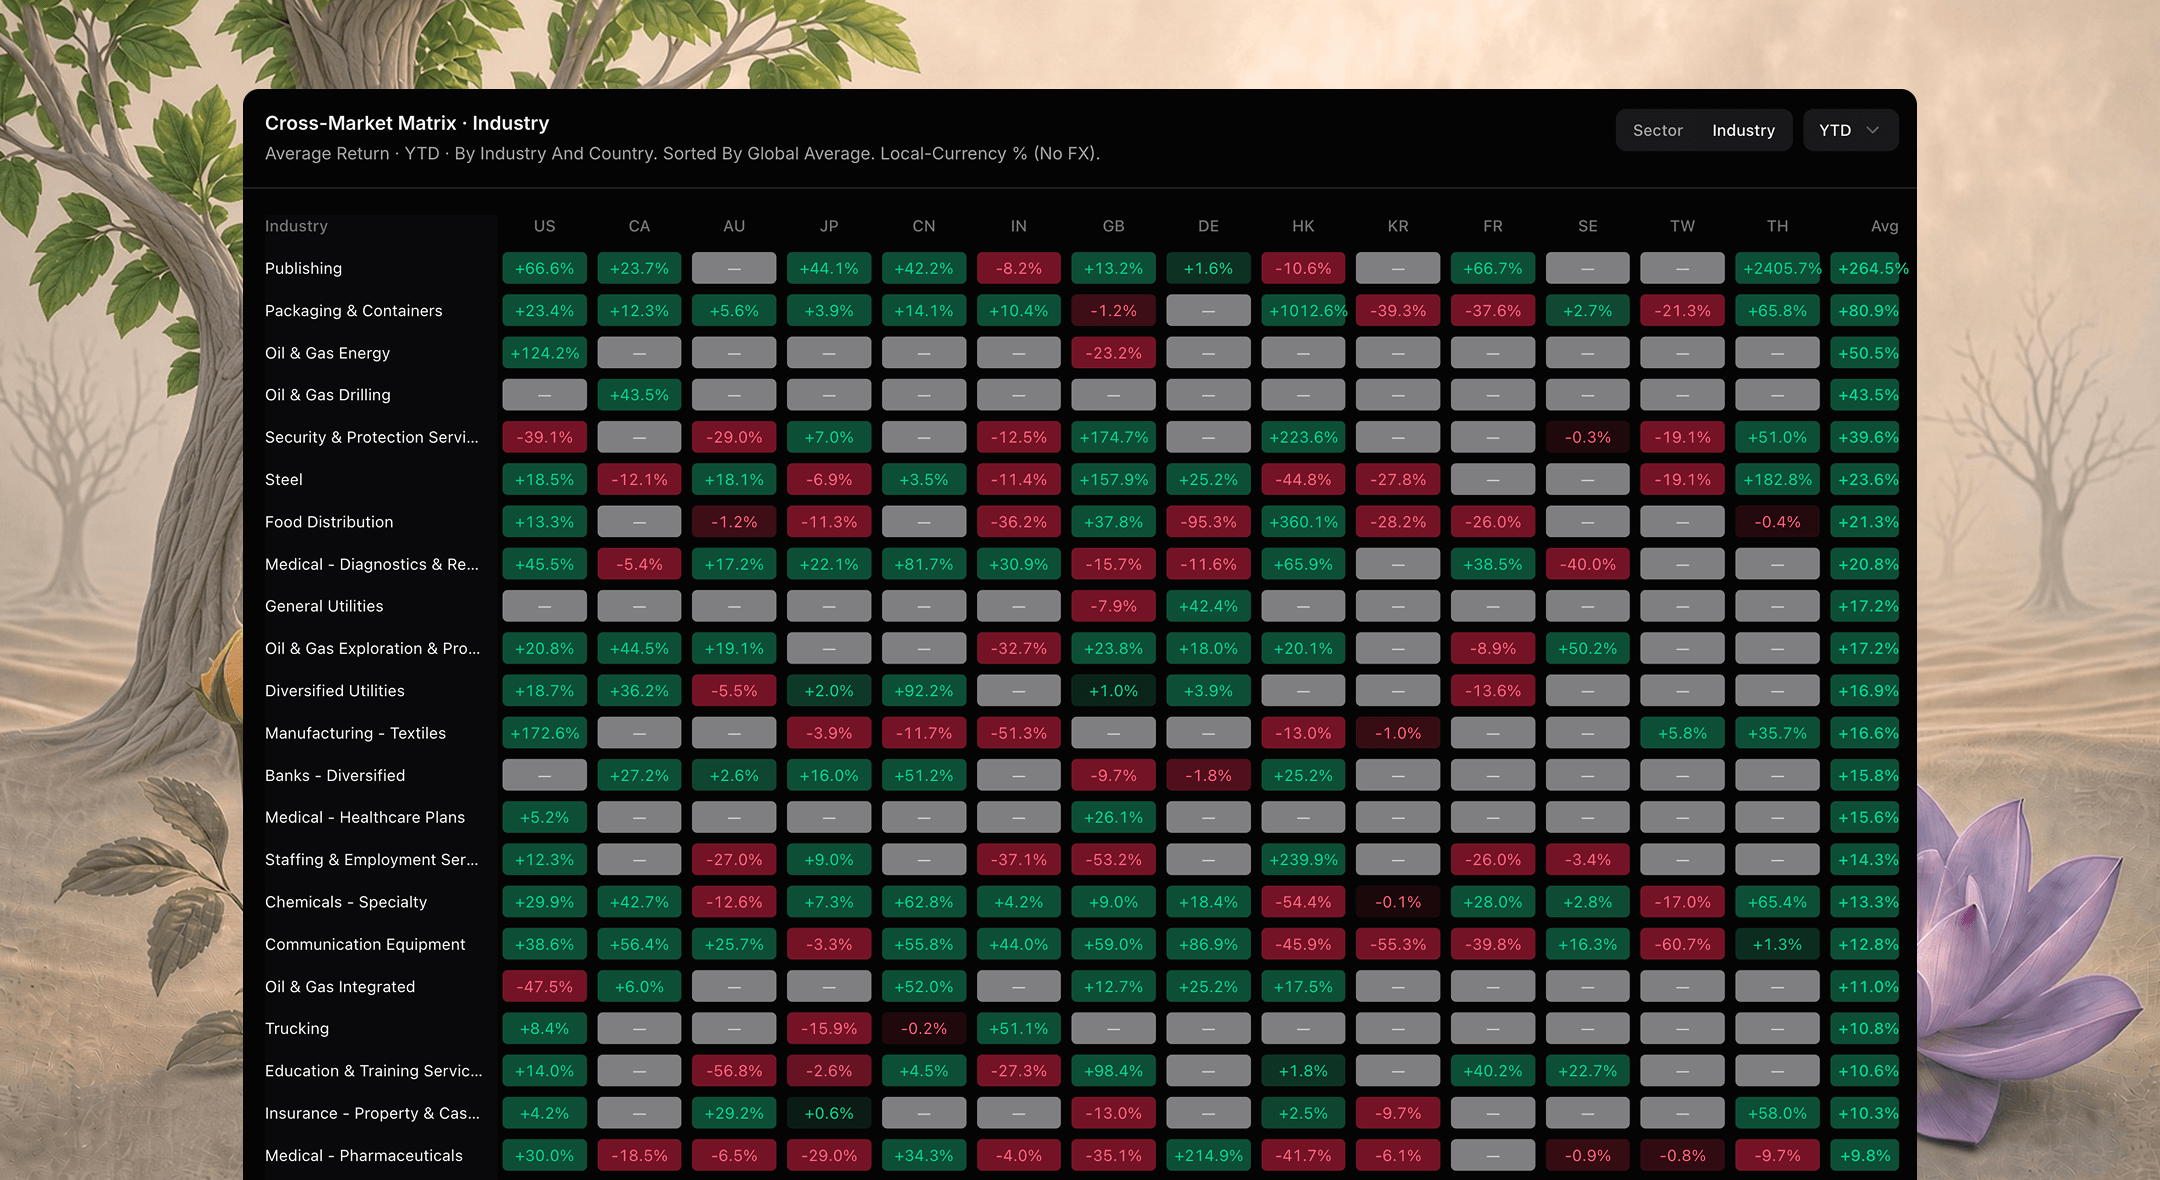
Cross-Market Matrix
See the same sector or industry across 14 countries side by side, in local currency, so a rally in one market and a rally across markets show up as different patterns. Rows sort by the global average return, and you can switch between sector and industry, and between timeframes, without leaving the grid.
- 14 markets in one grid
- Local-currency returns
- Sector or industry rows
- Sorted by global average return
- 04
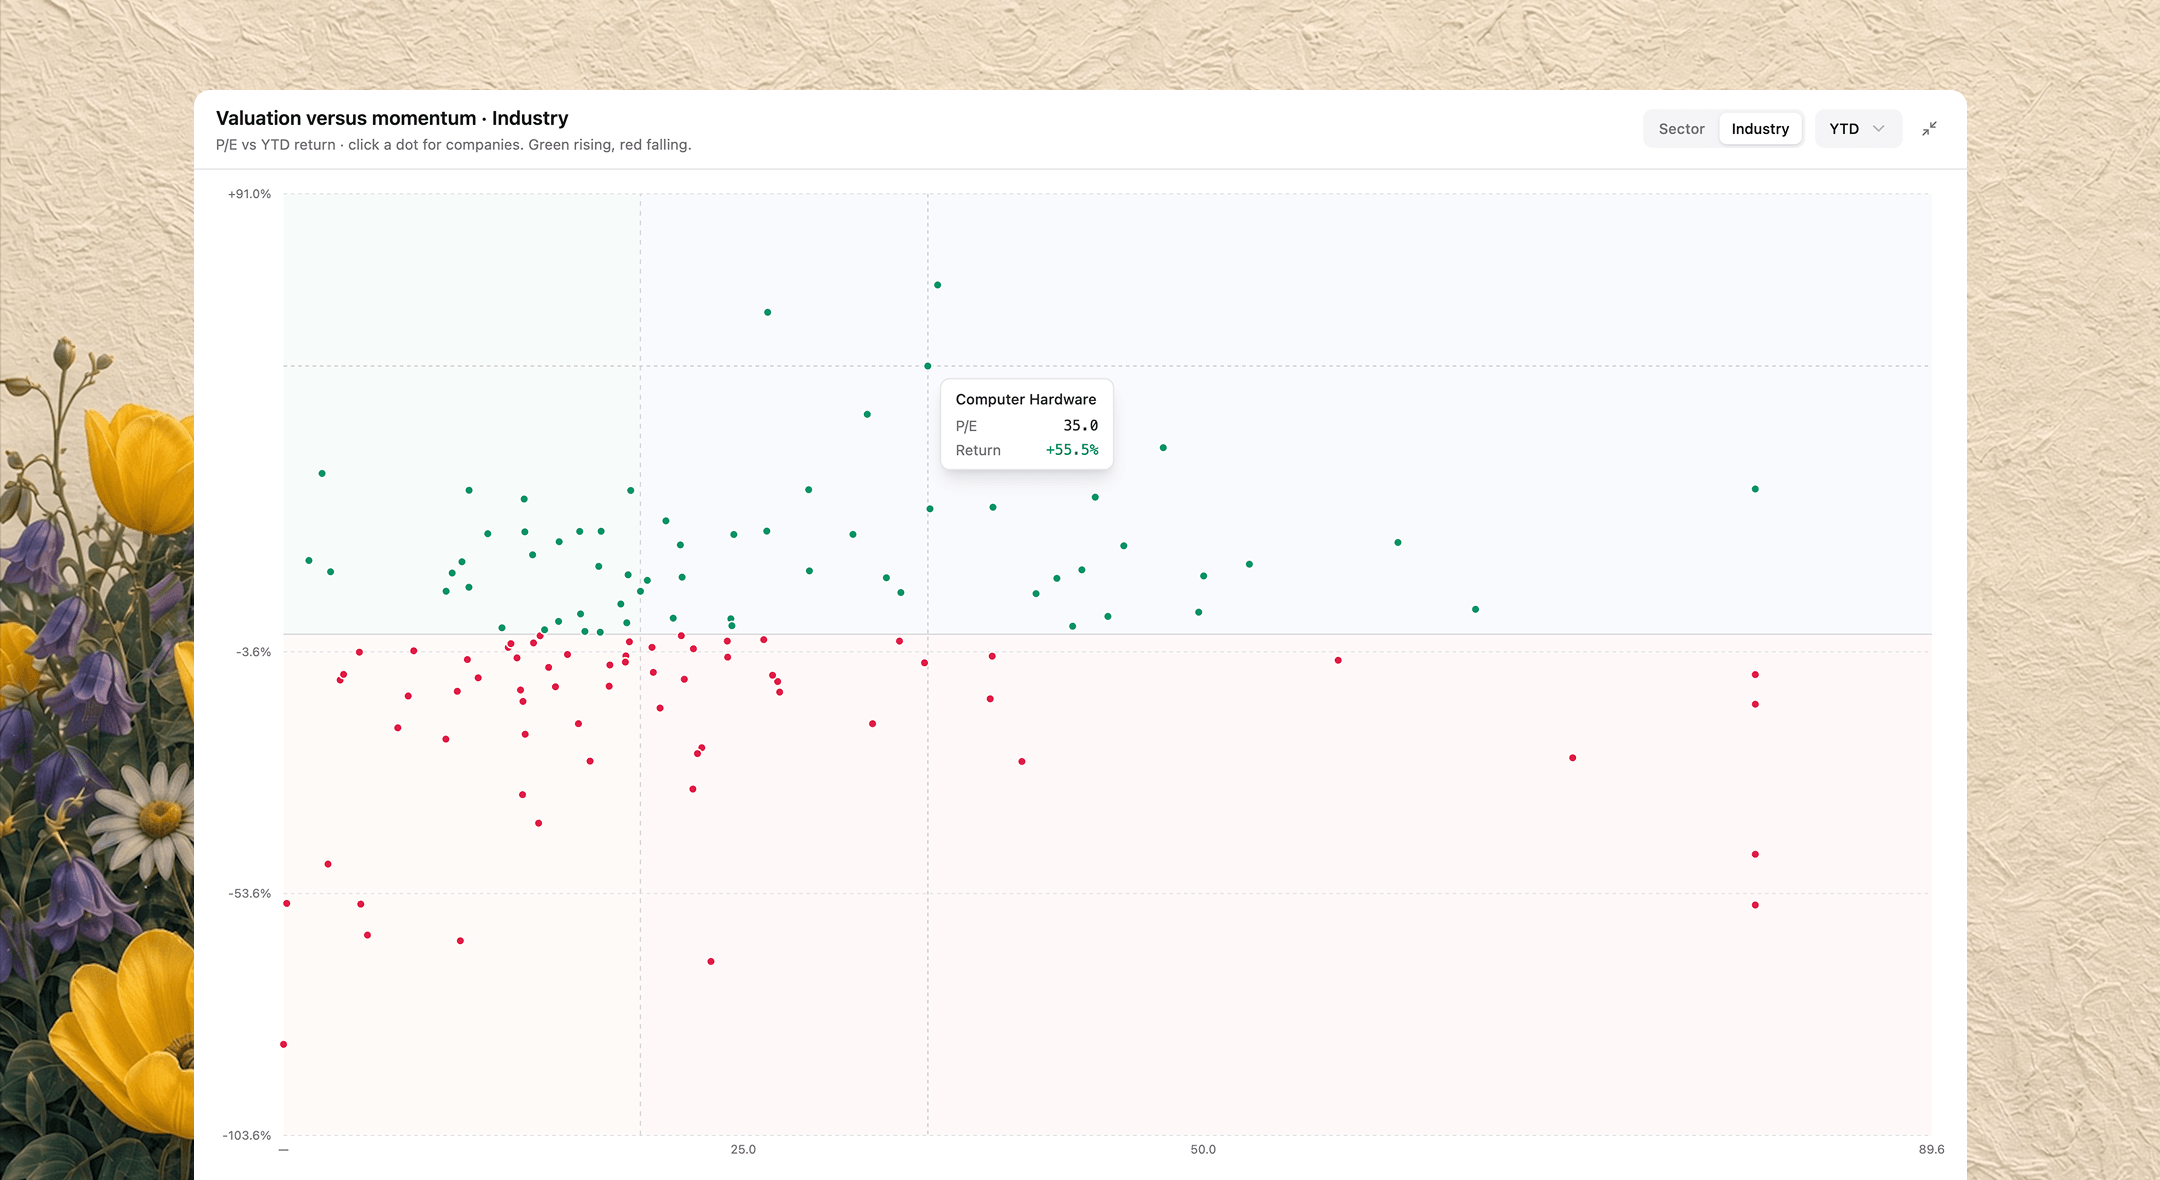
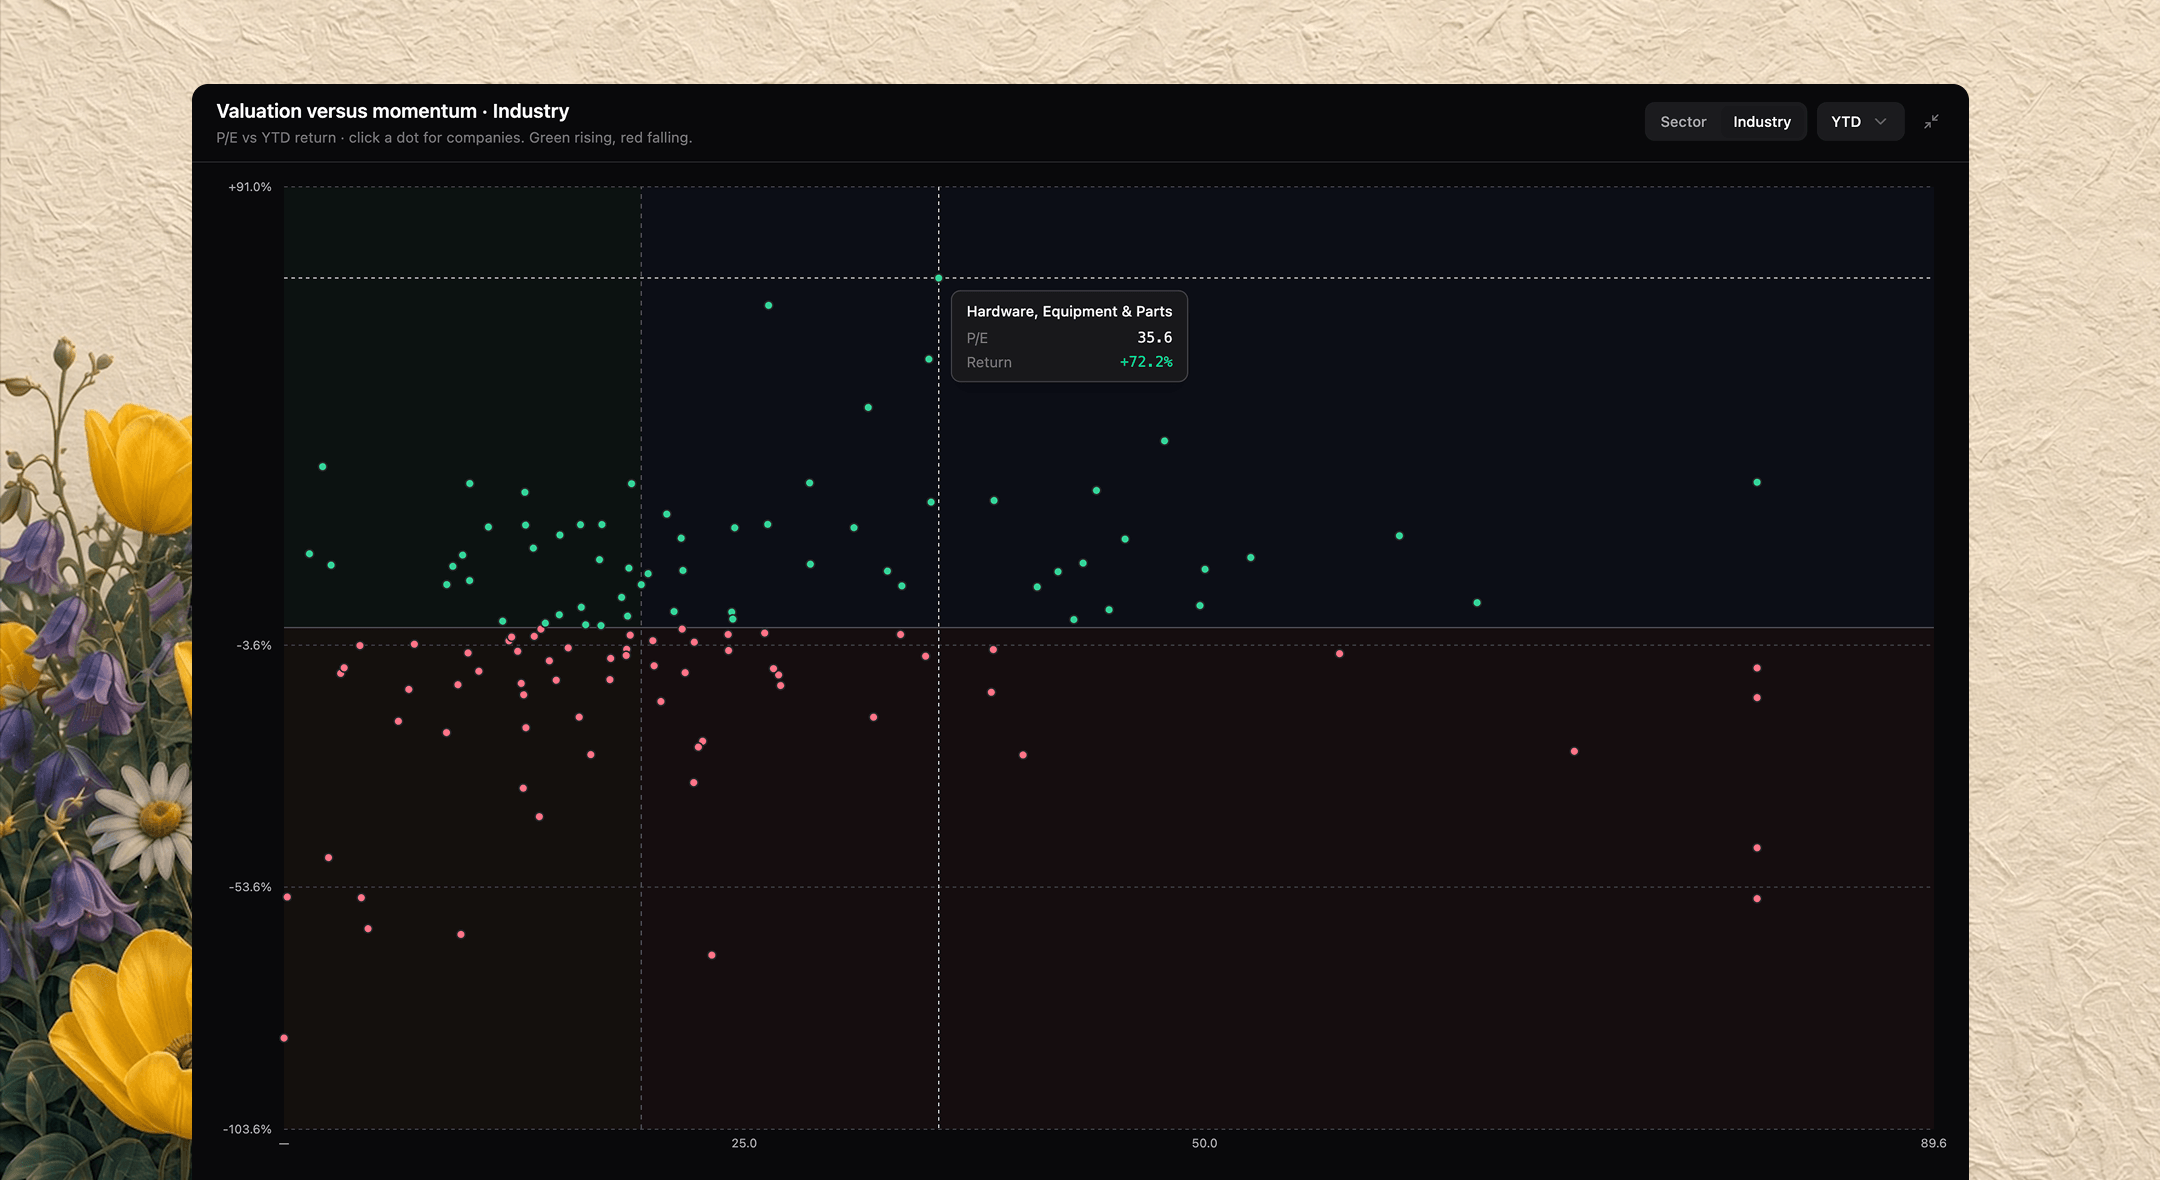
Valuation versus Momentum
Plot P/E against recent return and split the map at the median and at zero, so cheap-and-rising sits apart from expensive-and-falling. P/E percentile bands rank today's multiple inside each group's own history, green when that group is cheap for itself and red when it is expensive.
- P/E against recent return
- Median and zero split
- P/E percentile bands
- Open into the companies inside
What investors say about Amsflow
In their own words, from customers who use Amsflow.
“Amsflow packs a lot into one place without feeling overly complicated. I like being able to research stocks, compare financials, use the screener, set alerts, and dig into charts without bouncing between several different sites. The AI tools are useful for getting a quick second look at a company, while the portfolio and planning features add some depth.”
“Amsflow looks like a powerful all-in-one solution for financial teams! Love the seamless integration of AI insights and collaboration tools.”
“That a great tool and after you go ahead you find the point that you like. For me perfect to make a portfolio and check it out. And also Support with good support. And also nice dashboard. I like it very well and happy with selection (after seaching other tools in internet). For me perfect.”
“Great software for stock monitoring and trading. Both Amsflow and my personal investment account matches in terms of profit and losses. Only wished that choosing a date would generate the price like Tykr for that specific day, but I get why it shouldn't. I love how I could generate an AI report for the income statement and balance sheet for each company and it condense it into an easy to digest format.”
“This AI-based stock analysis tool is spot-on I feel, and seems to give good, rounded advice and results. The UI and layout are easy to follow and so far, I've not run into any major issues. Overall, a good analysis tool to use!.”
“An absolute game-changer! The platform is super sleek and easy to use for financial analysis. Honestly, what impressed me the most is how amazing their customer support is—I asked them to add the Saudi market, and they actually did it so fast. Really appreciate their effort, and I totally recommend it to any investor!”
“Amsflow is an impressive all-in-one platform for financial research and portfolio tracking. The interface is sleek, intuitive, and packed with useful tools—from global screeners and detailed fundamental data to customizable alerts, technical charts, and AI-powered analysis through Lisa and X-Ray. The lifetime plan offers strong value, especially considering the frequent updates and expanding features like Dash, Planner, and Journal. I also appreciate that the team seems responsive to user feedback and actively improves market coverage and functionality. A great option for investors who want powerful analytics in one convenient web-based platform.”
“I can only offer my compliments. Initially, I gave it 4 stars in my review because the list of cryptocurrencies was very limited. Within a week, the founder contacted me to let me know that he had added 4,300 cryptocurrencies.”
“Nice software and value for money, it would be far better if it included API.”
“I've been using Amsflow Screener for a while now, and it's been a game-changer. Typing metrics and filters is easy and fast; it's by far the best screener I've used. Most screeners are complex, but Amsflow is intuitive.”
“Recently I’ve been using Amsflow to manage my portfolio across multiple assets, and it has truly simplified the way I track investments. Instead of juggling different platforms, I can monitor equities, indices, commodities, and watchlists all in one place. The real-time data and advanced charting tools give me clear insights into performance, trends, and correlations, which helps me make faster and more informed decisions. What I appreciate most is the flexibility of customizable watchlists. I can organize assets by sector, geography, or risk profile, which makes it easy to align the platform with my personal strategy. The analytics are robust, offering a detailed view of volatility, sentiment, and overall portfolio health. Navigation feels smooth and intuitive, so I never waste time searching for information. Overall, Amsflow has become a reliable tool that saves me time, reduces complexity, and gives me confidence in managing diverse investments efficiently.”
“Amsflow is an exceptional investment research and portfolio management tool that I highly recommend. .The fundamental data, and custom screening features empower me to make well- informed investment decisions.on top of it AJAY is very efficient and top of things, intially canada etf data were missing and he updated in just couple of hours, i am really impress with support”
“This is all web browser based, making it convenient to launch almost anywhere with internet. The GUI is easy to understand, and it provides great information with the opportunity to use AI to analyze things further. ”
“I am quite happy with the subscription that I have purchased. It is excellent value for money as compared to some of the other services out there. I purchased it for the real time global data available in Amsflow and it does have data on major global markets. The Developers are also super quick - I suggested 4 enhancements to make it easier to use this product - all these were implemented in 1 day. Overall very happy with the purchase.”
“X-Ray transforms hours of my analysis into instant insights. One click delivers comprehensive stock evaluation with technical signals, pivot points, and anomaly detection - it's like having a seasoned analyst at my fingertips.”
“Most screeners I've used are complex, hard to use, and overcomplicated, but Amsflow Screener is intuitive and straightforward. Finally, using a screener makes sense.”
“WORTH EVERY DOLAR!!!. The Amsflow support team is AWESOME, they solve the problem with indicators after weeks of hard work. They are all ears and that is for me a FULL 5 STARS APP. YOU CAN BUY WITH CONFIDENCE. I think this is a massive solid project. Thank you Amsflow.”
“Been using Amsflow for a few months now, and it is my go-to tool for analysis. The Screener is the highlight! I can slice through global markets, filter by metrics that matter to me, and even get AI suggestions from Lisa. The combo of data + AI saves serious time and, more importantly, helps find 'HIDDEN GEMS'. feature, and you should explore it. The Series feature lets me line up different assets, sectors, or even macro indicators and actually see how they’re moving together (or not). Found a few interesting correlations I’d have 100% missed otherwise.”
“I’ve been using Amsflow for the last 6–7 months, and it’s by far the best financial research platform I’ve used. I was fortunate enough to get early access to the Amsflow Screener, and it truly feels magical. As far as I know, only two screeners offer global data: TradingView and the Amsflow Screener. I prefer the Amsflow Screener because it’s so simple to use, especially with its query builder. The Lisa Screener Agent is also incredibly helpful whenever I’m unsure which metrics to use. I would highly recommend it for finding swing stocks or for long-term investing.”
Sharpen your investment research with Amsflow
Find, chart, plan and track — every core Amsflow product working as one, so research never leaves your flow.
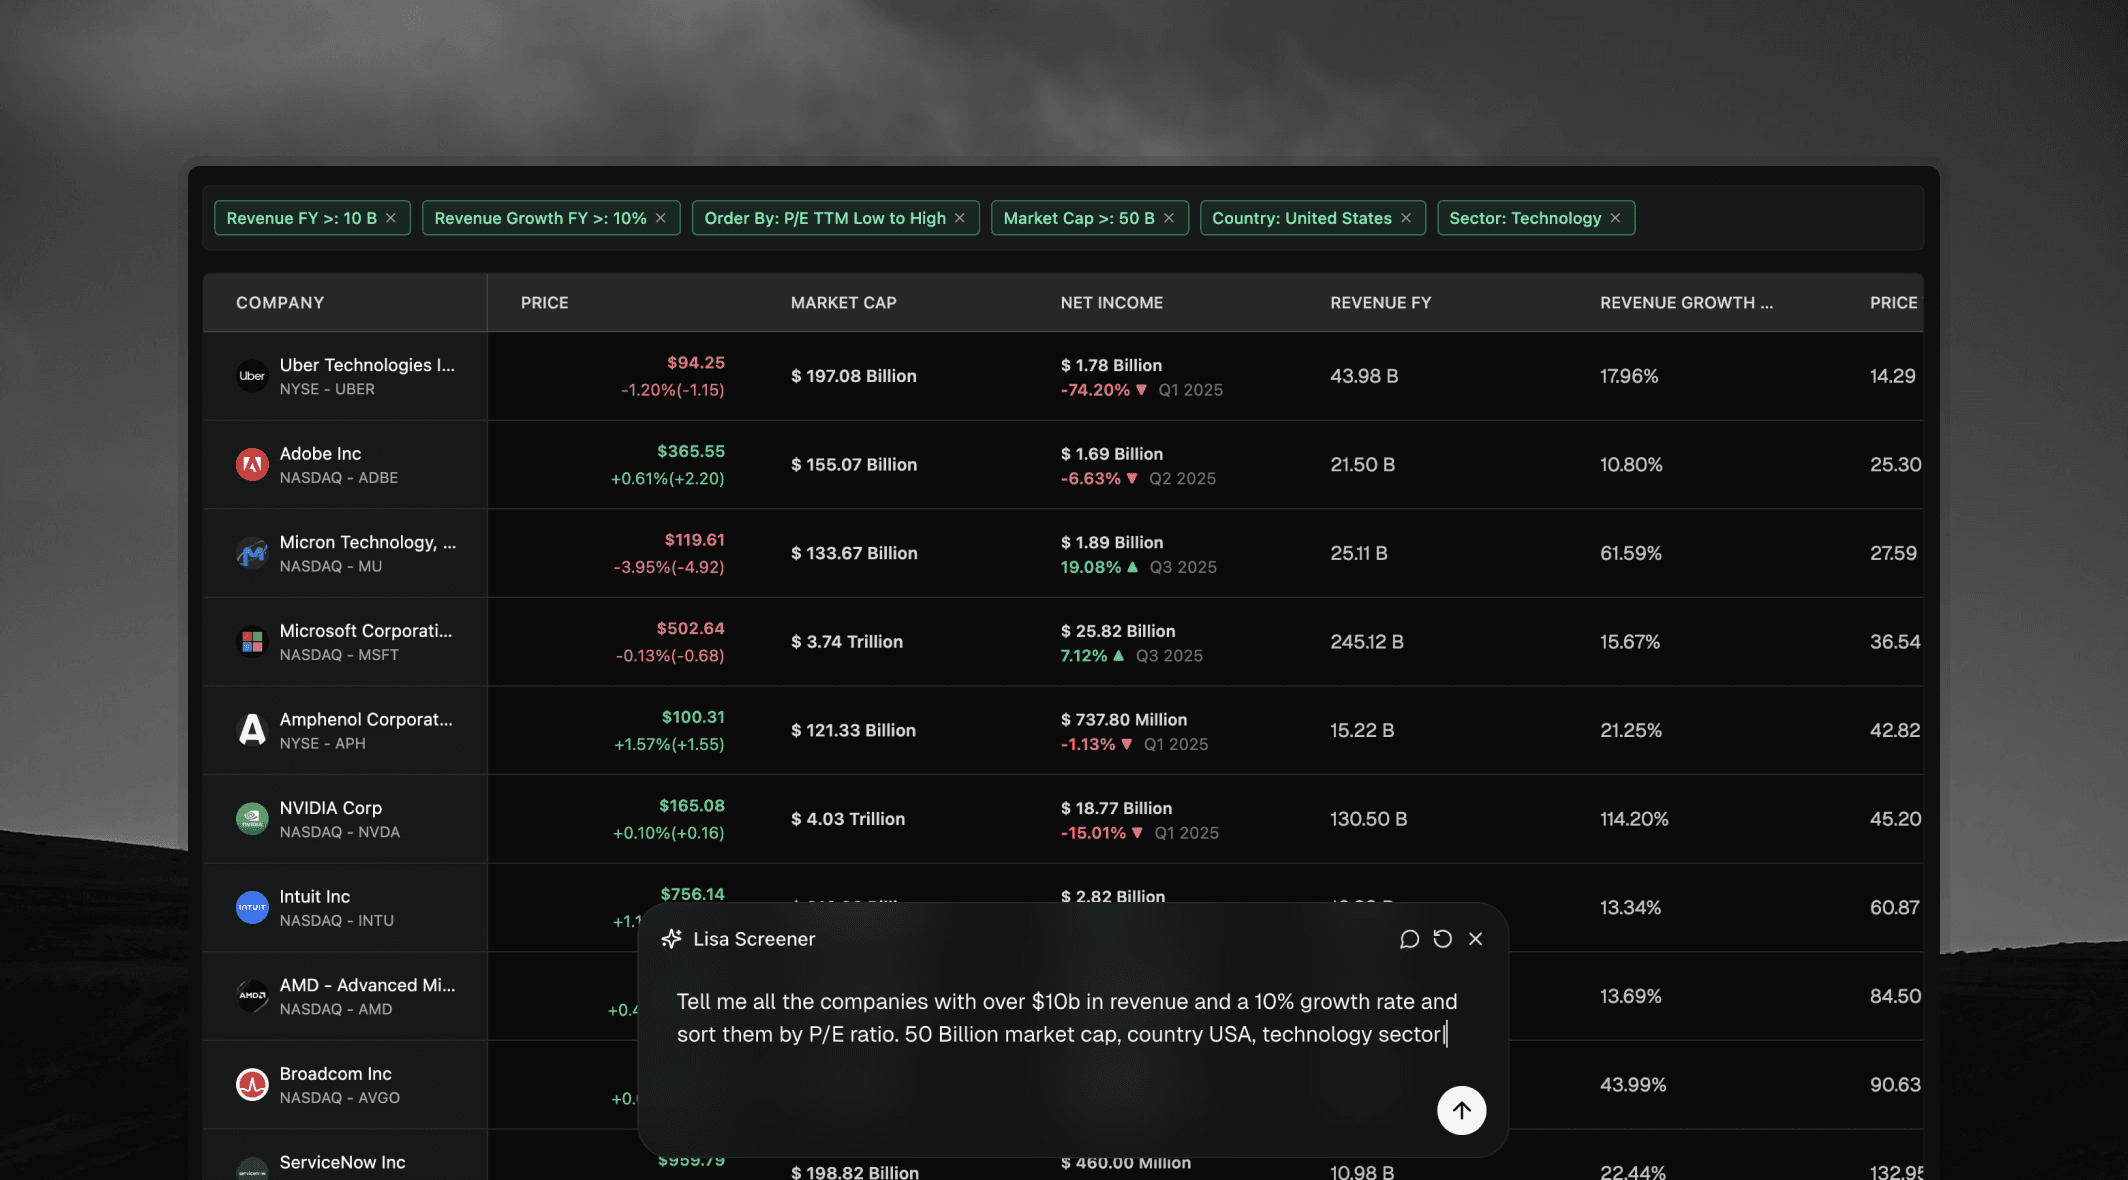
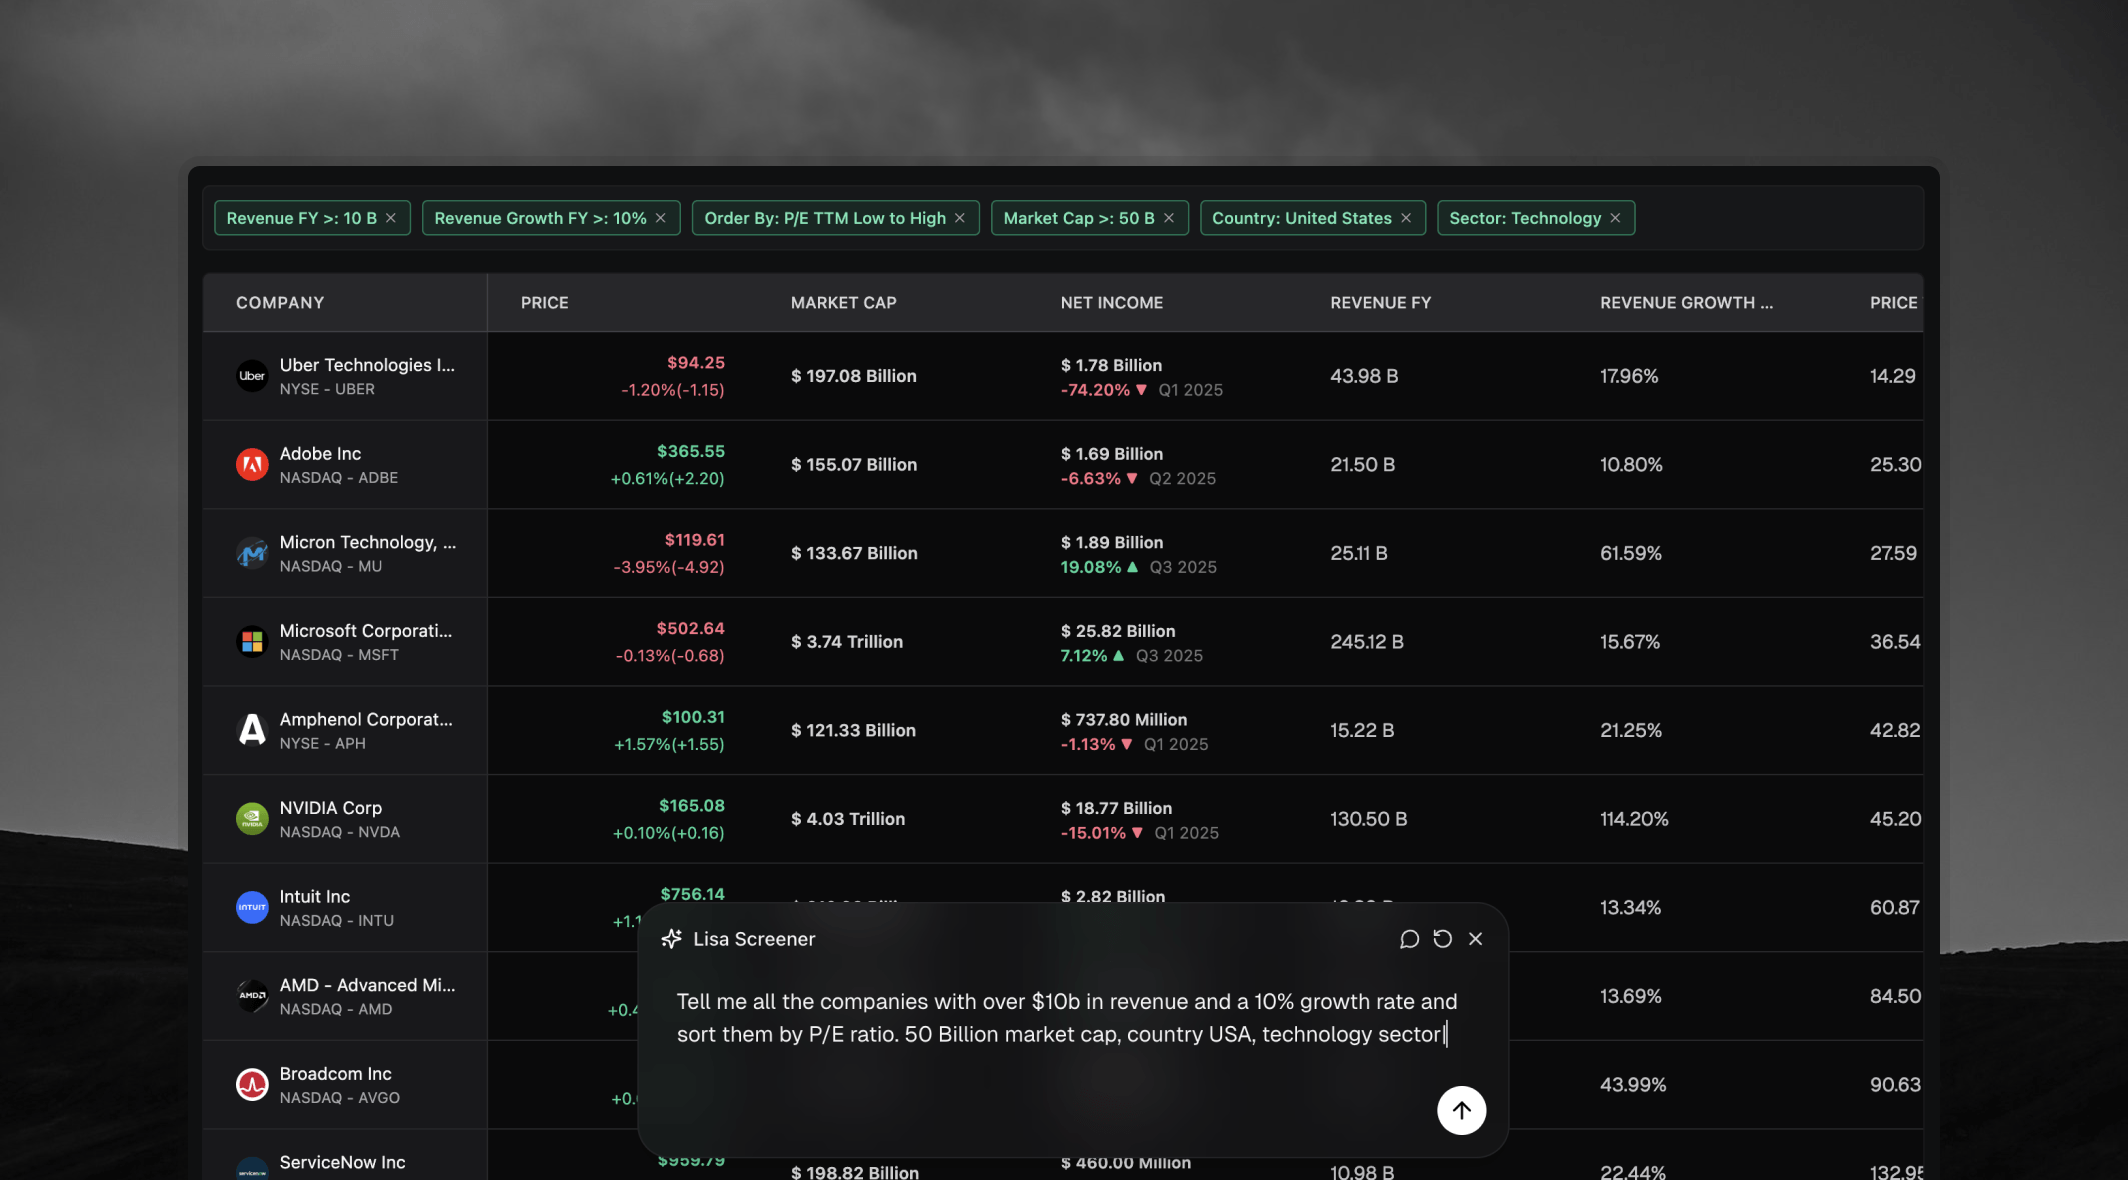
AI Stock Finder
Ask in plain English or build precise queries across 550+ metrics and 8,000 filters to surface stocks that fit your thesis.


Global Rotation
See where capital is moving across sectors and industries in 14 markets, from relative rotation to valuation versus momentum.
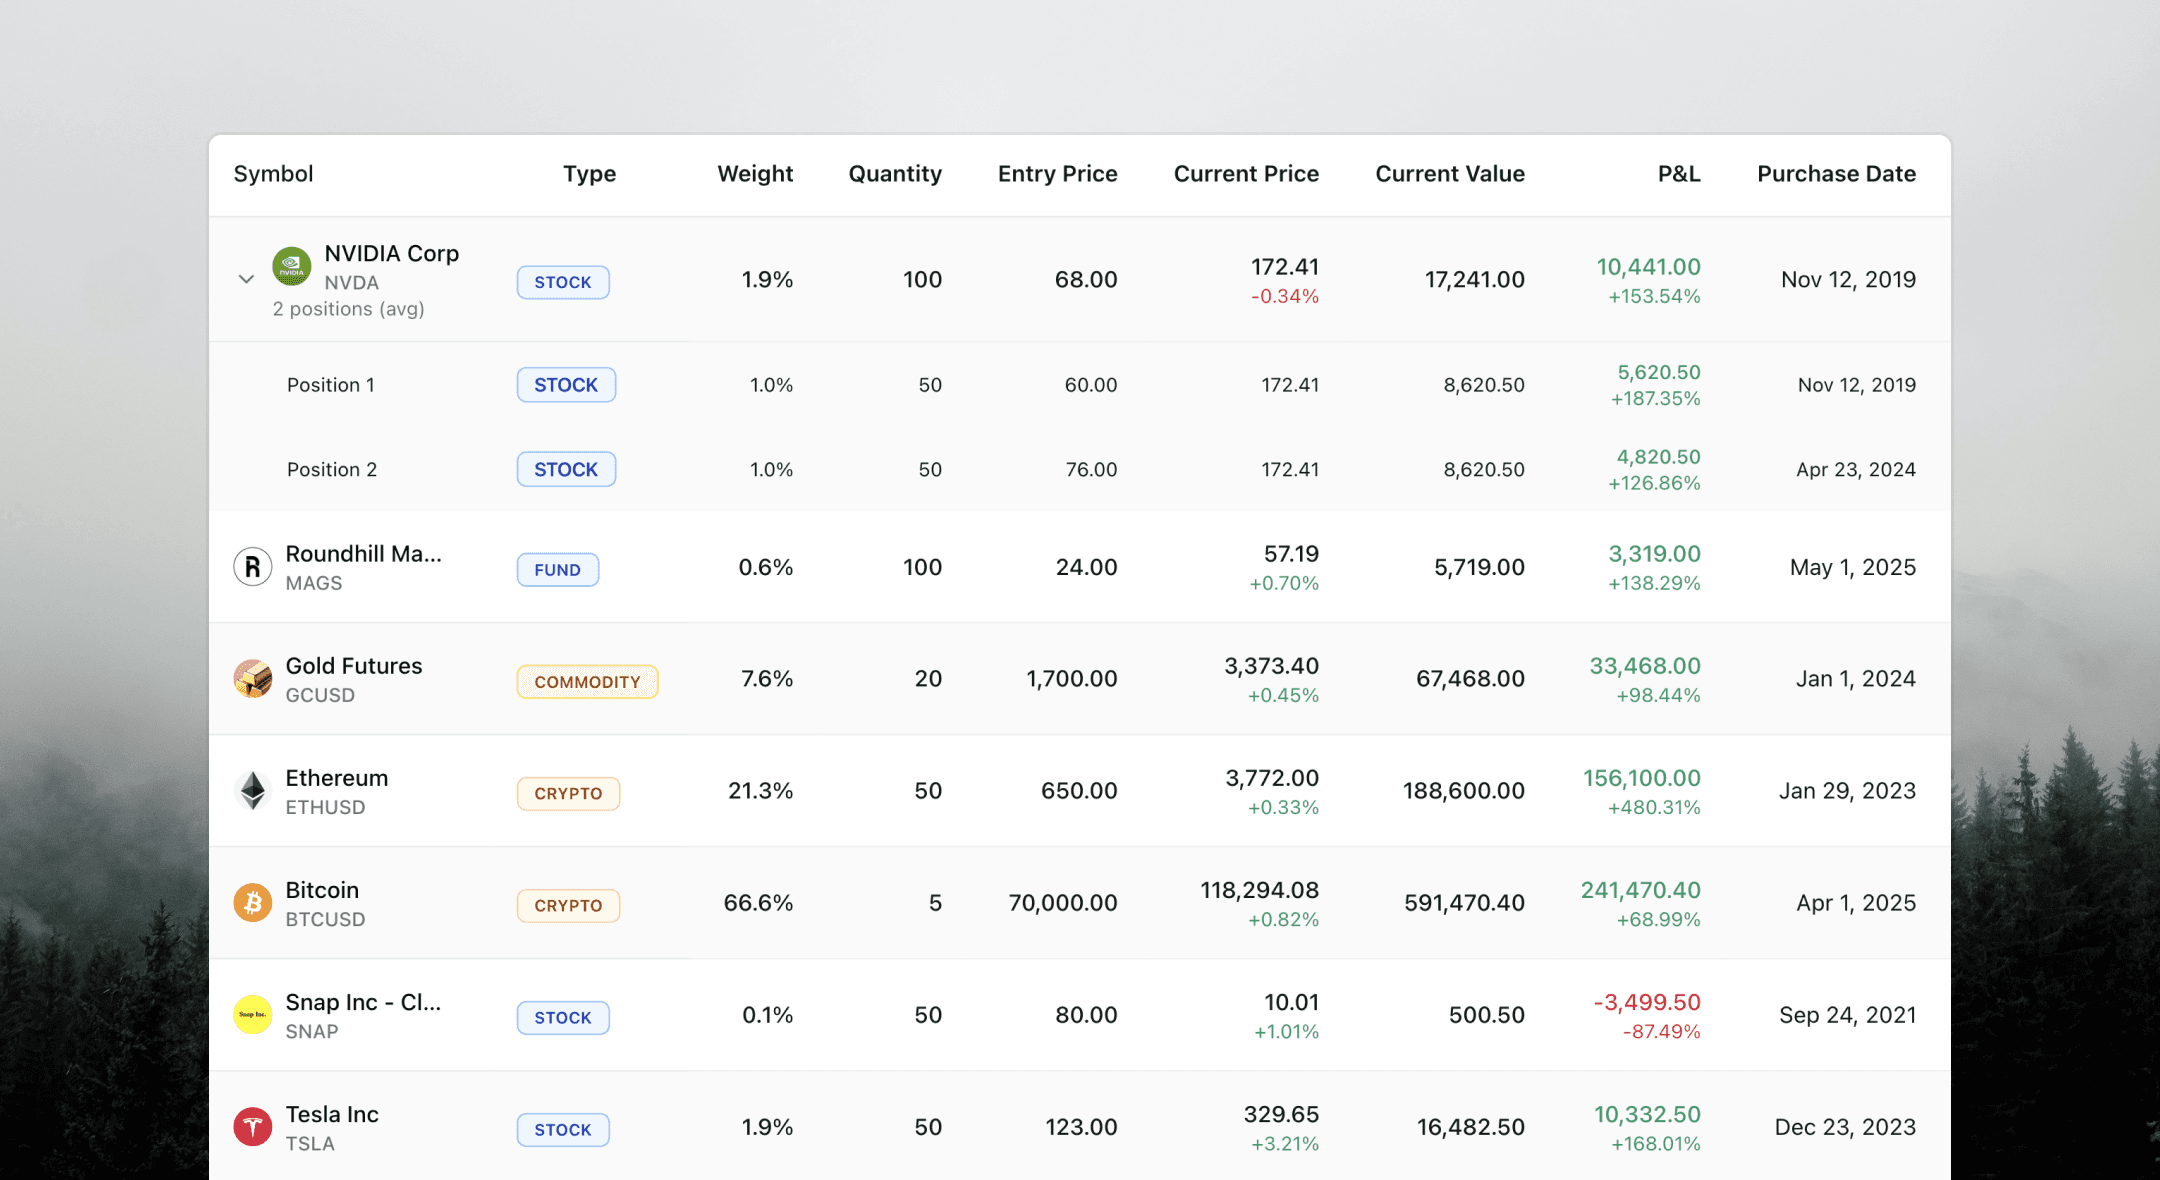
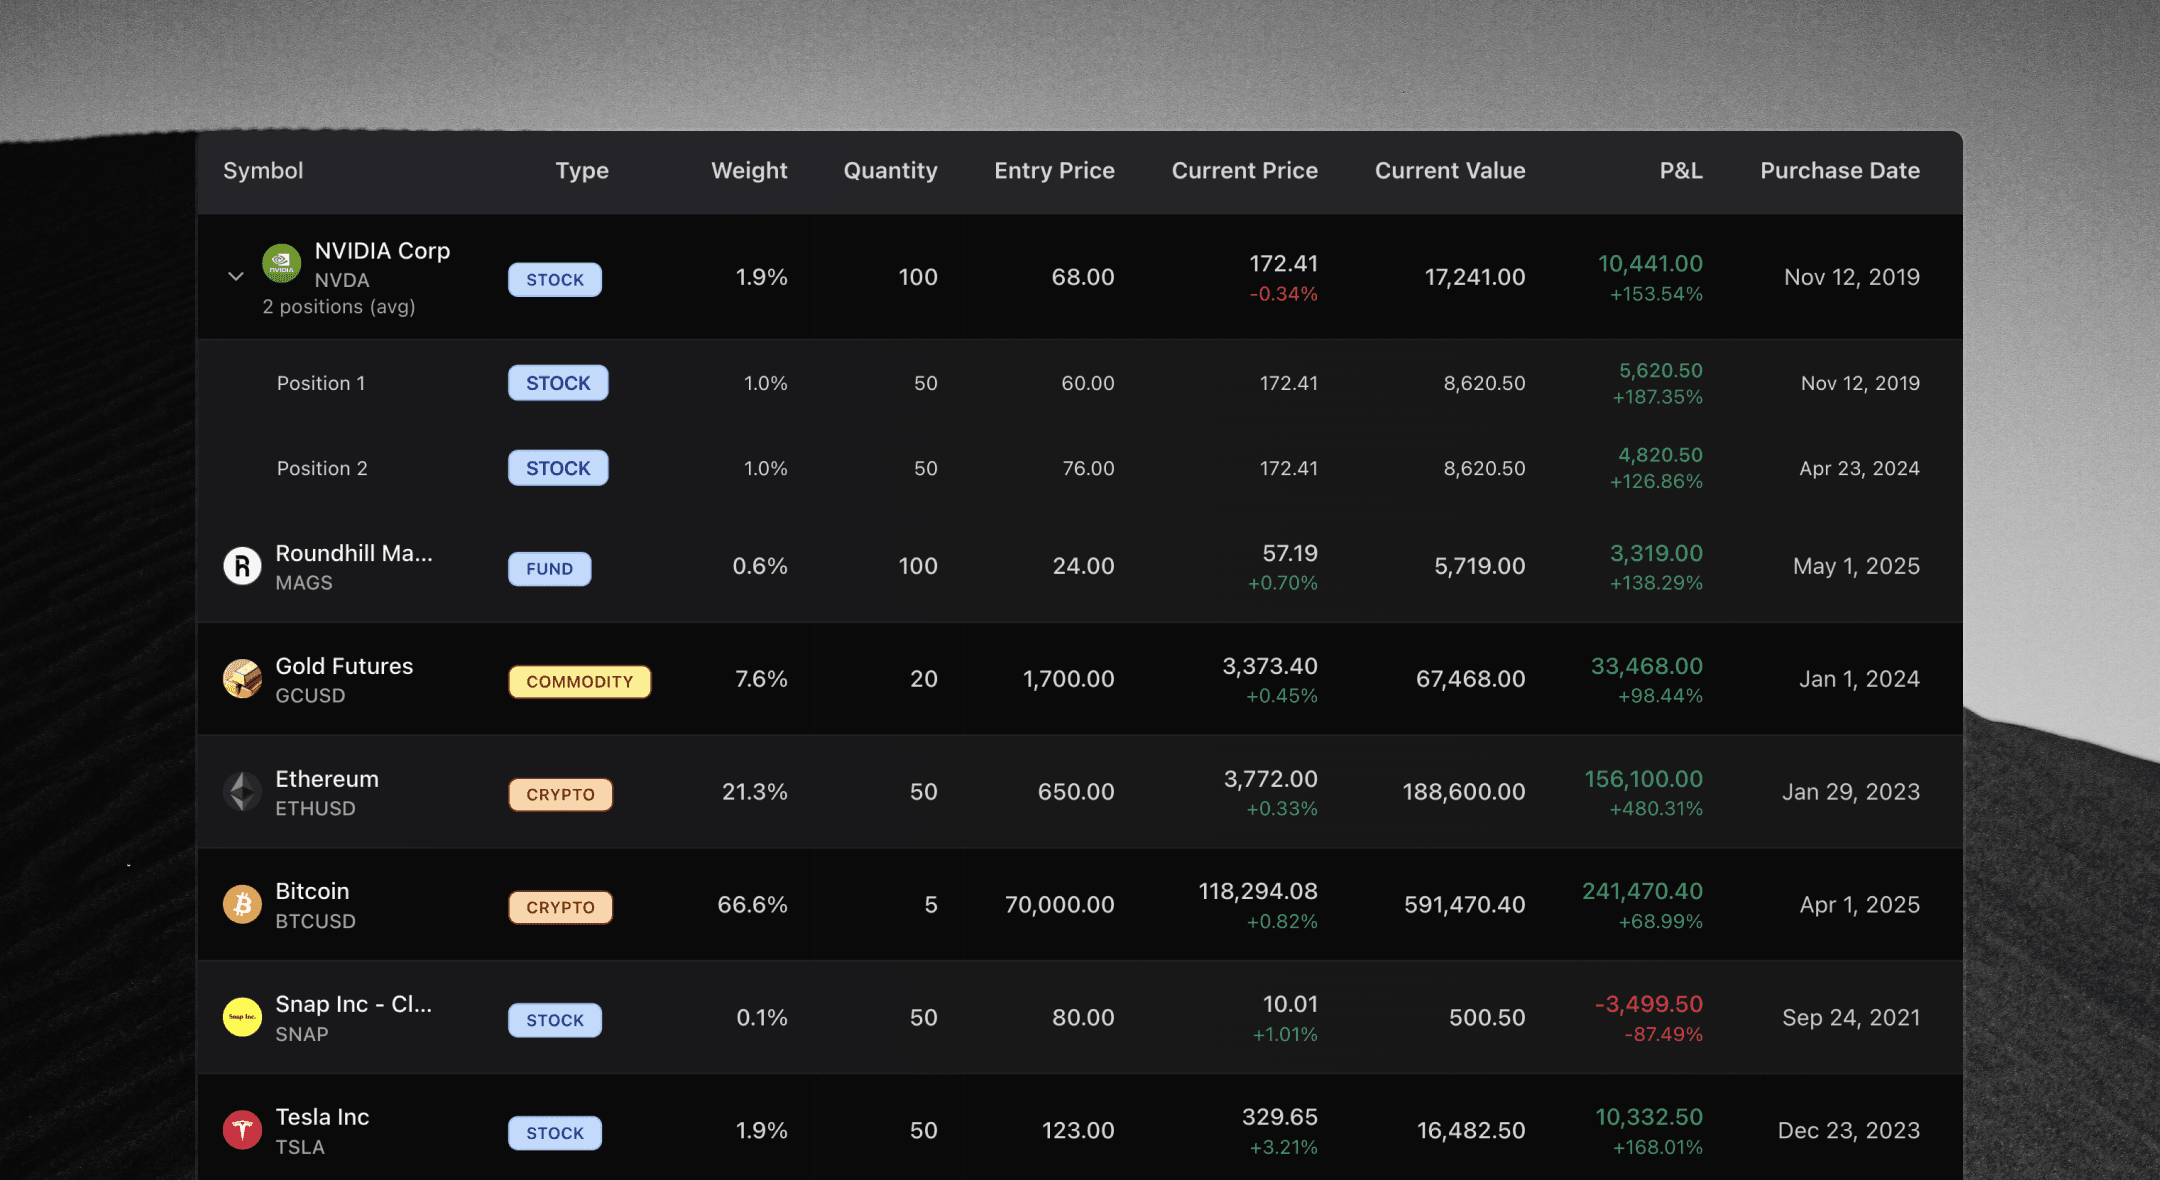
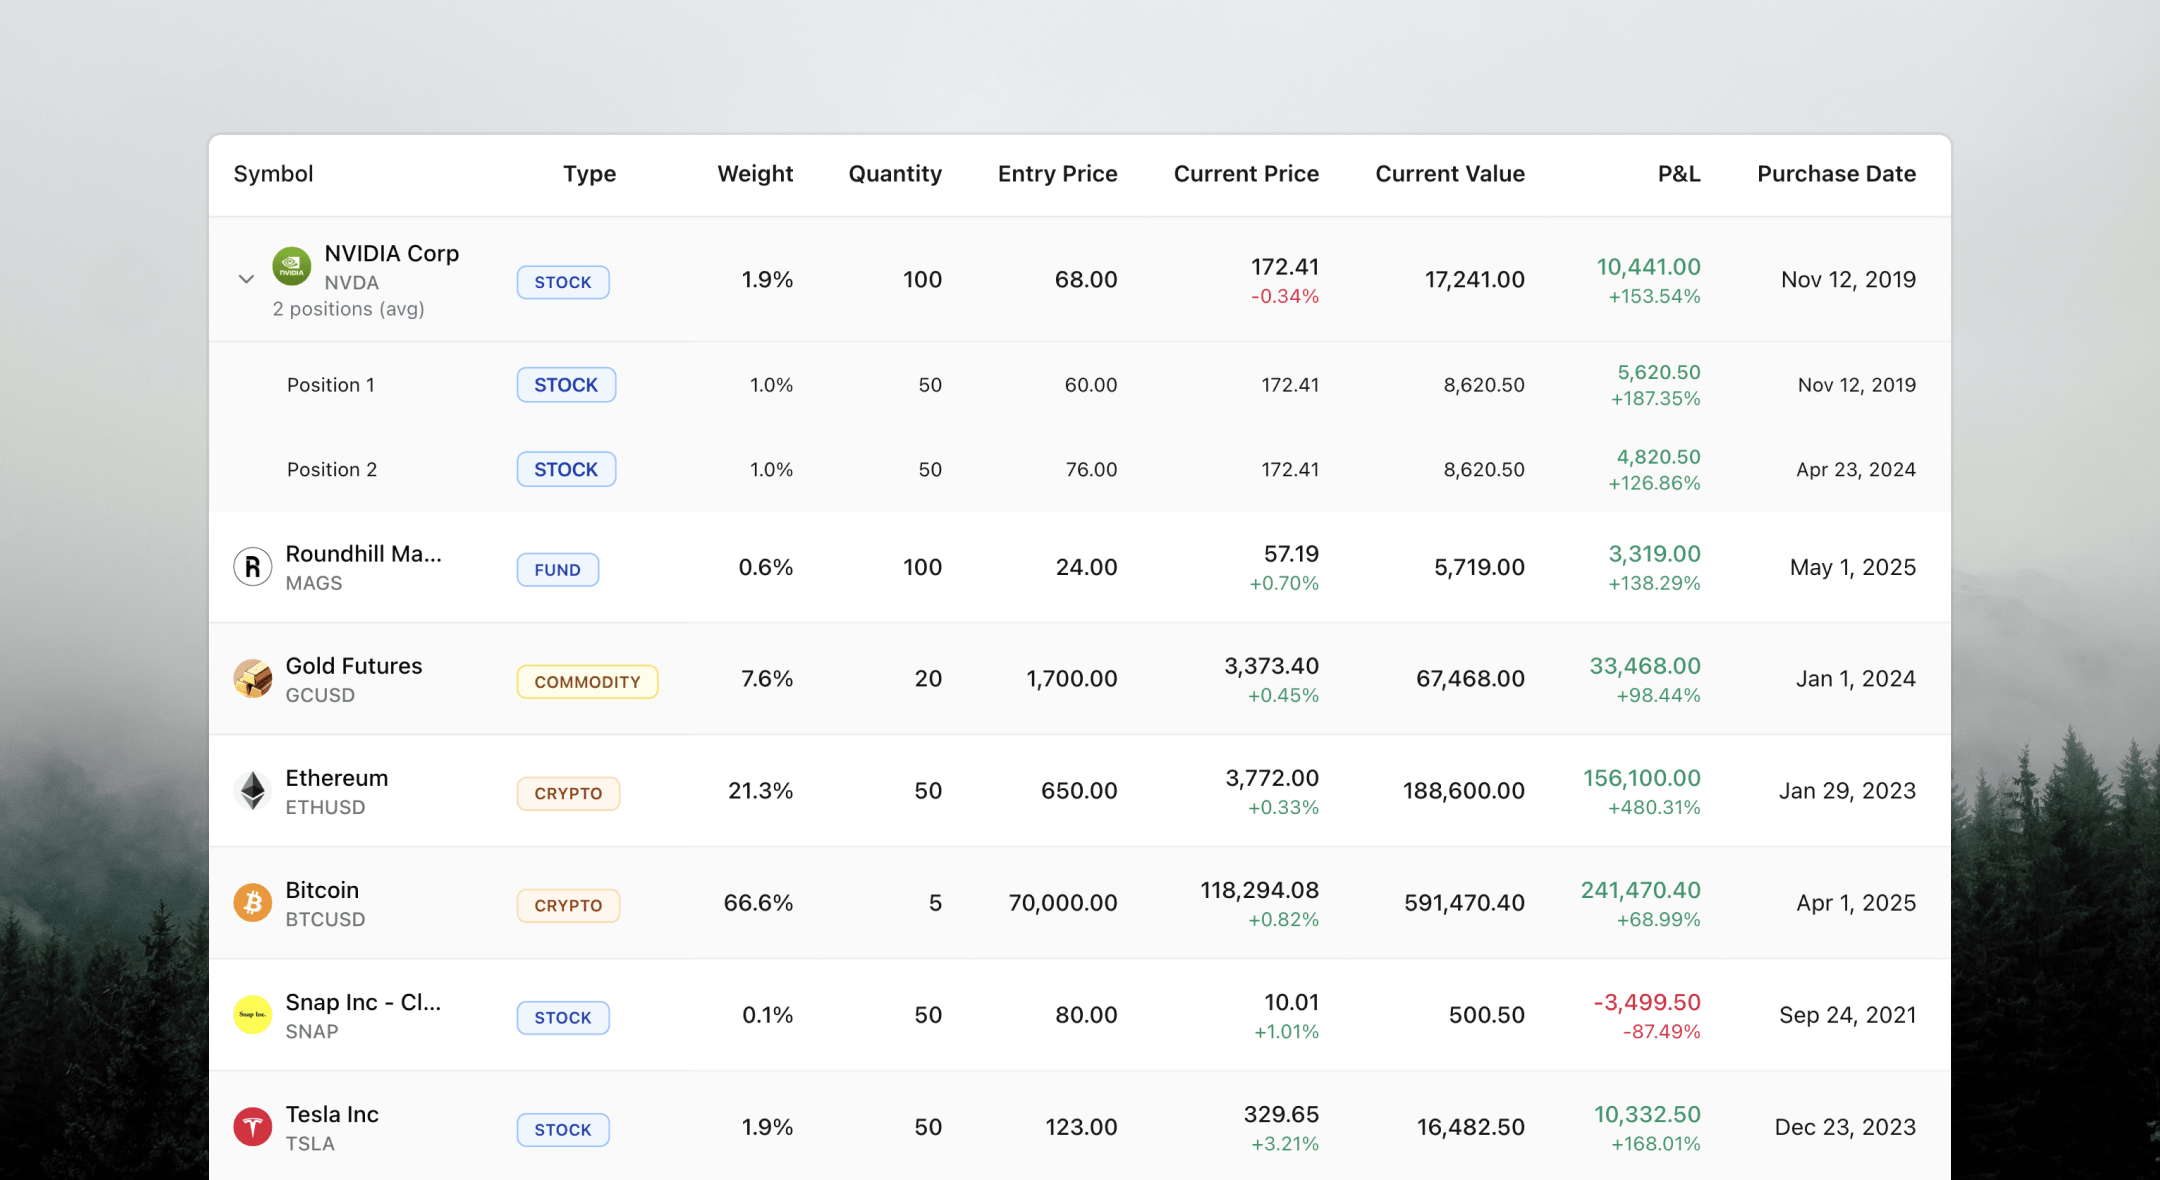
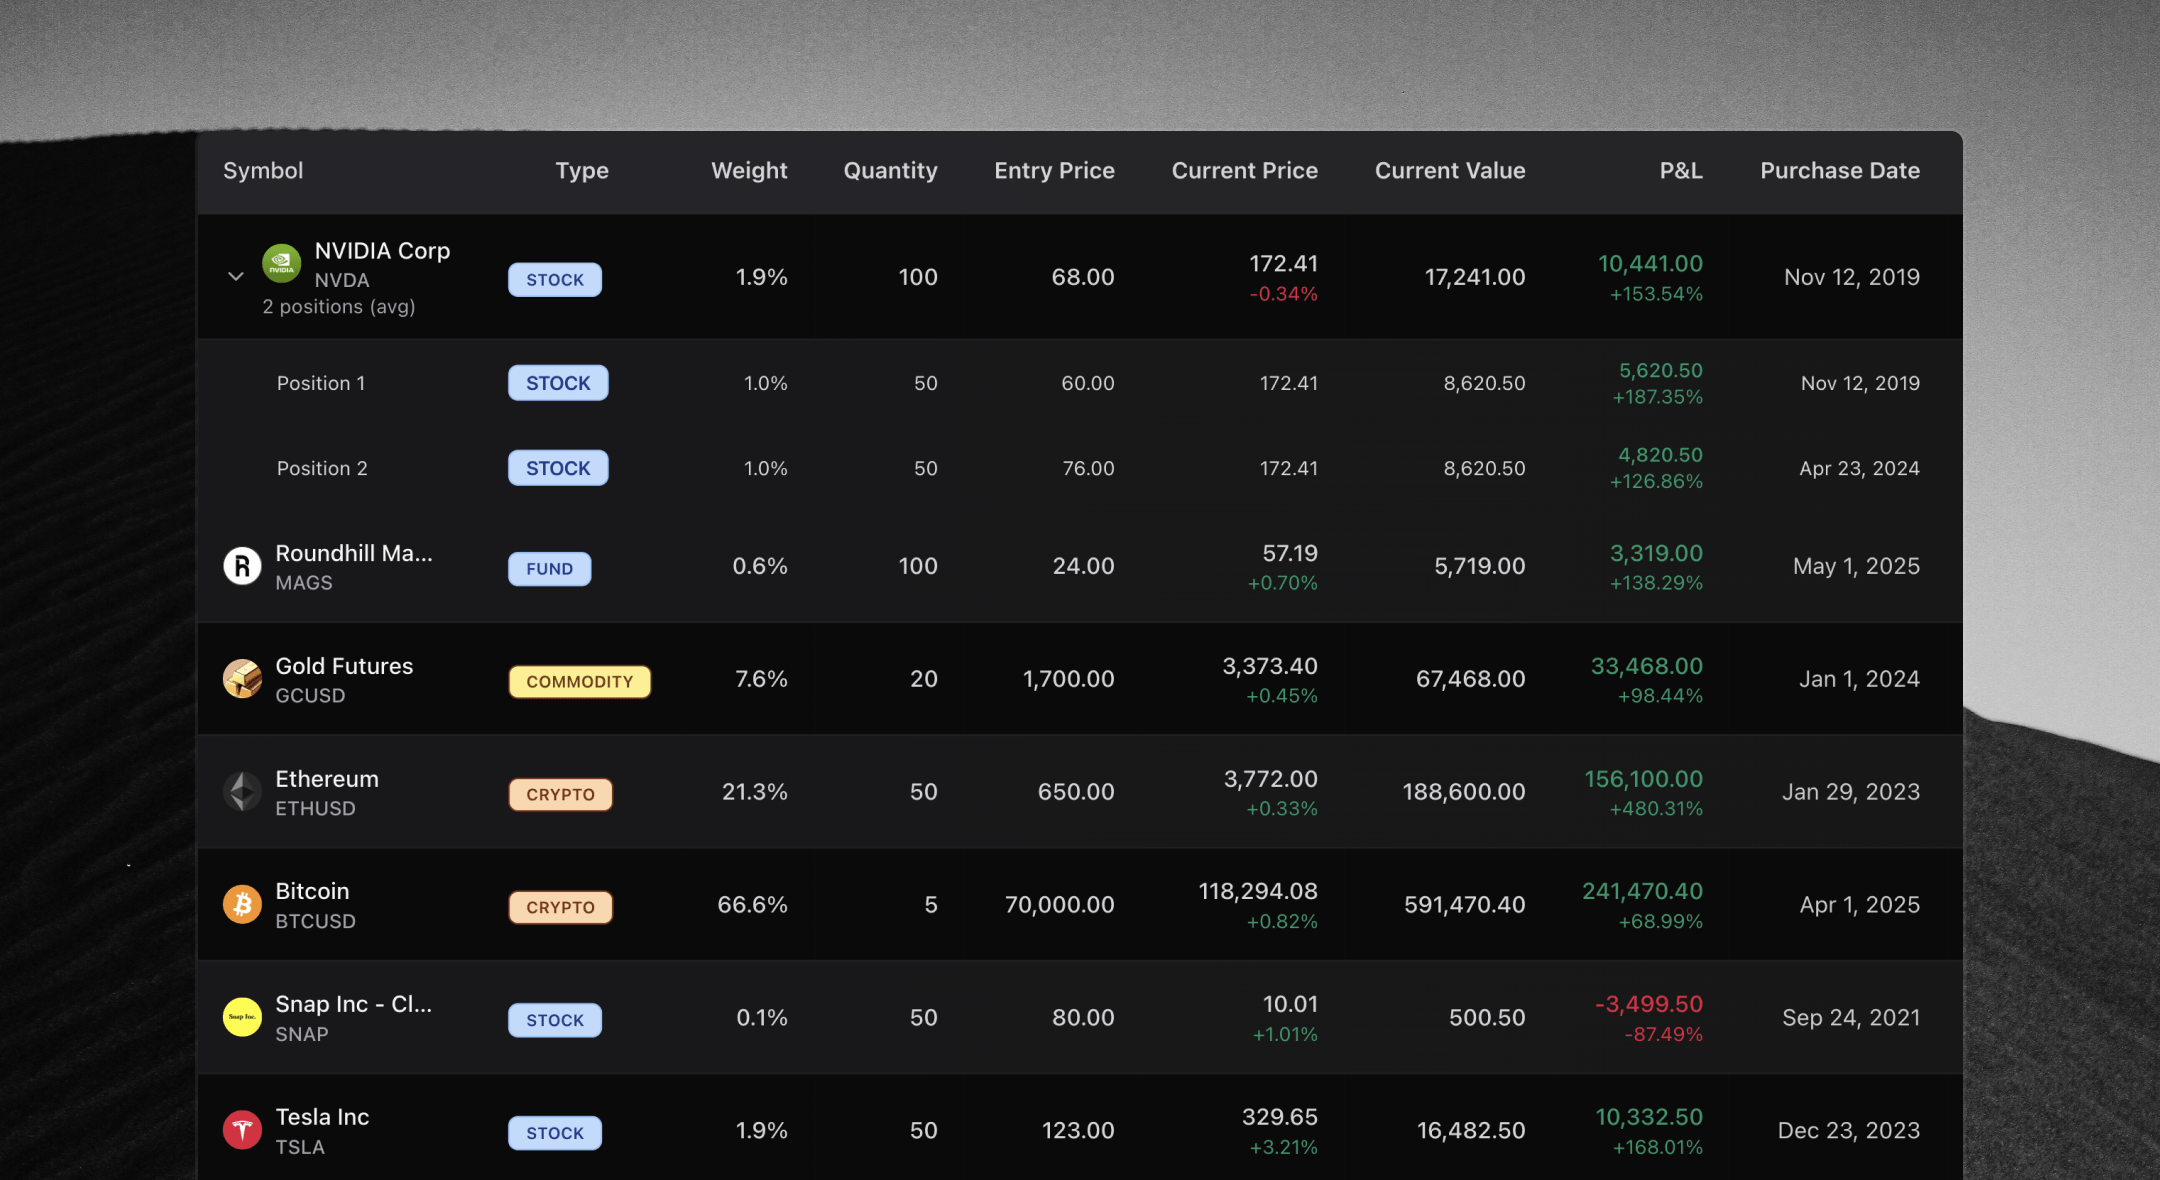
Portfolio Visualizer
Track stocks, crypto, ETFs and funds. Benchmark against global indices in one unified view.
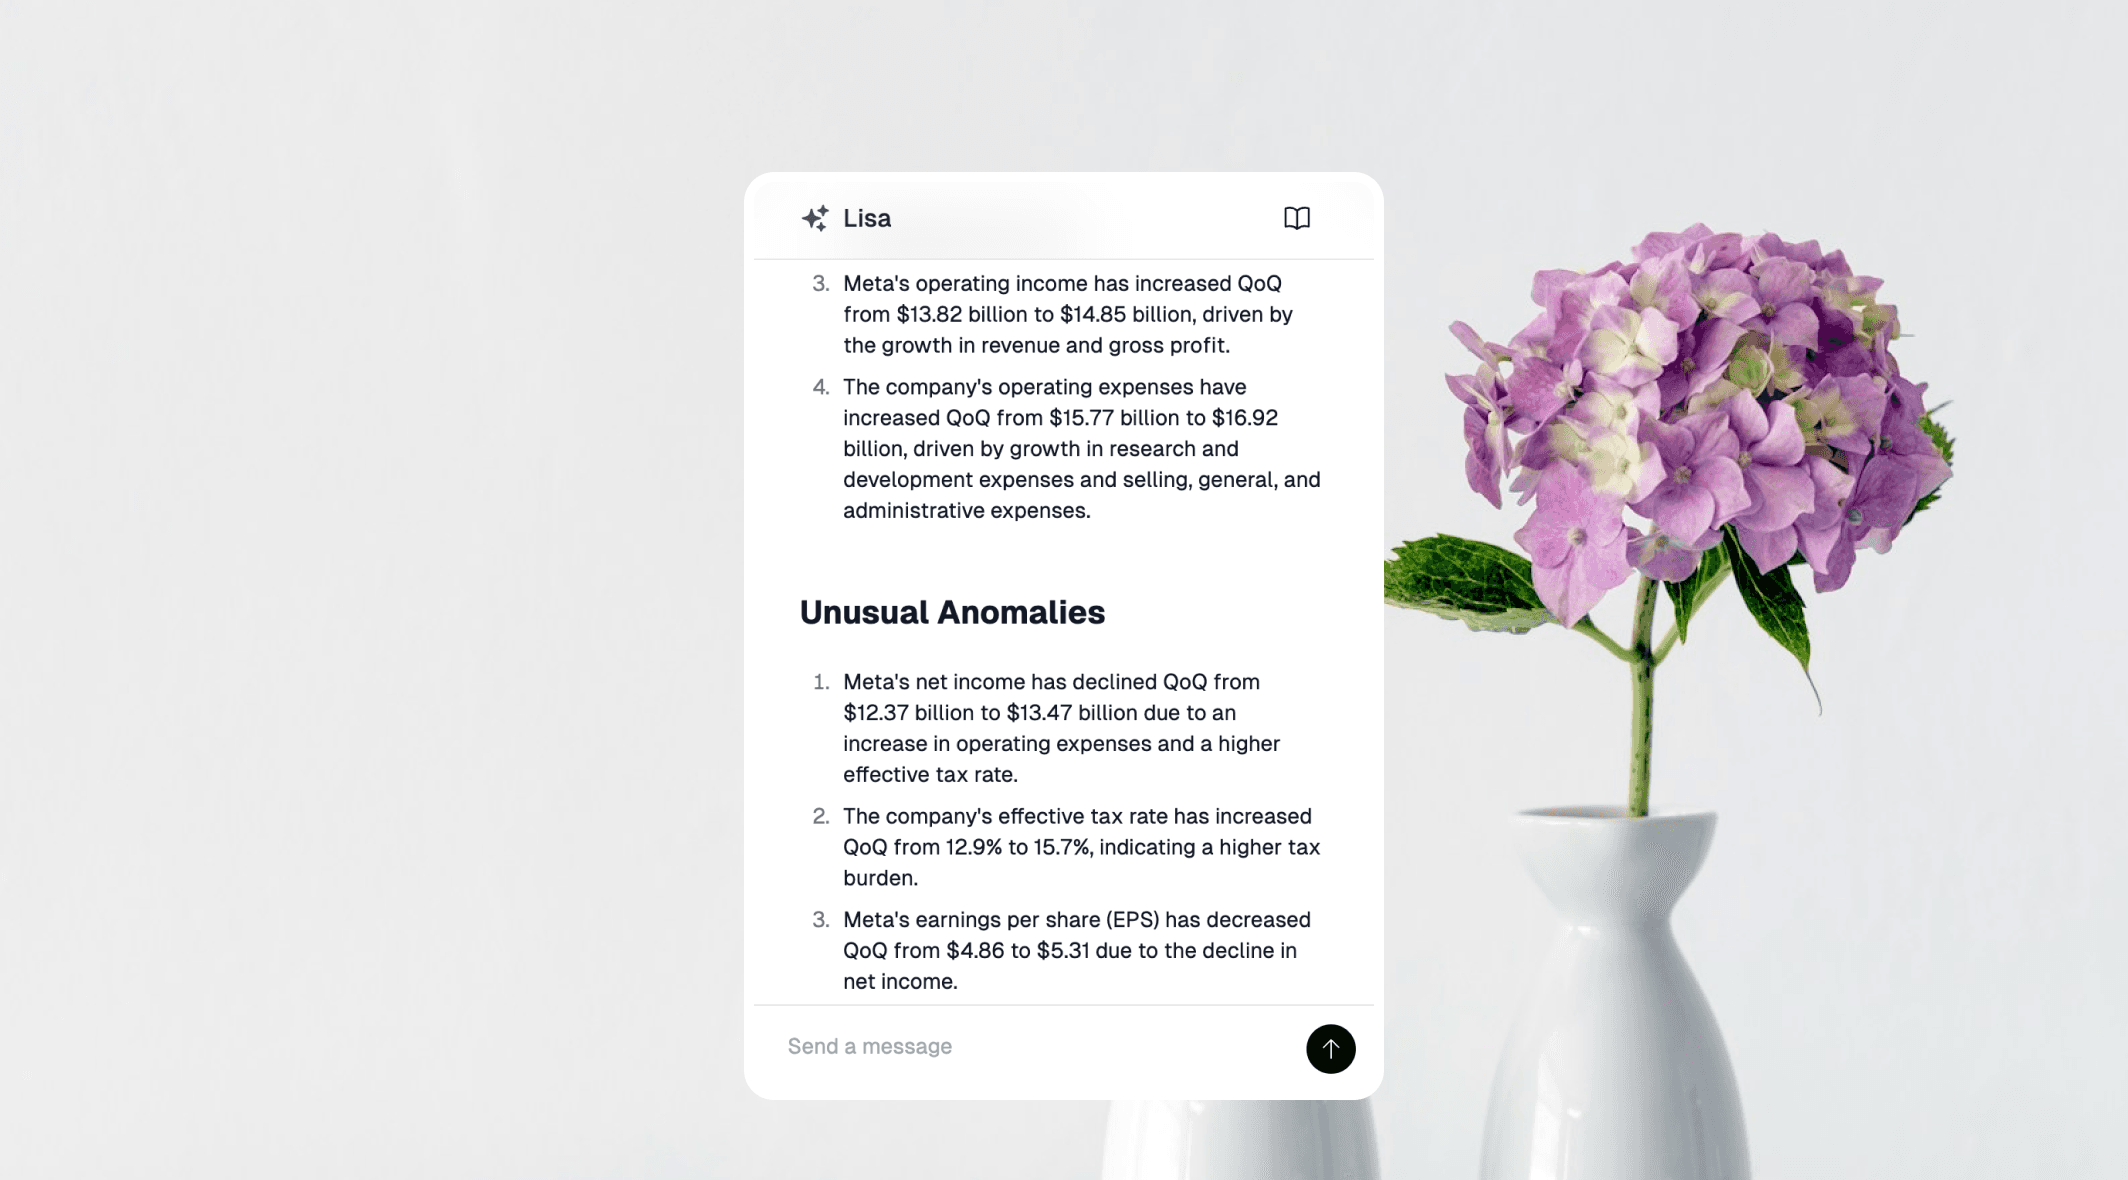
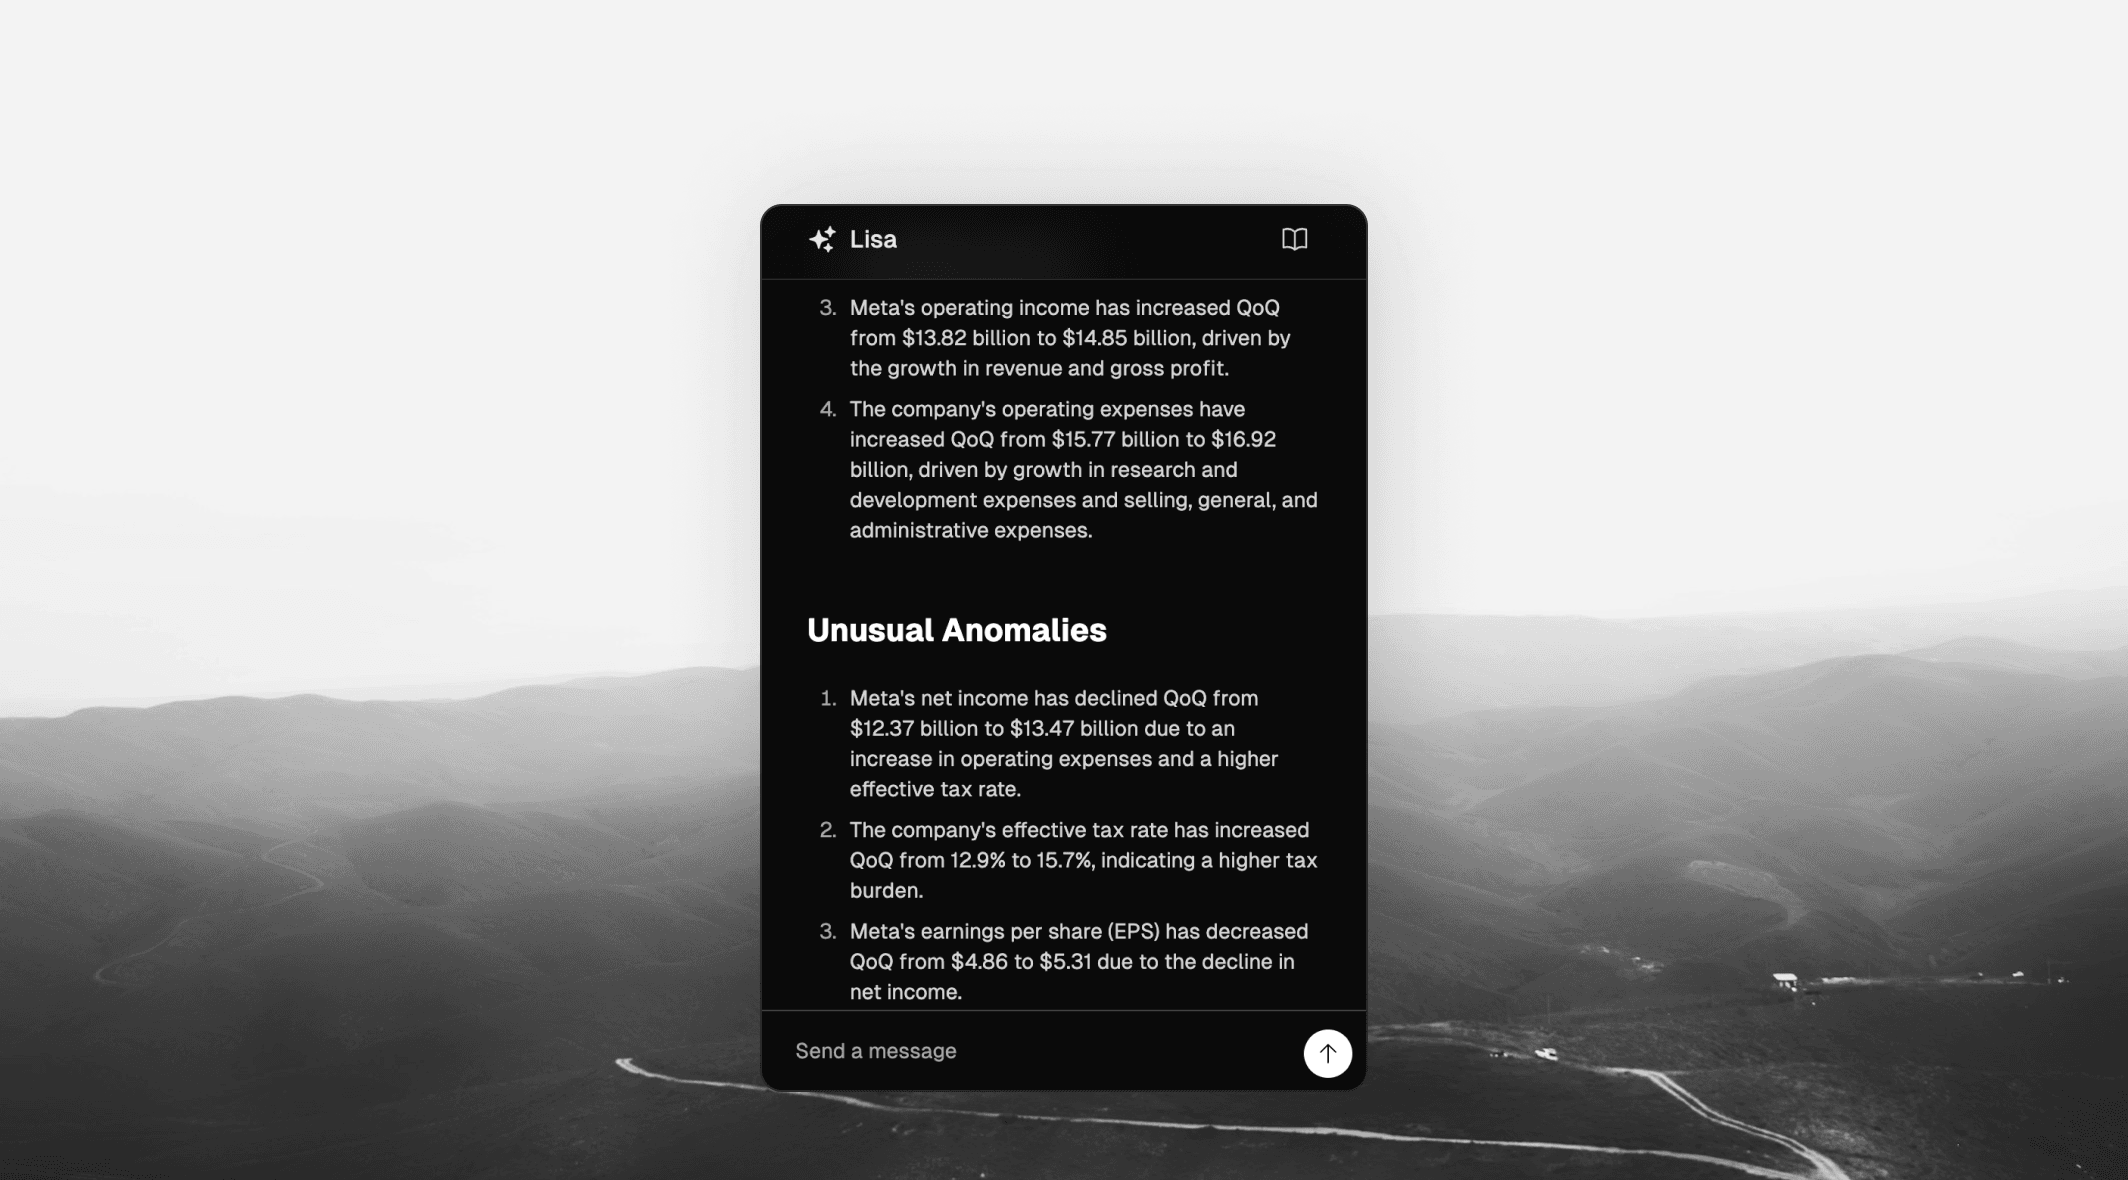
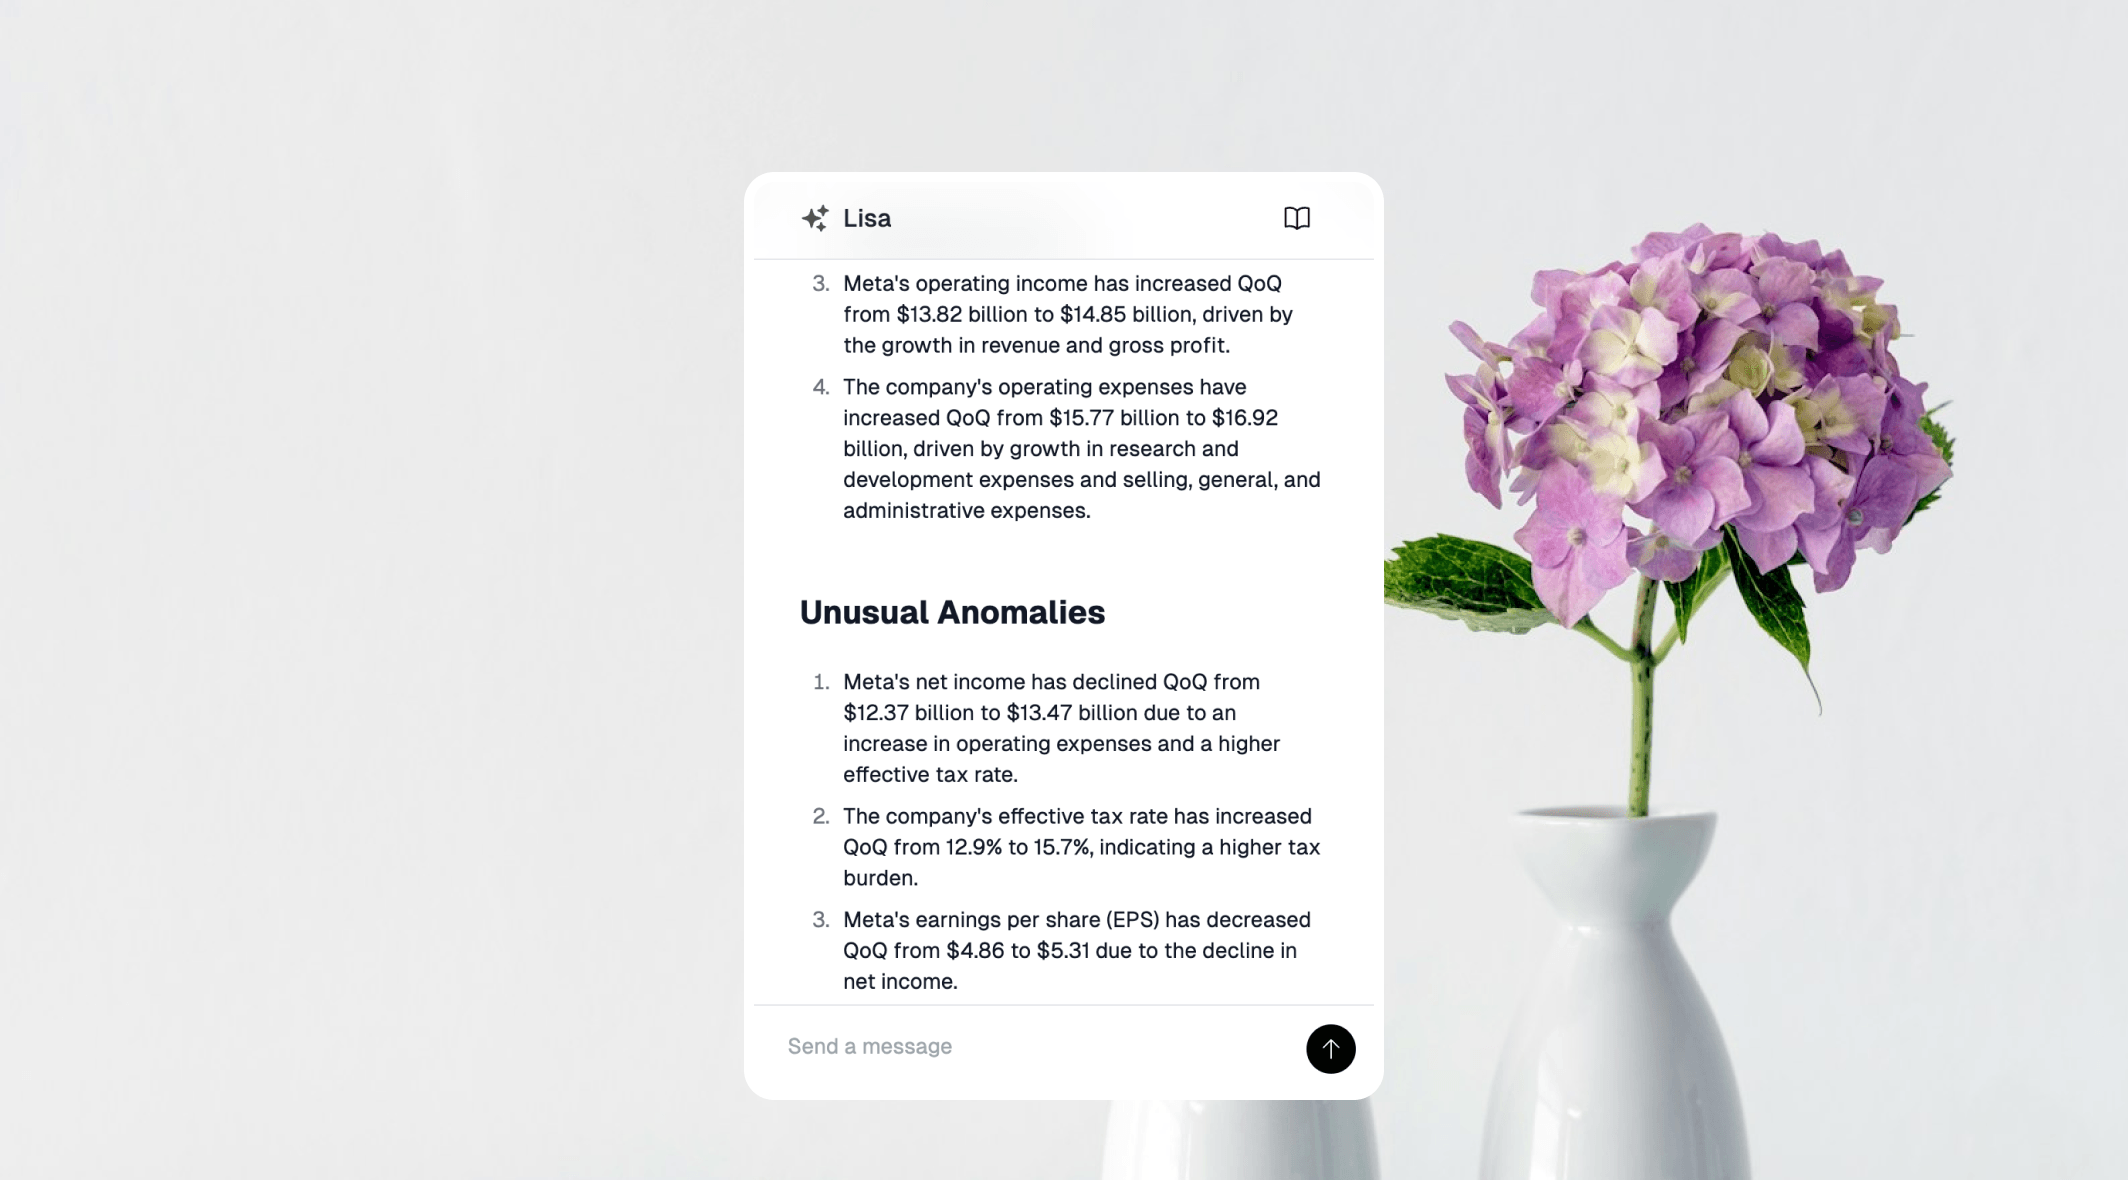
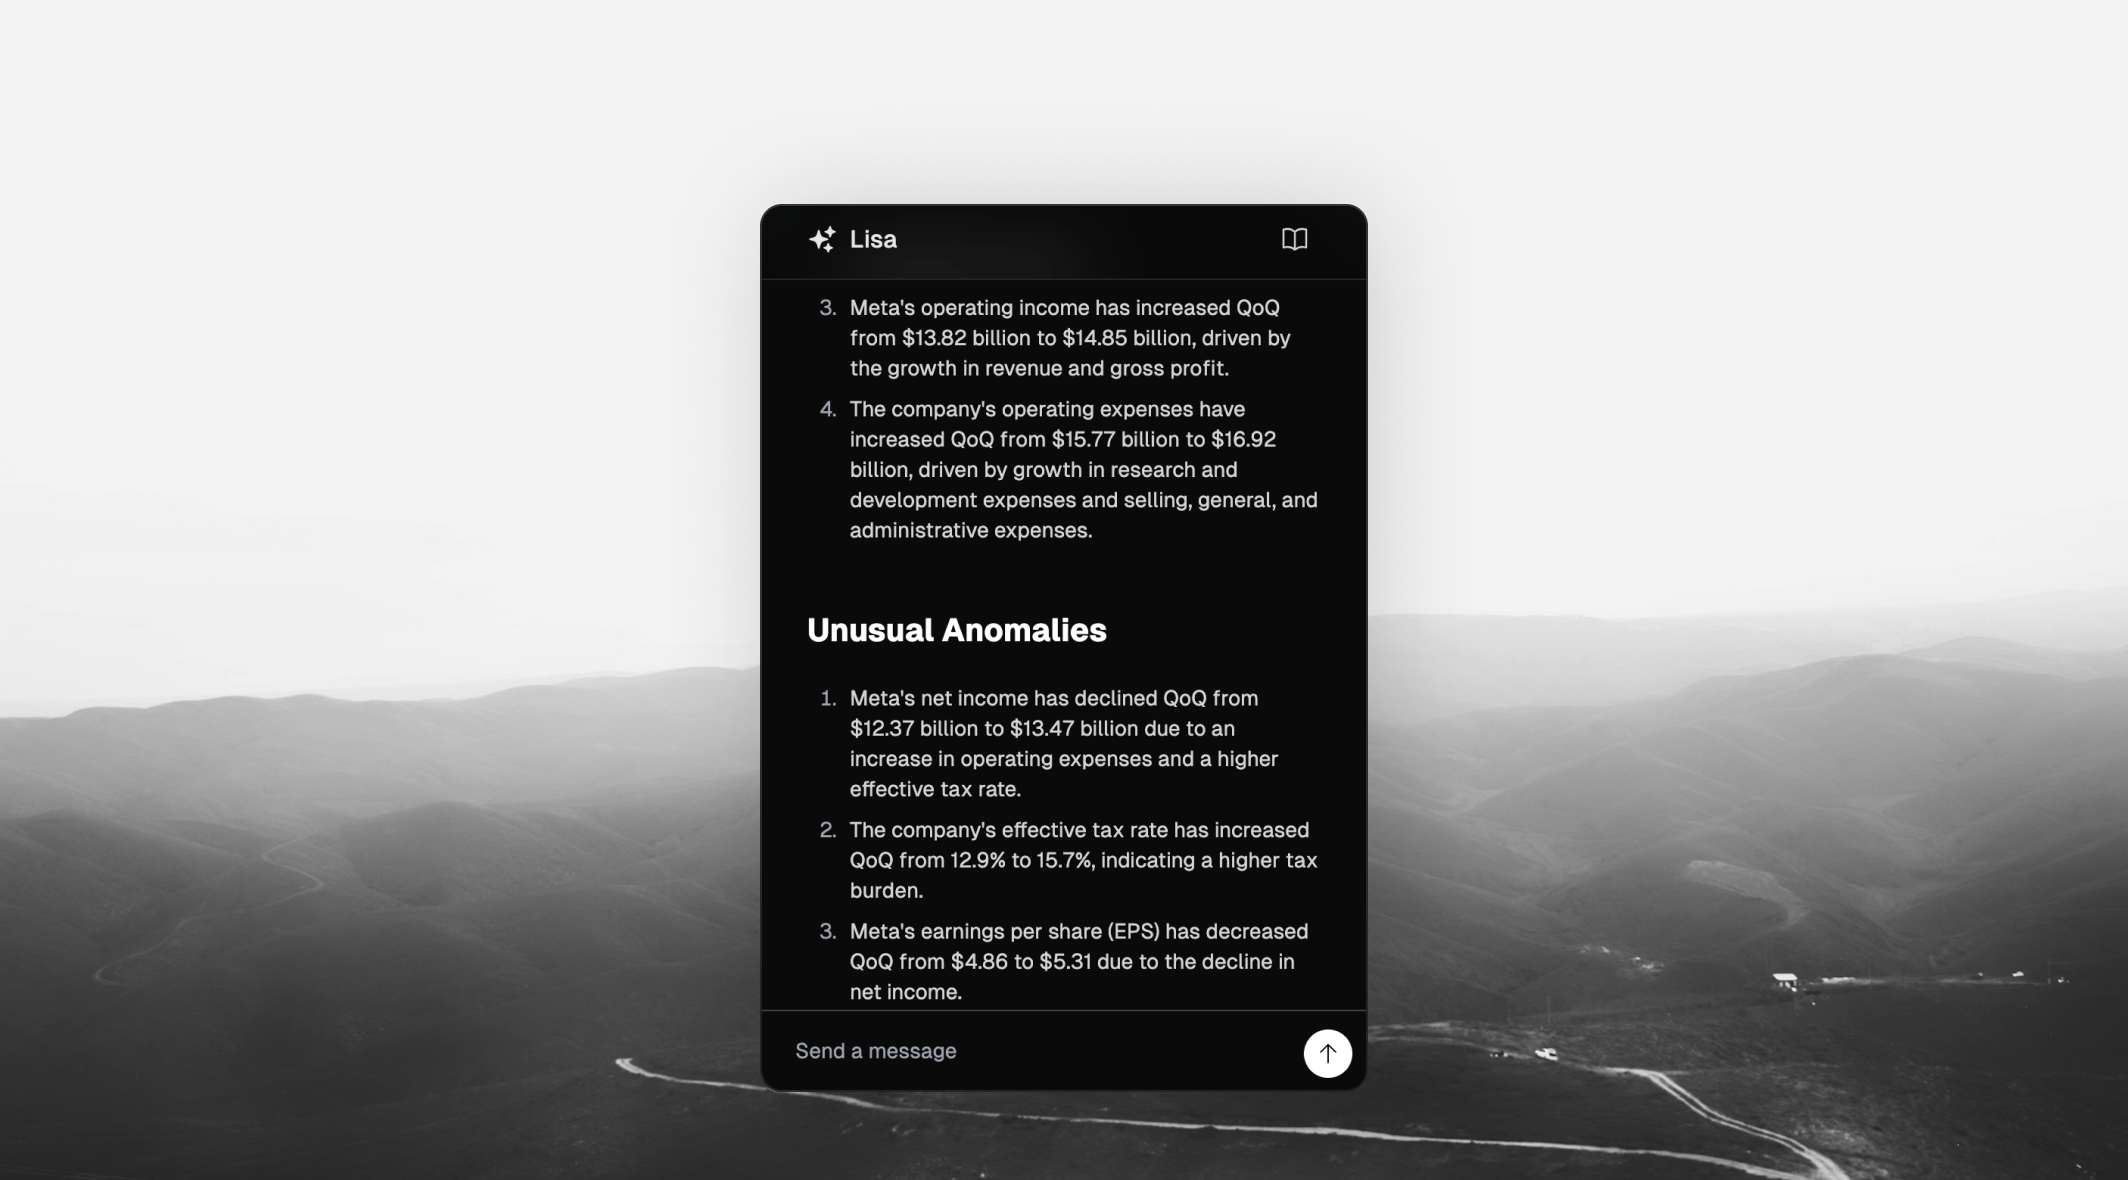
Lisa AI
Your AI analyst, native across the platform — from screening to deep-dive research.
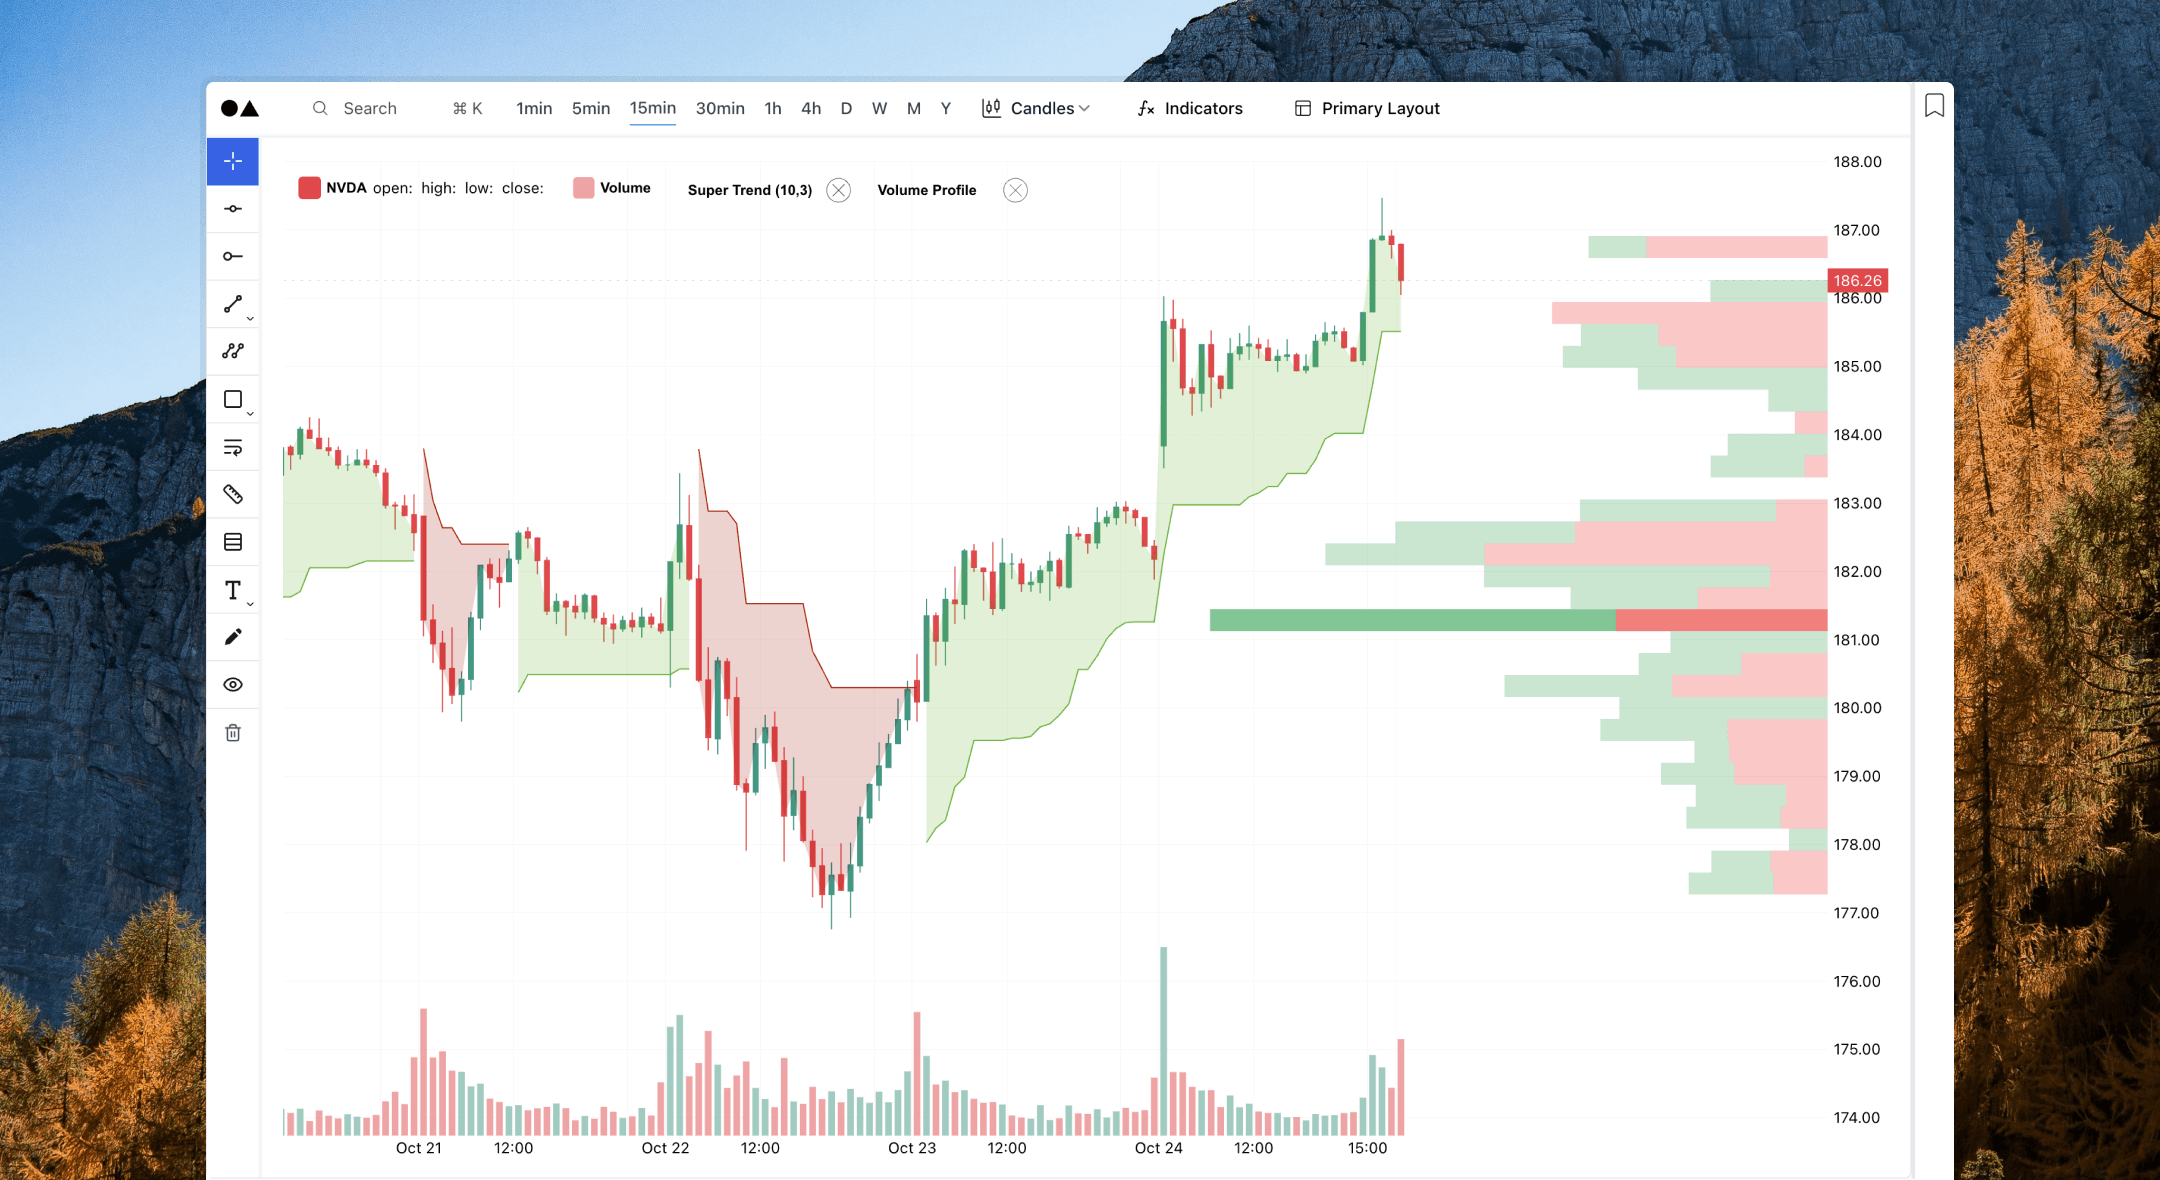
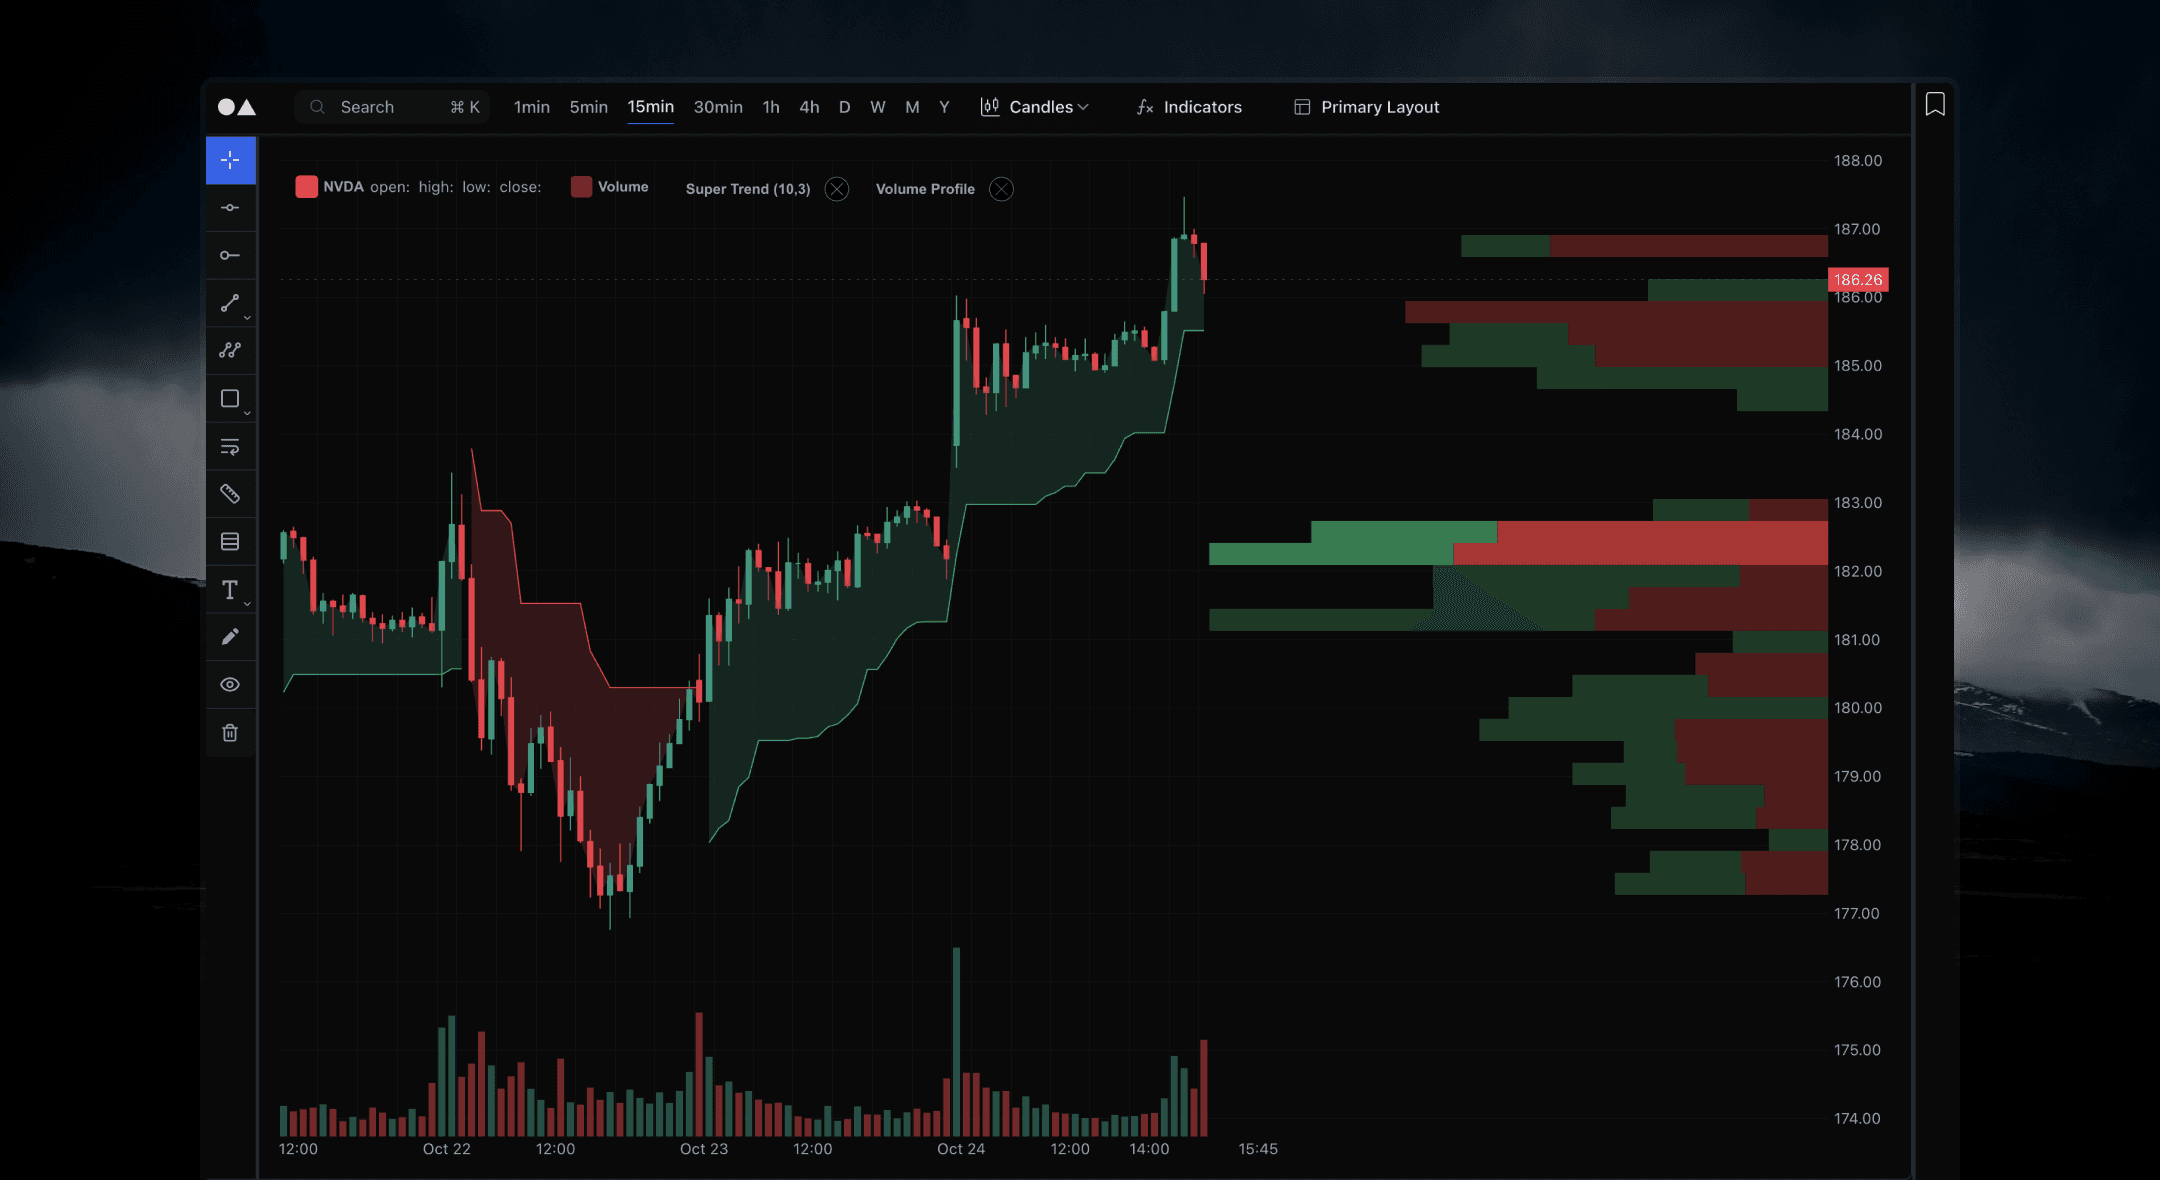
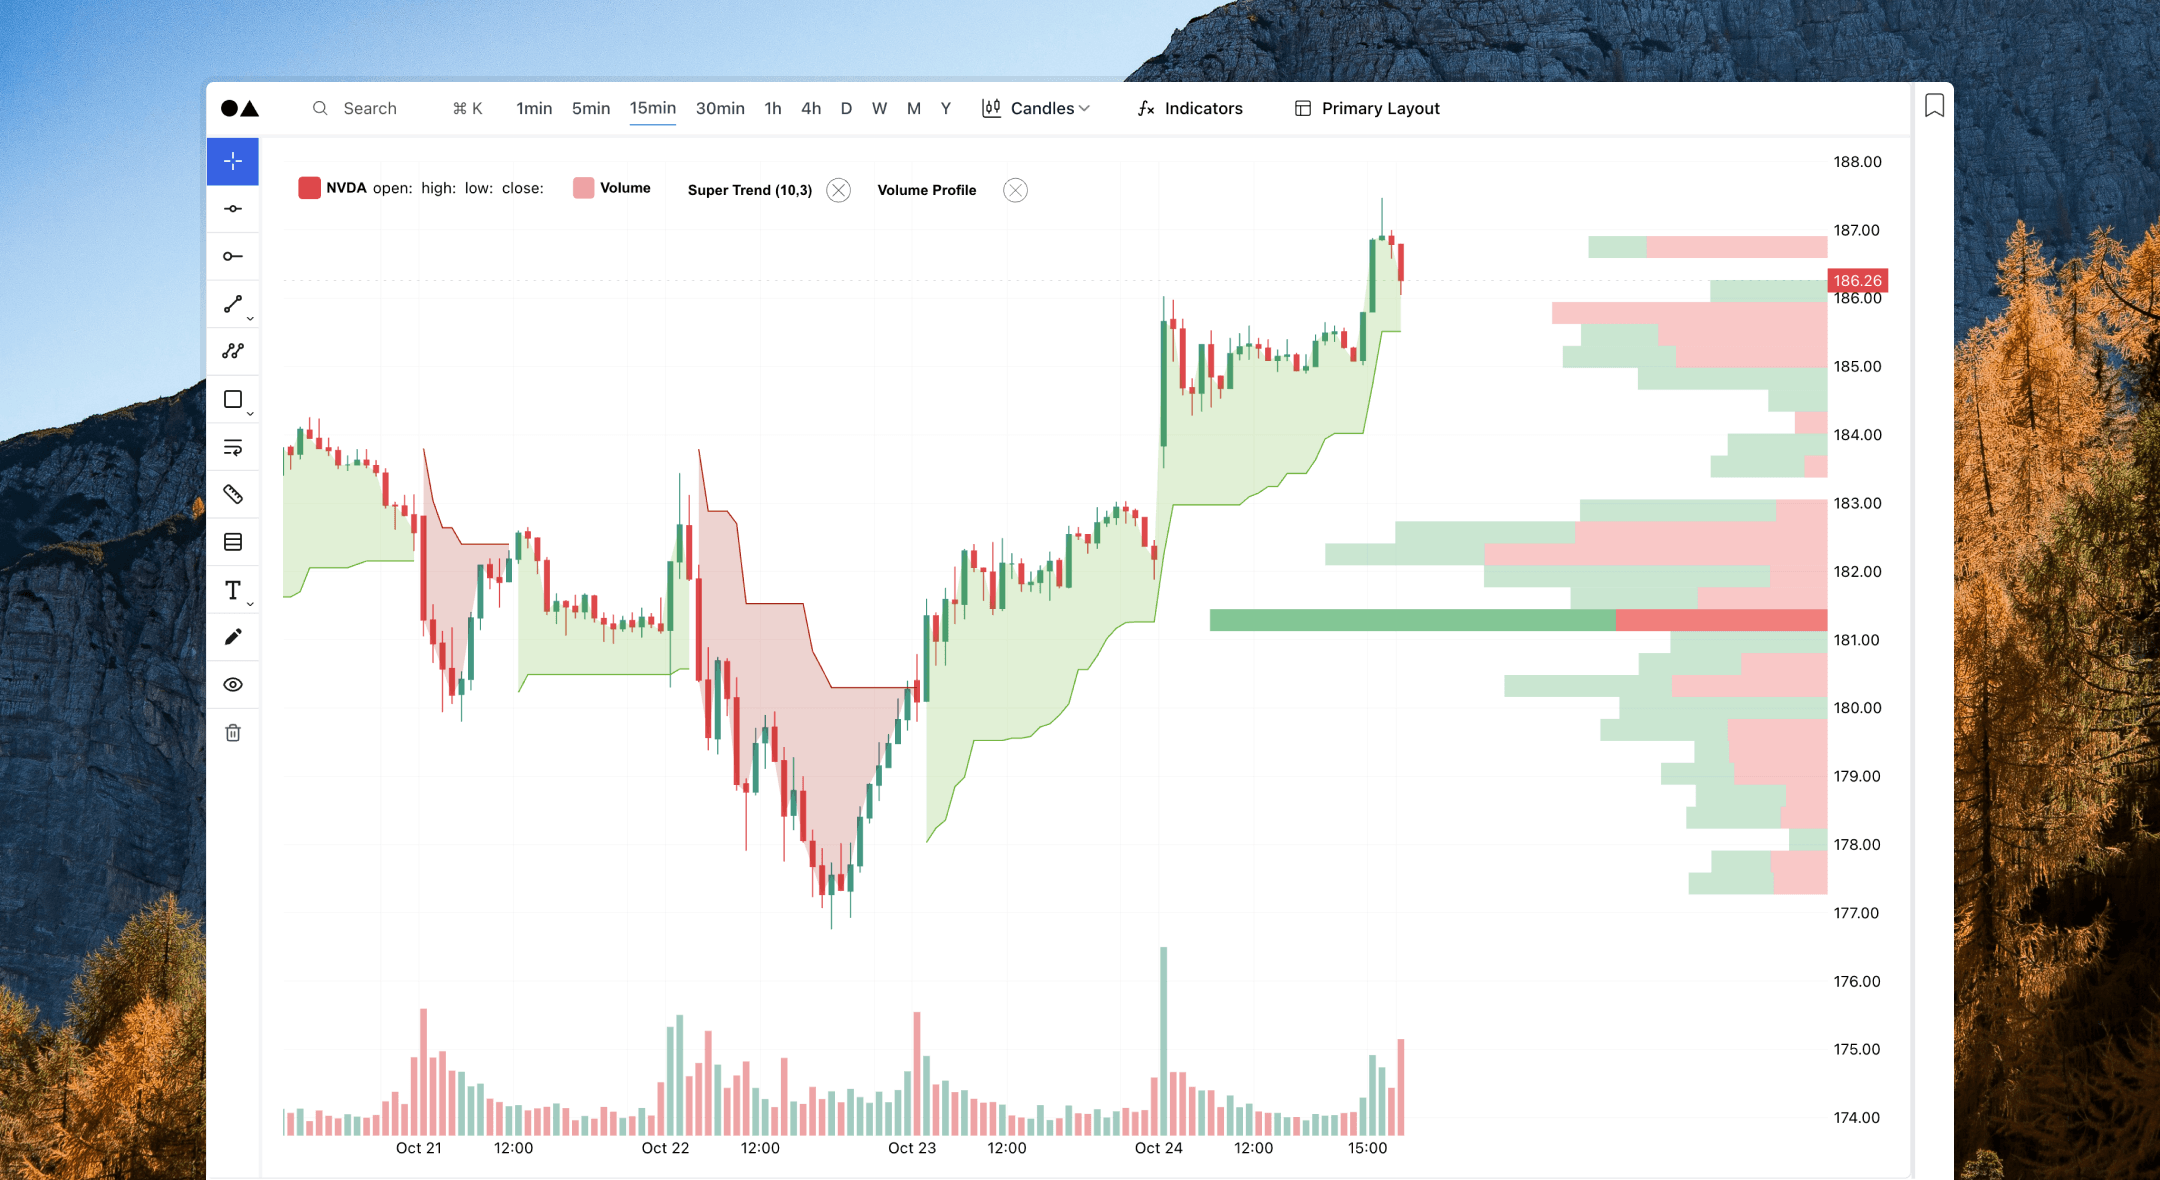
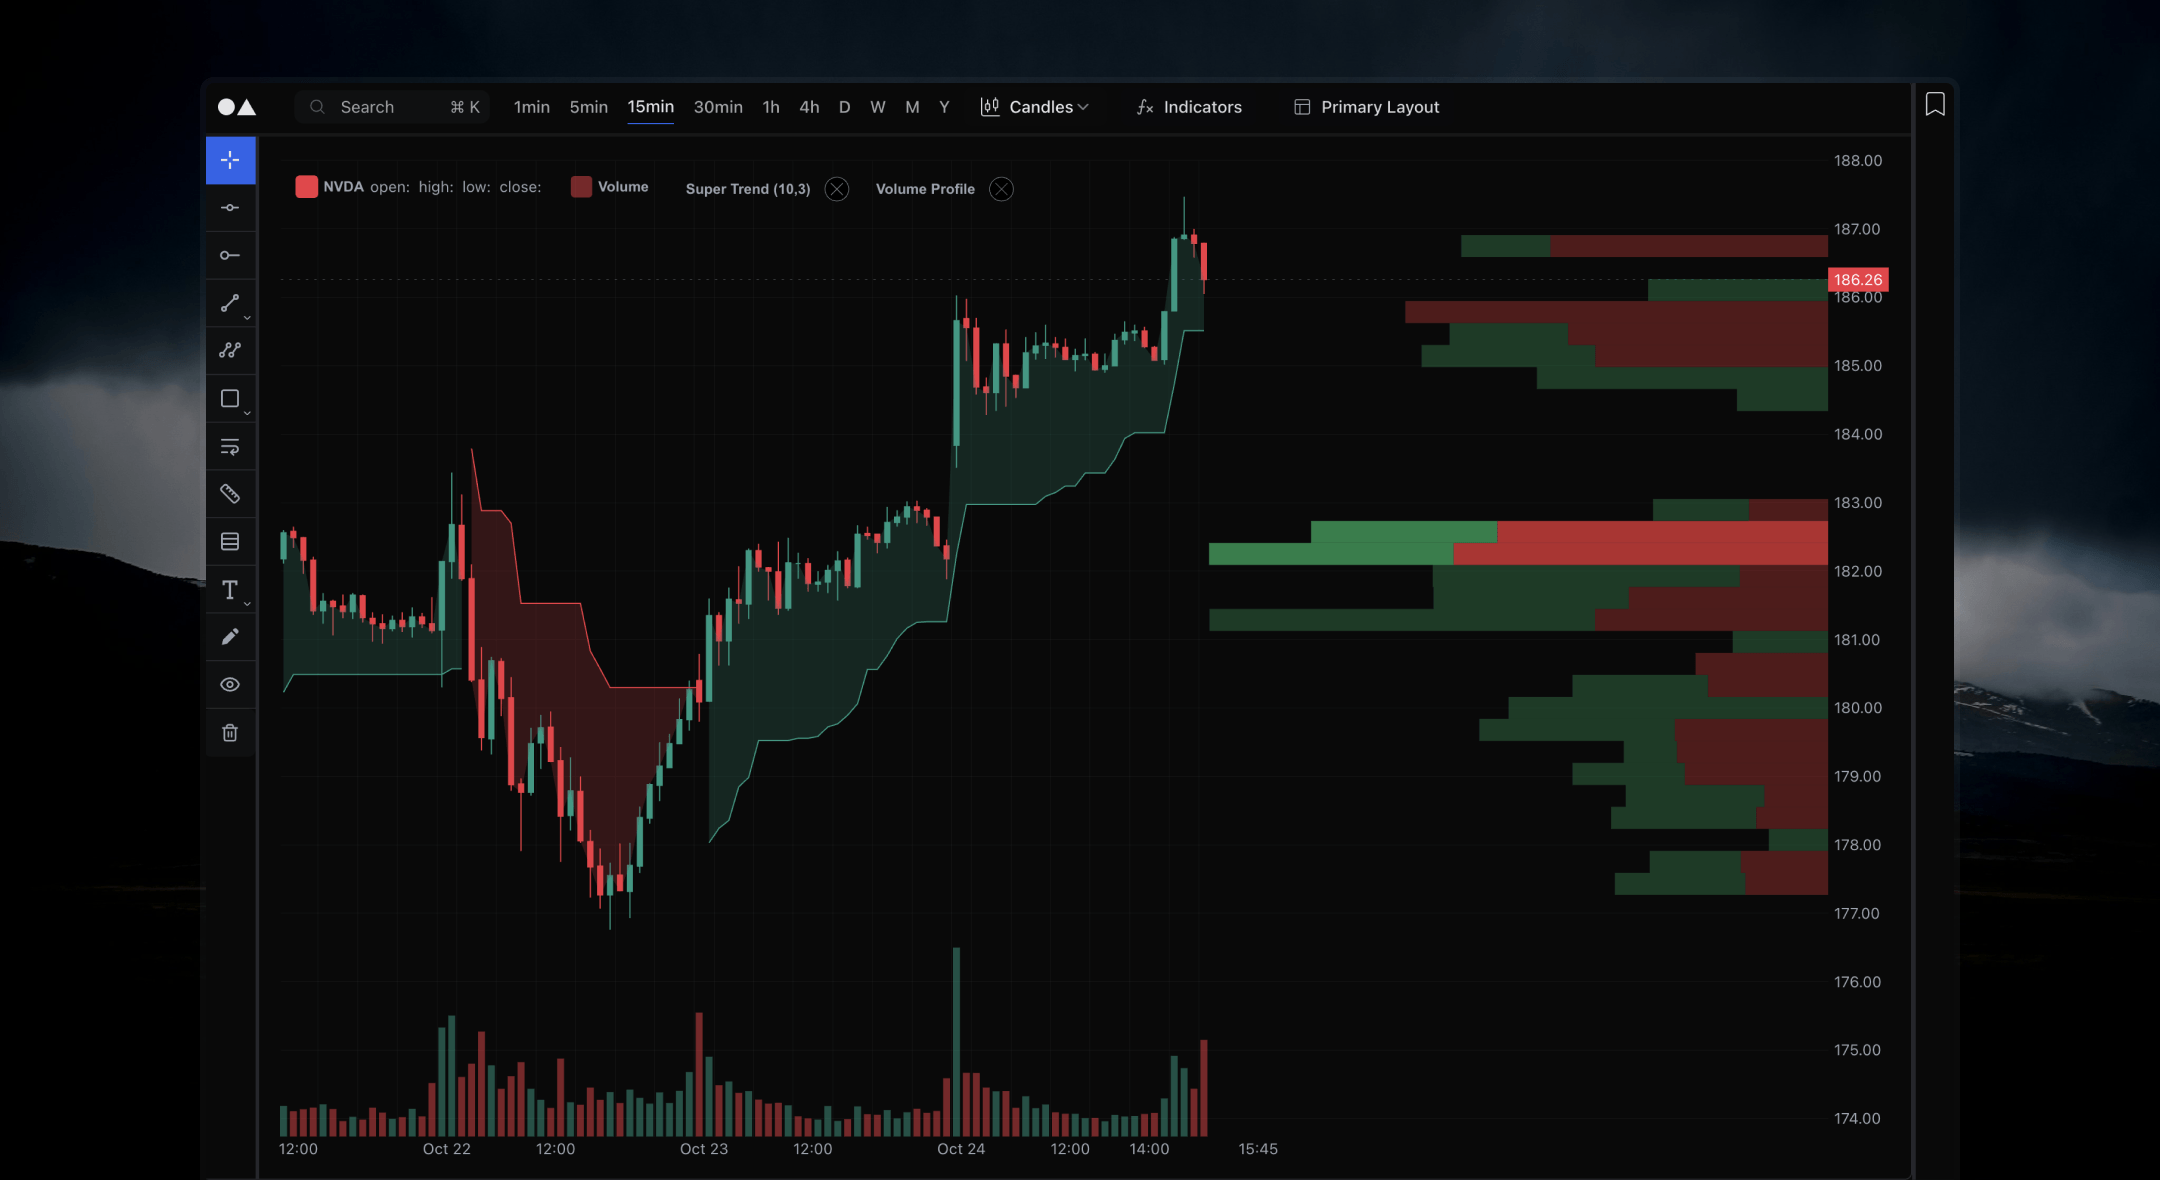
Advanced Charts
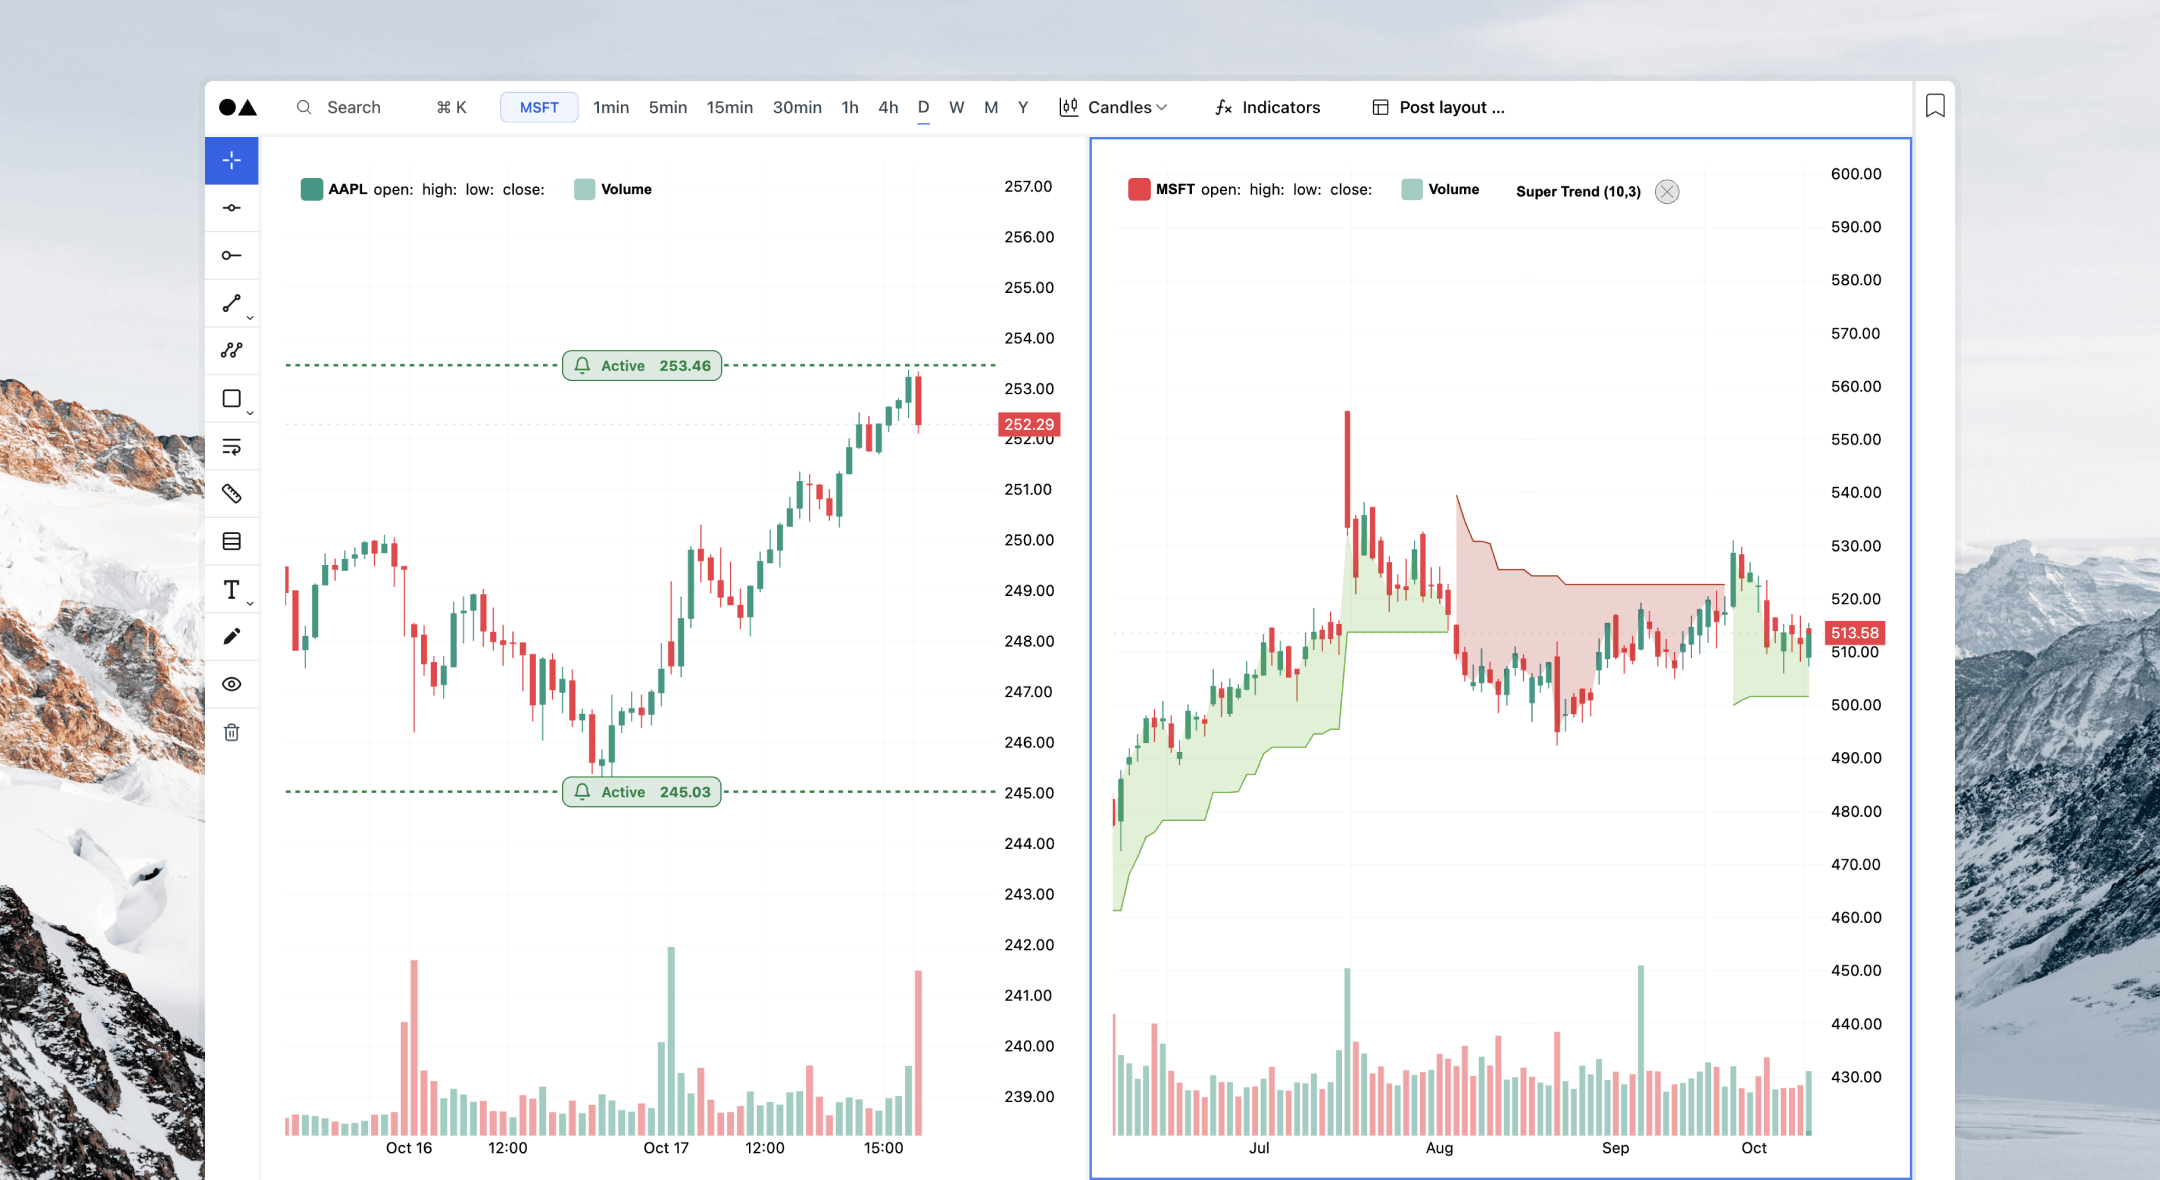
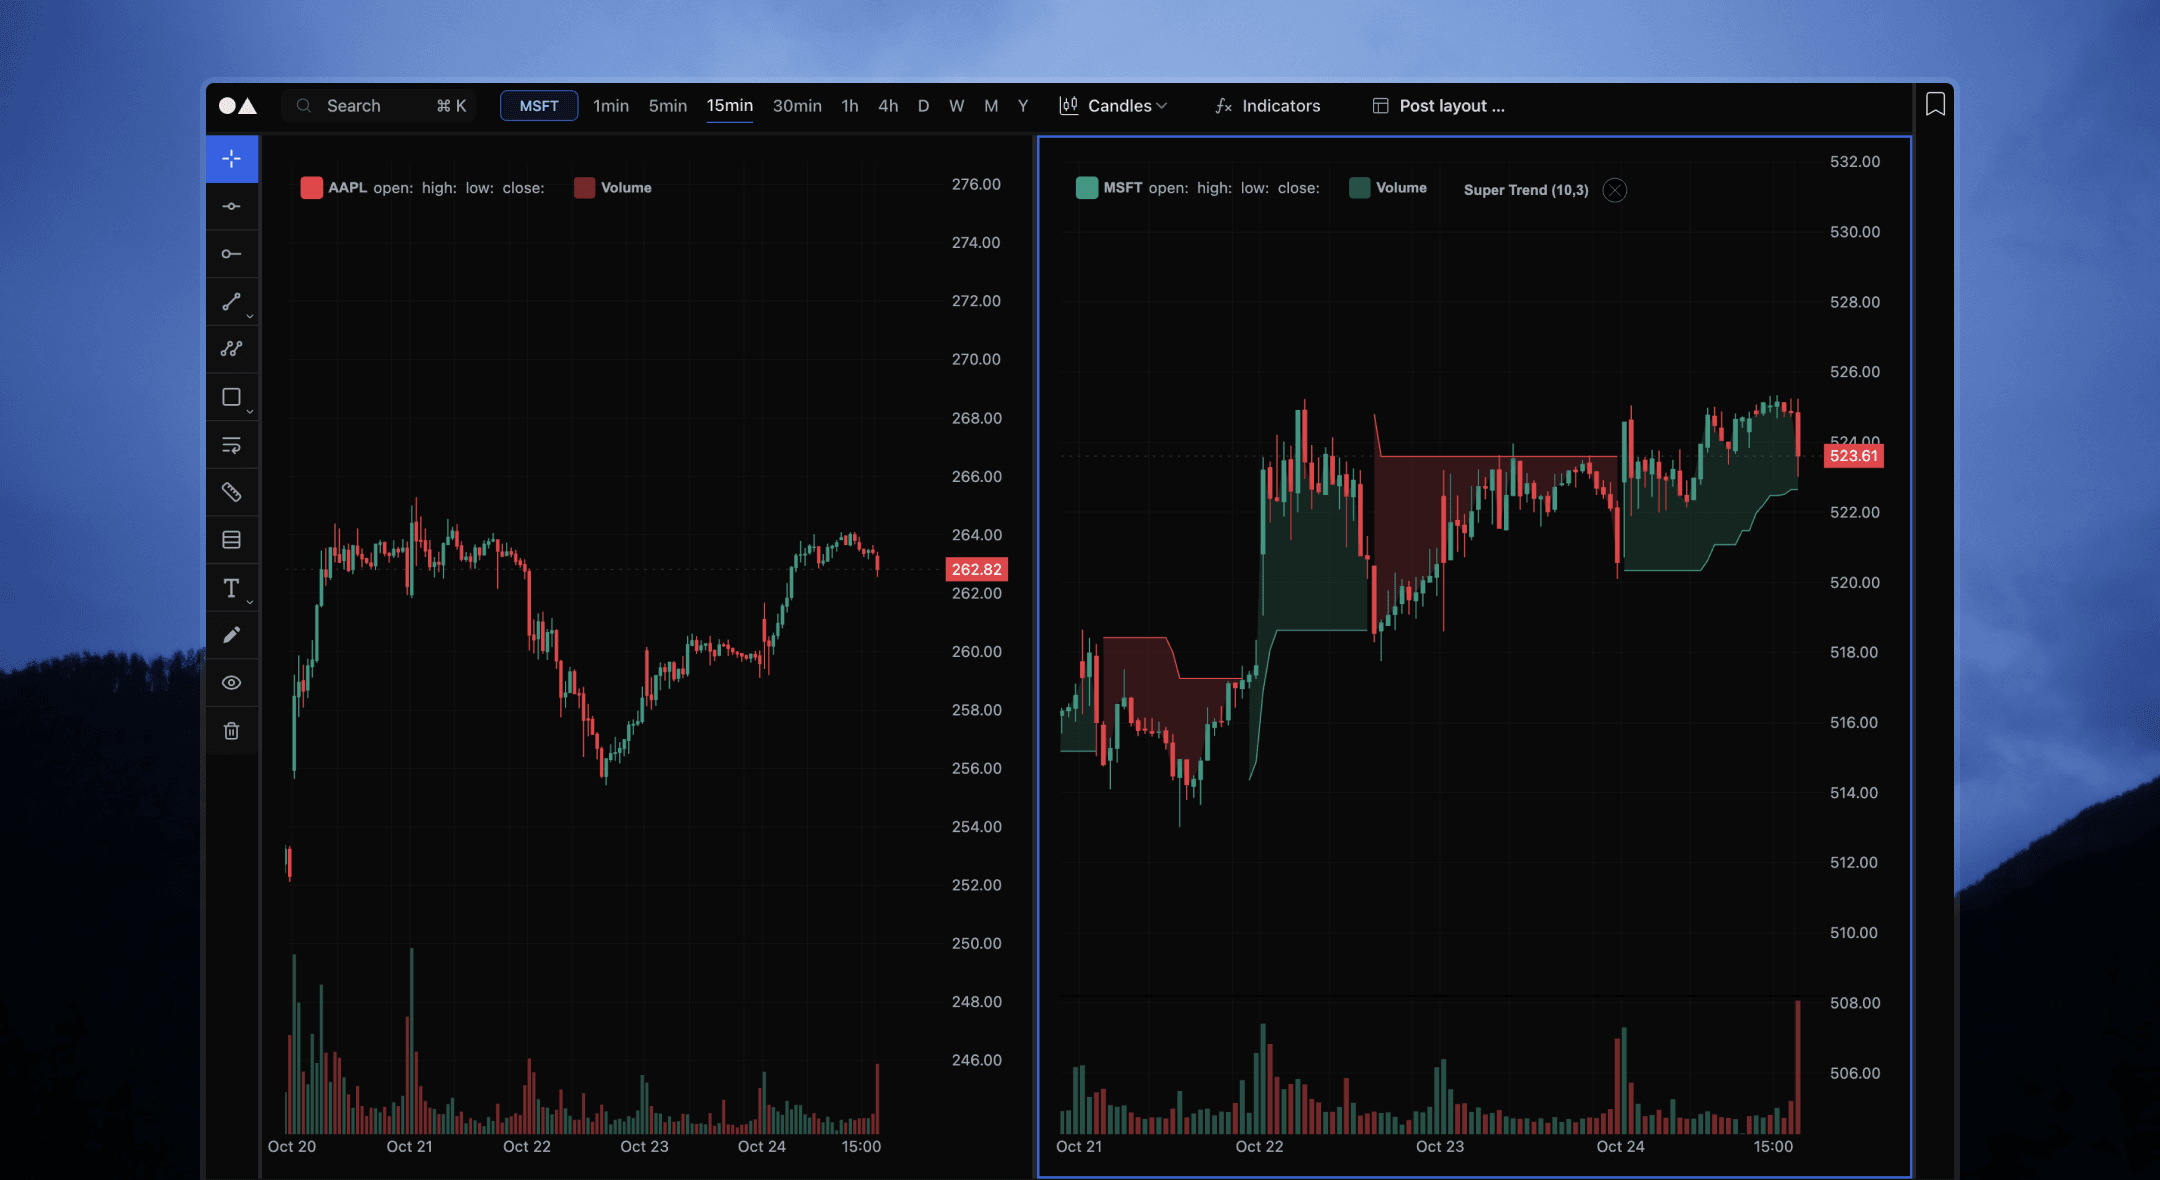
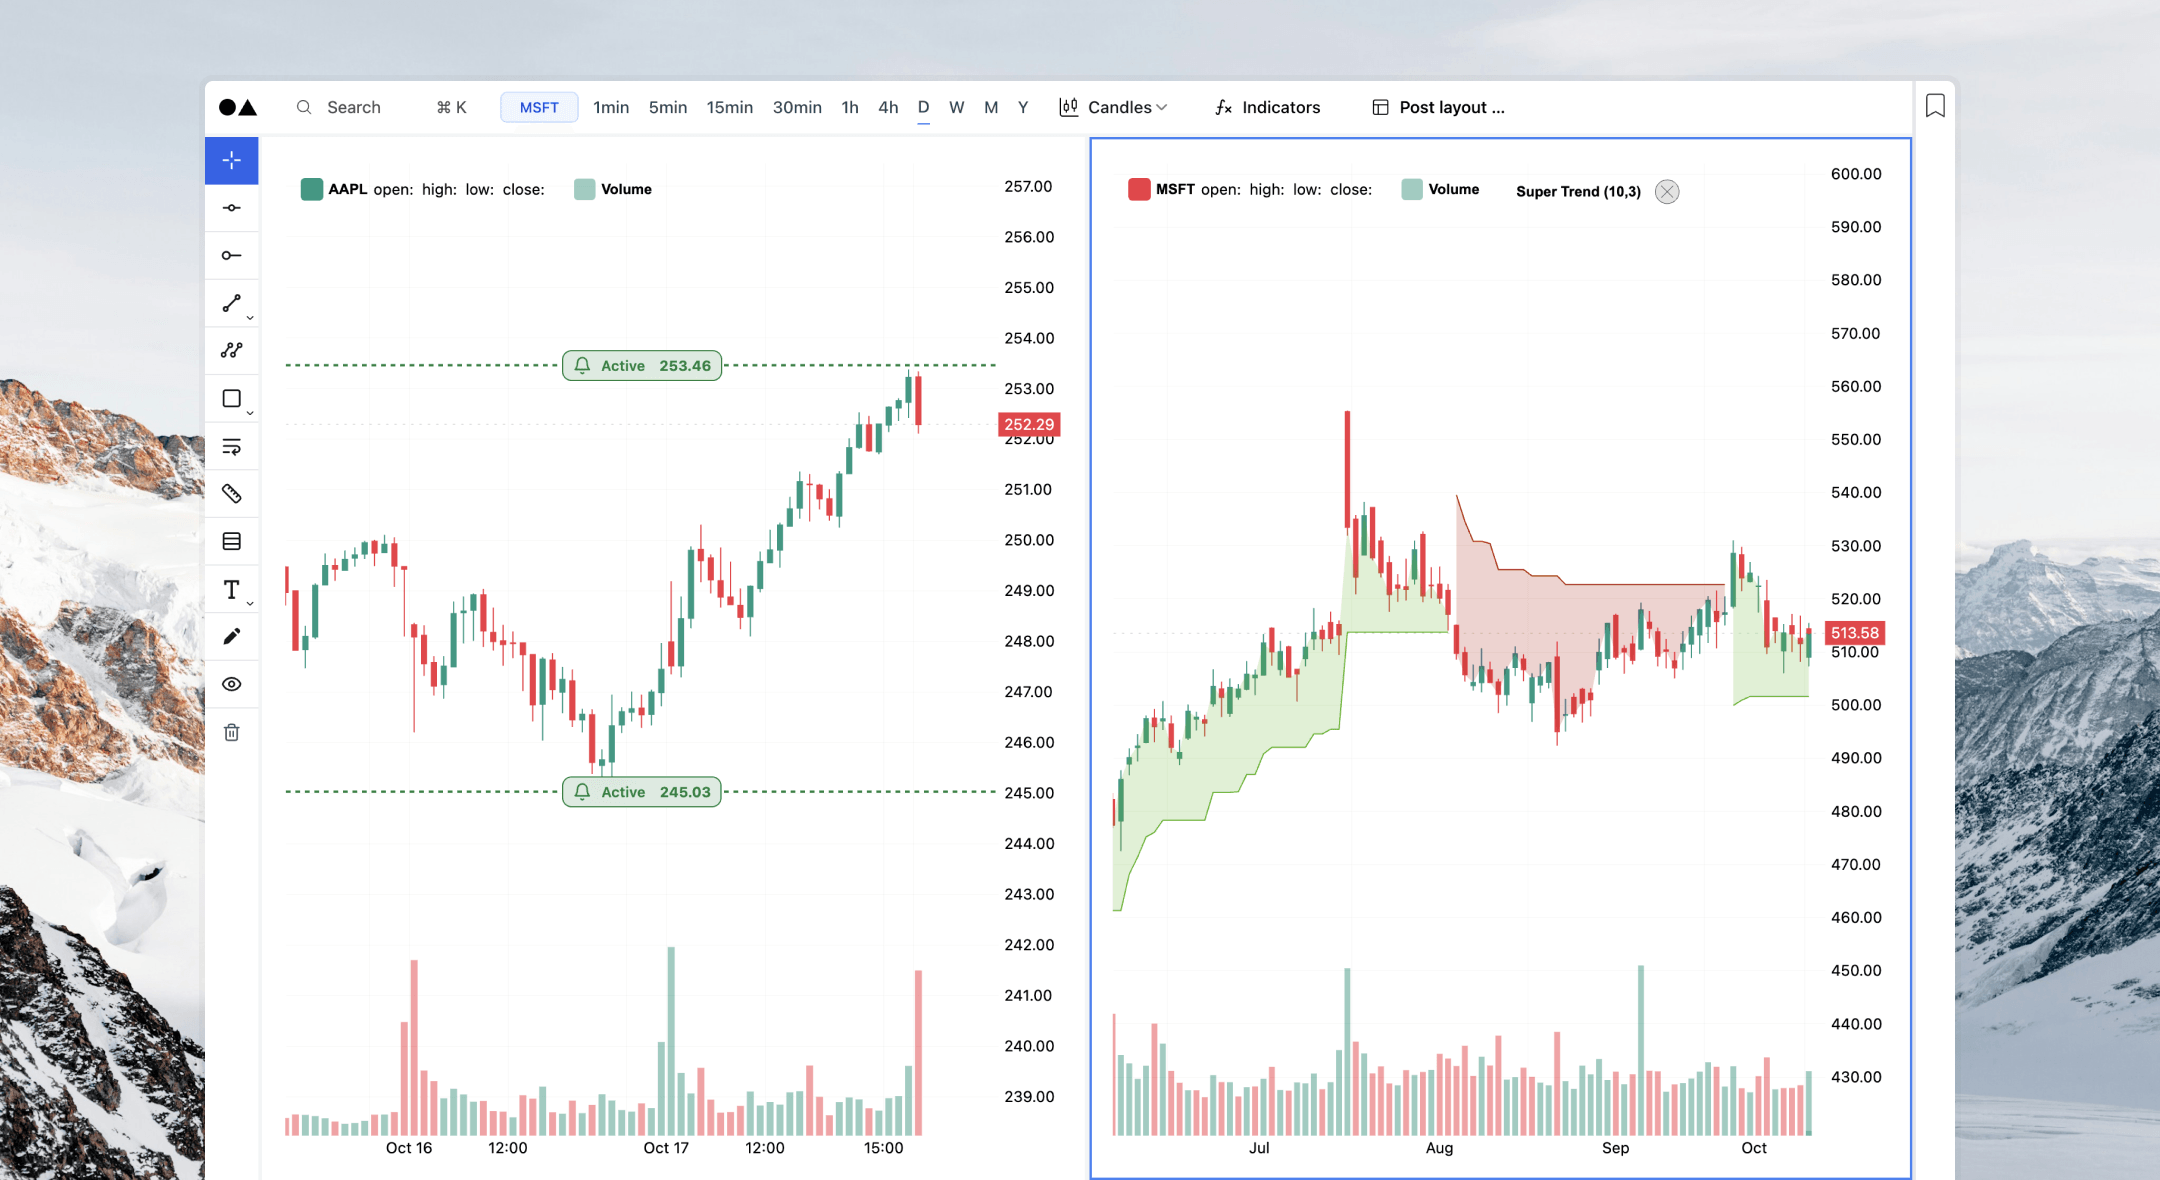
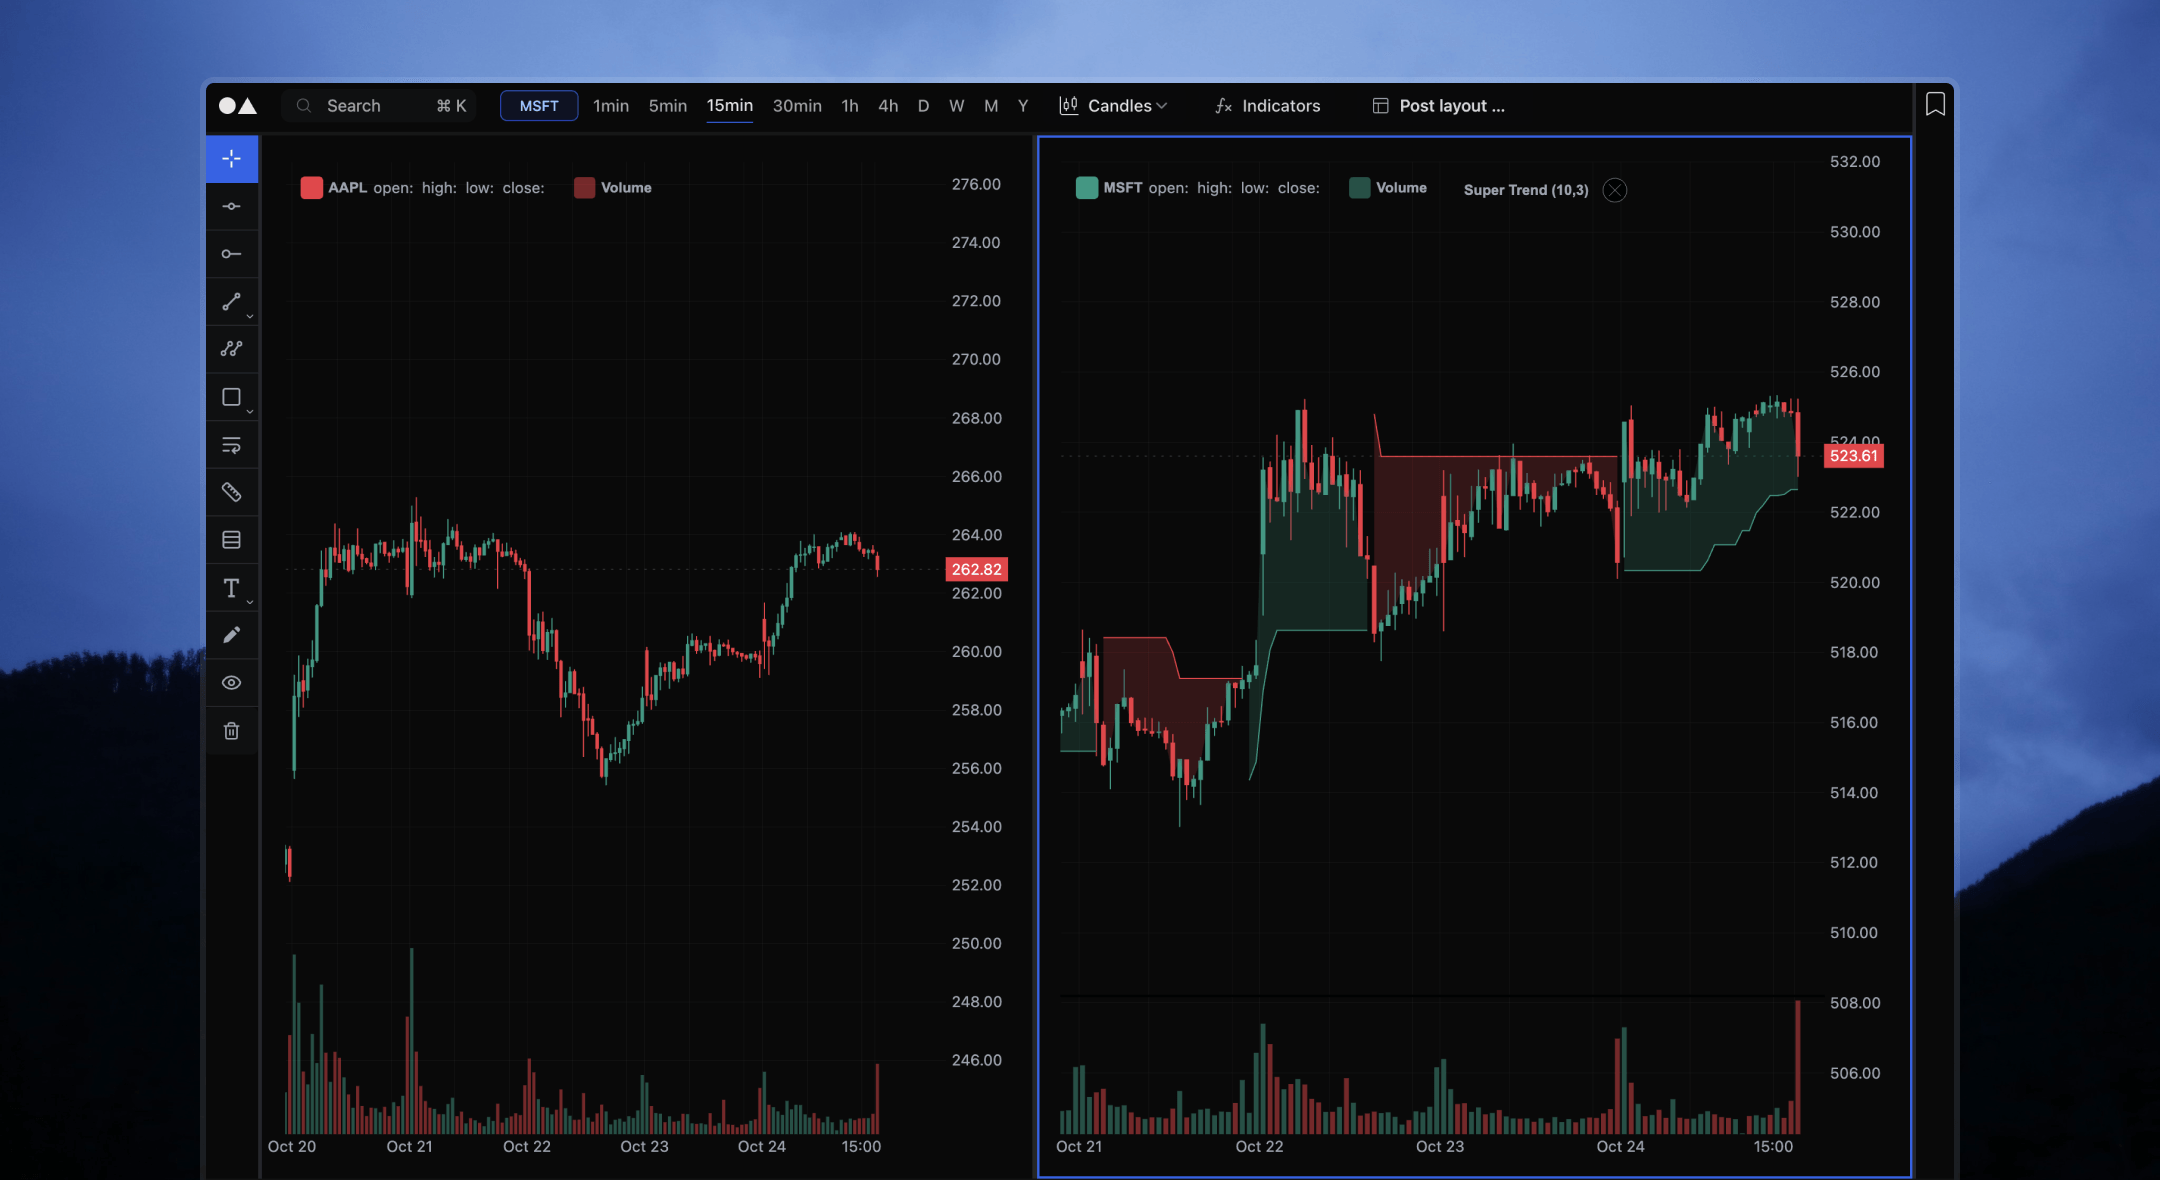
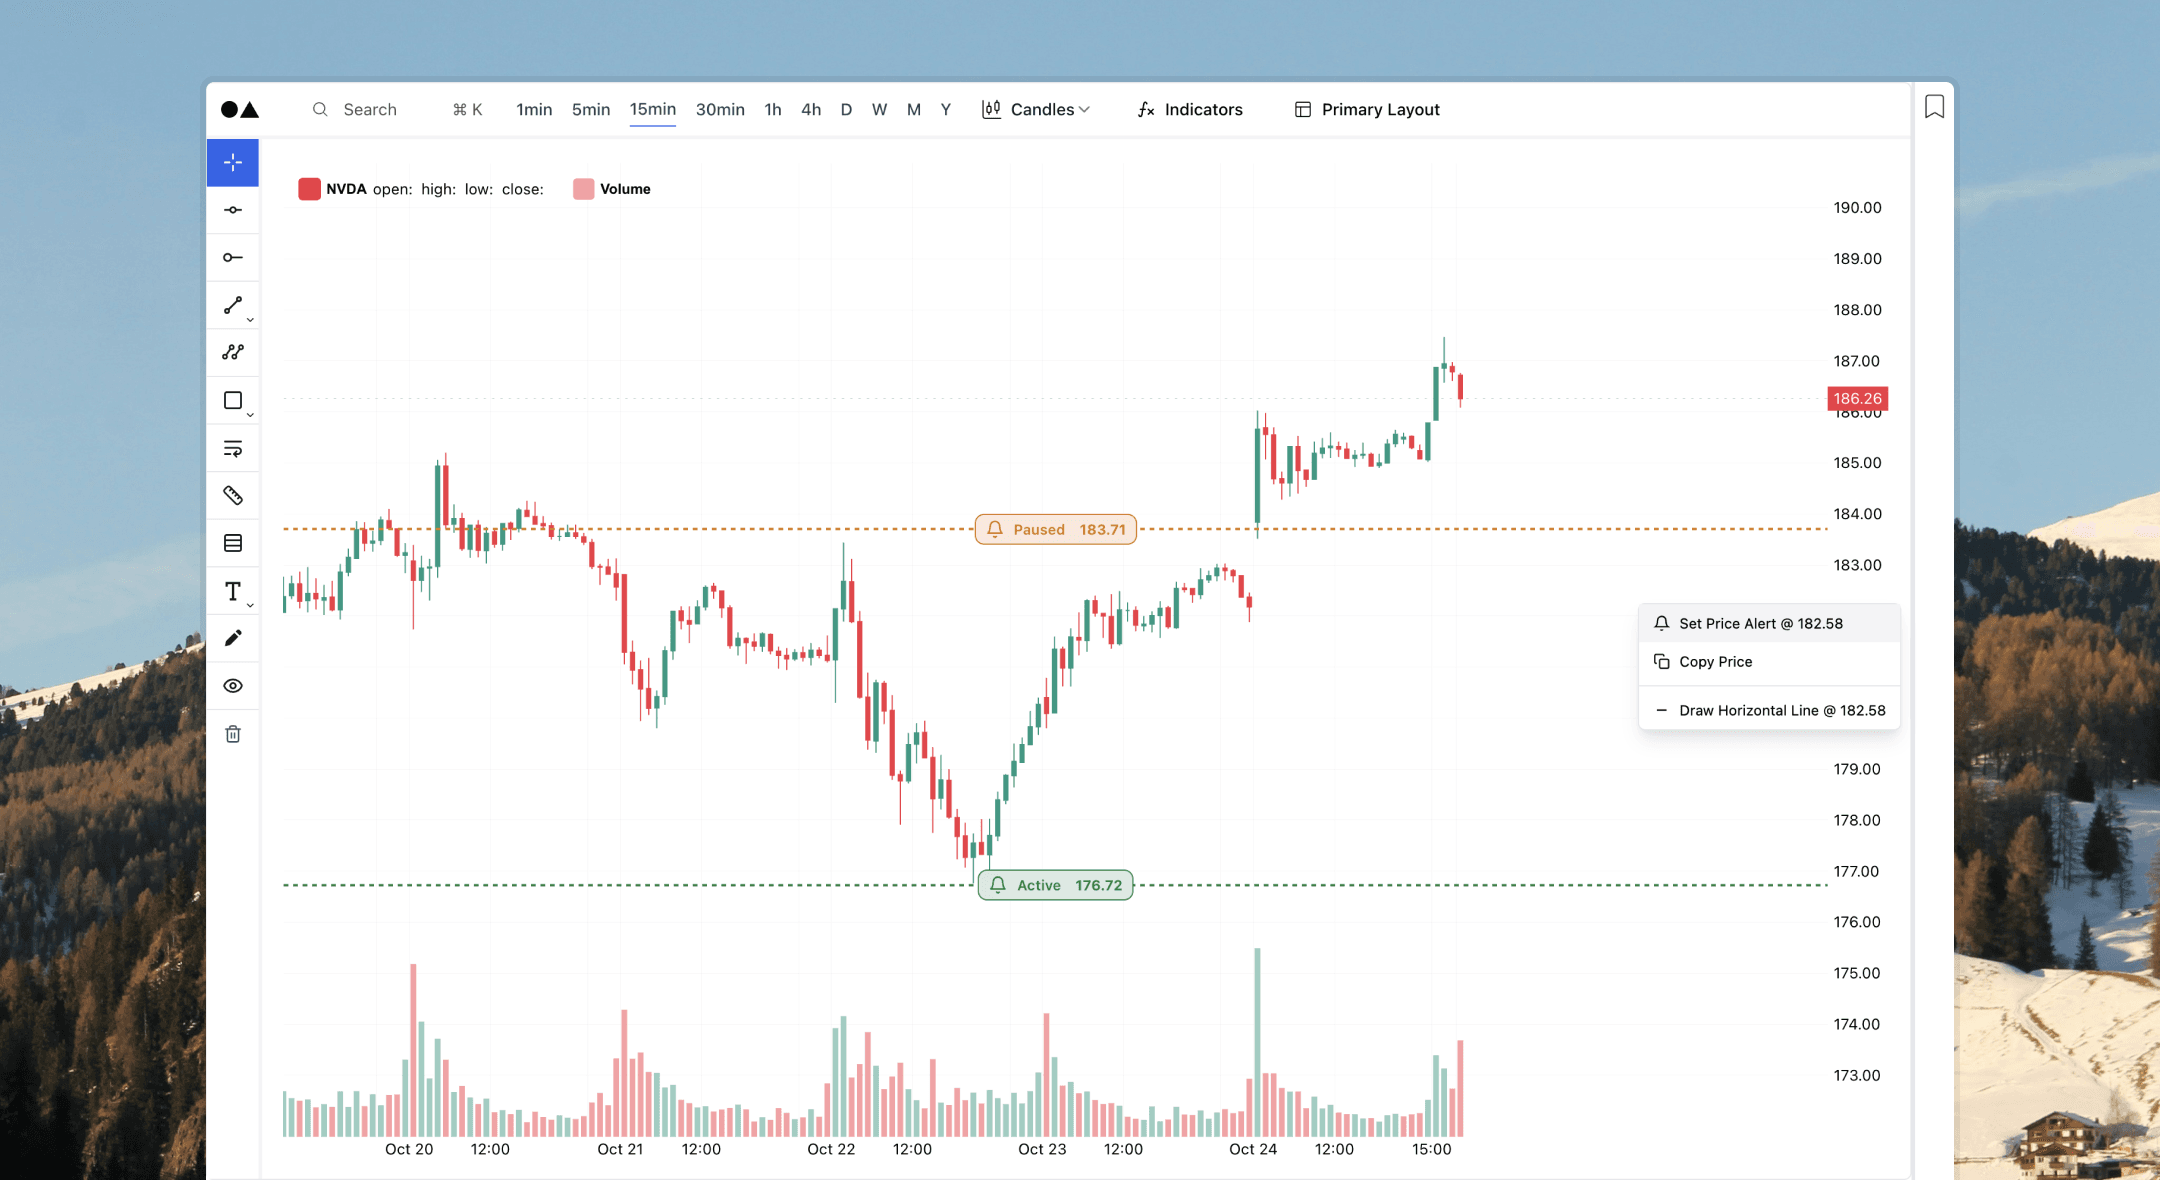
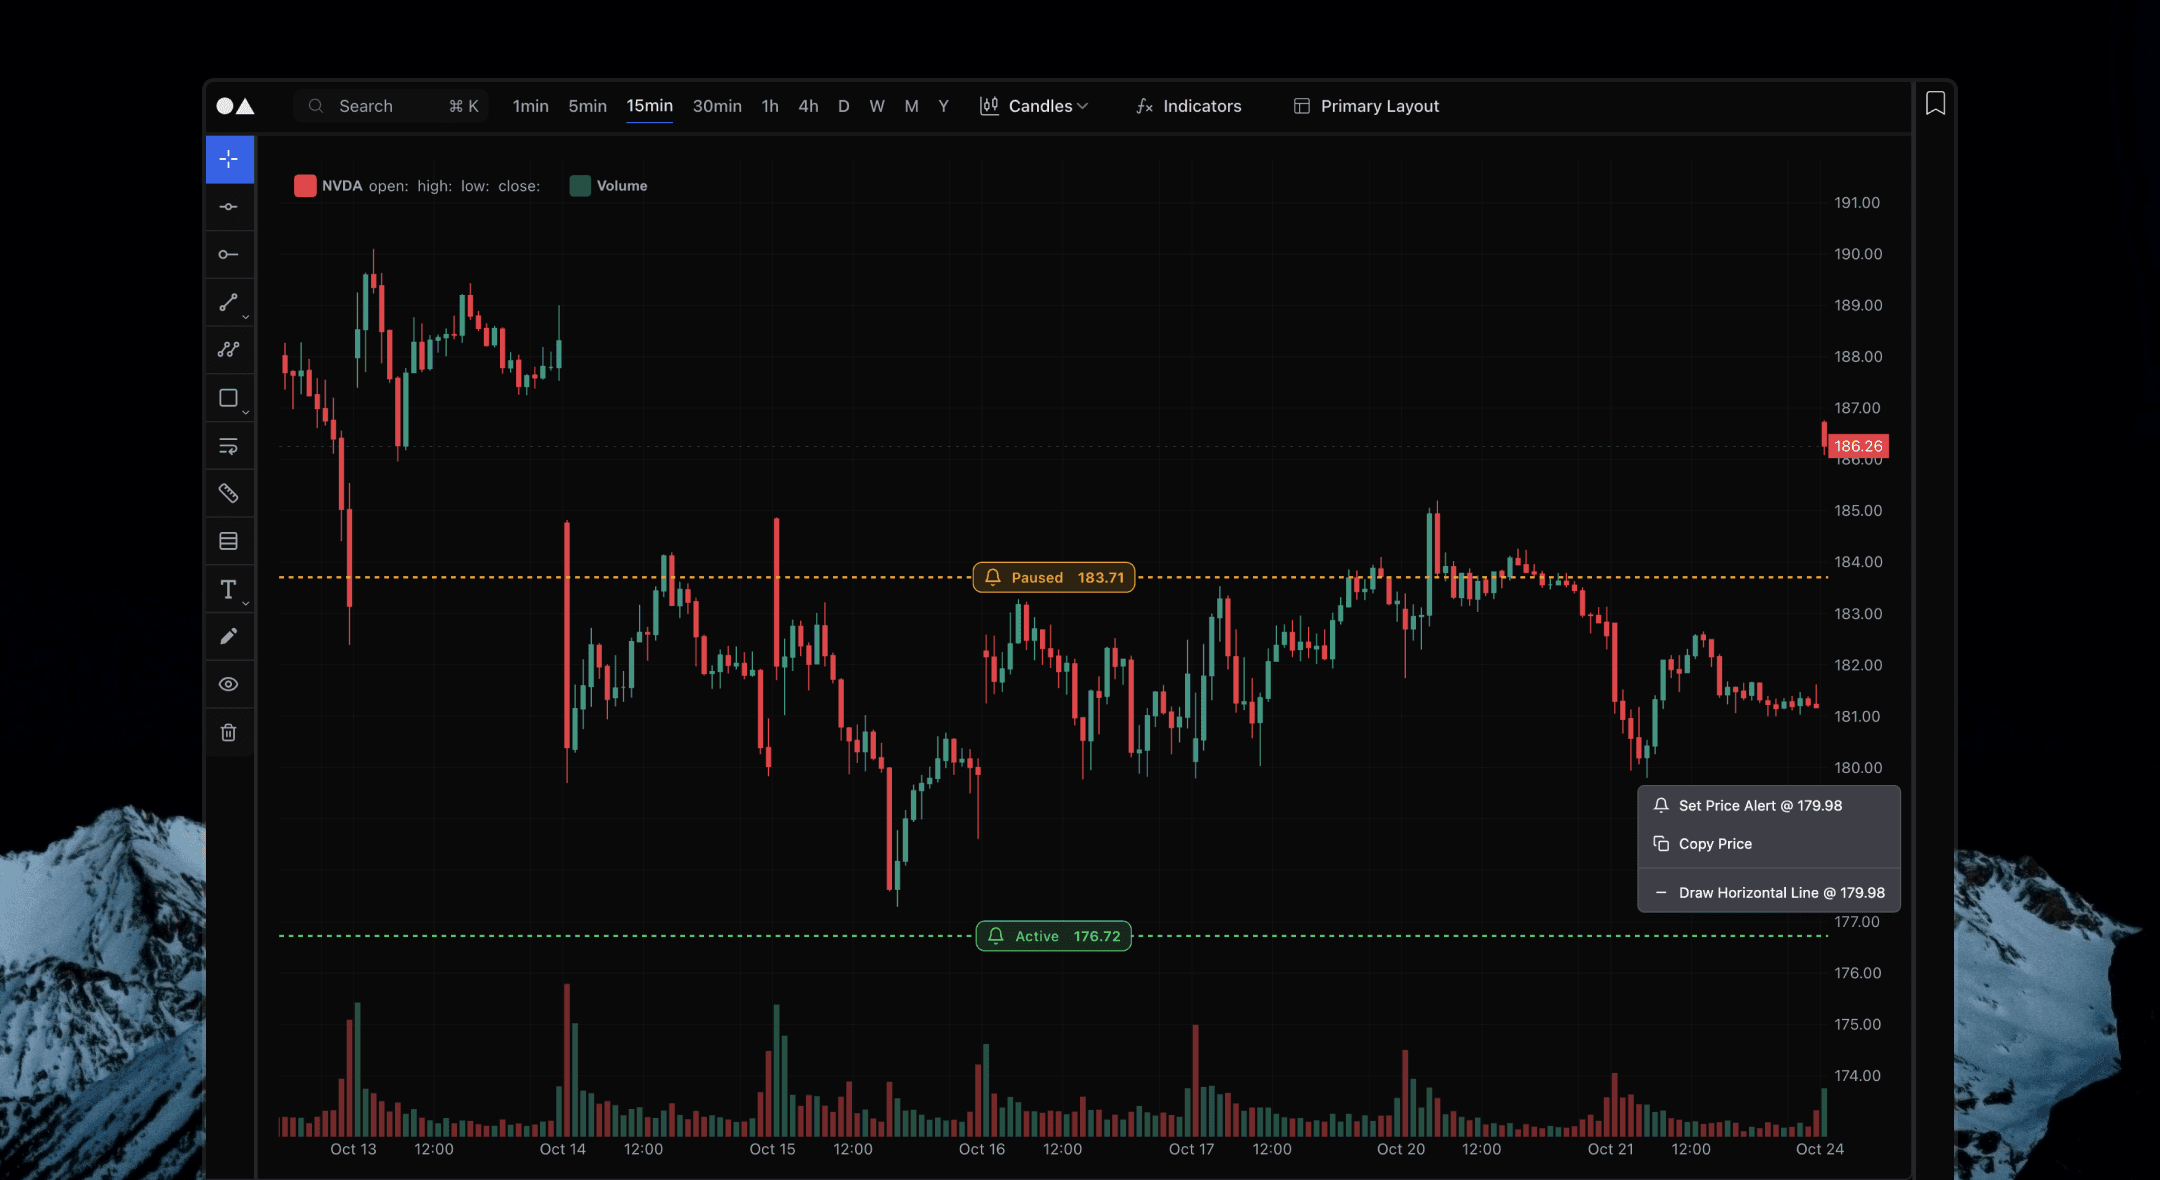
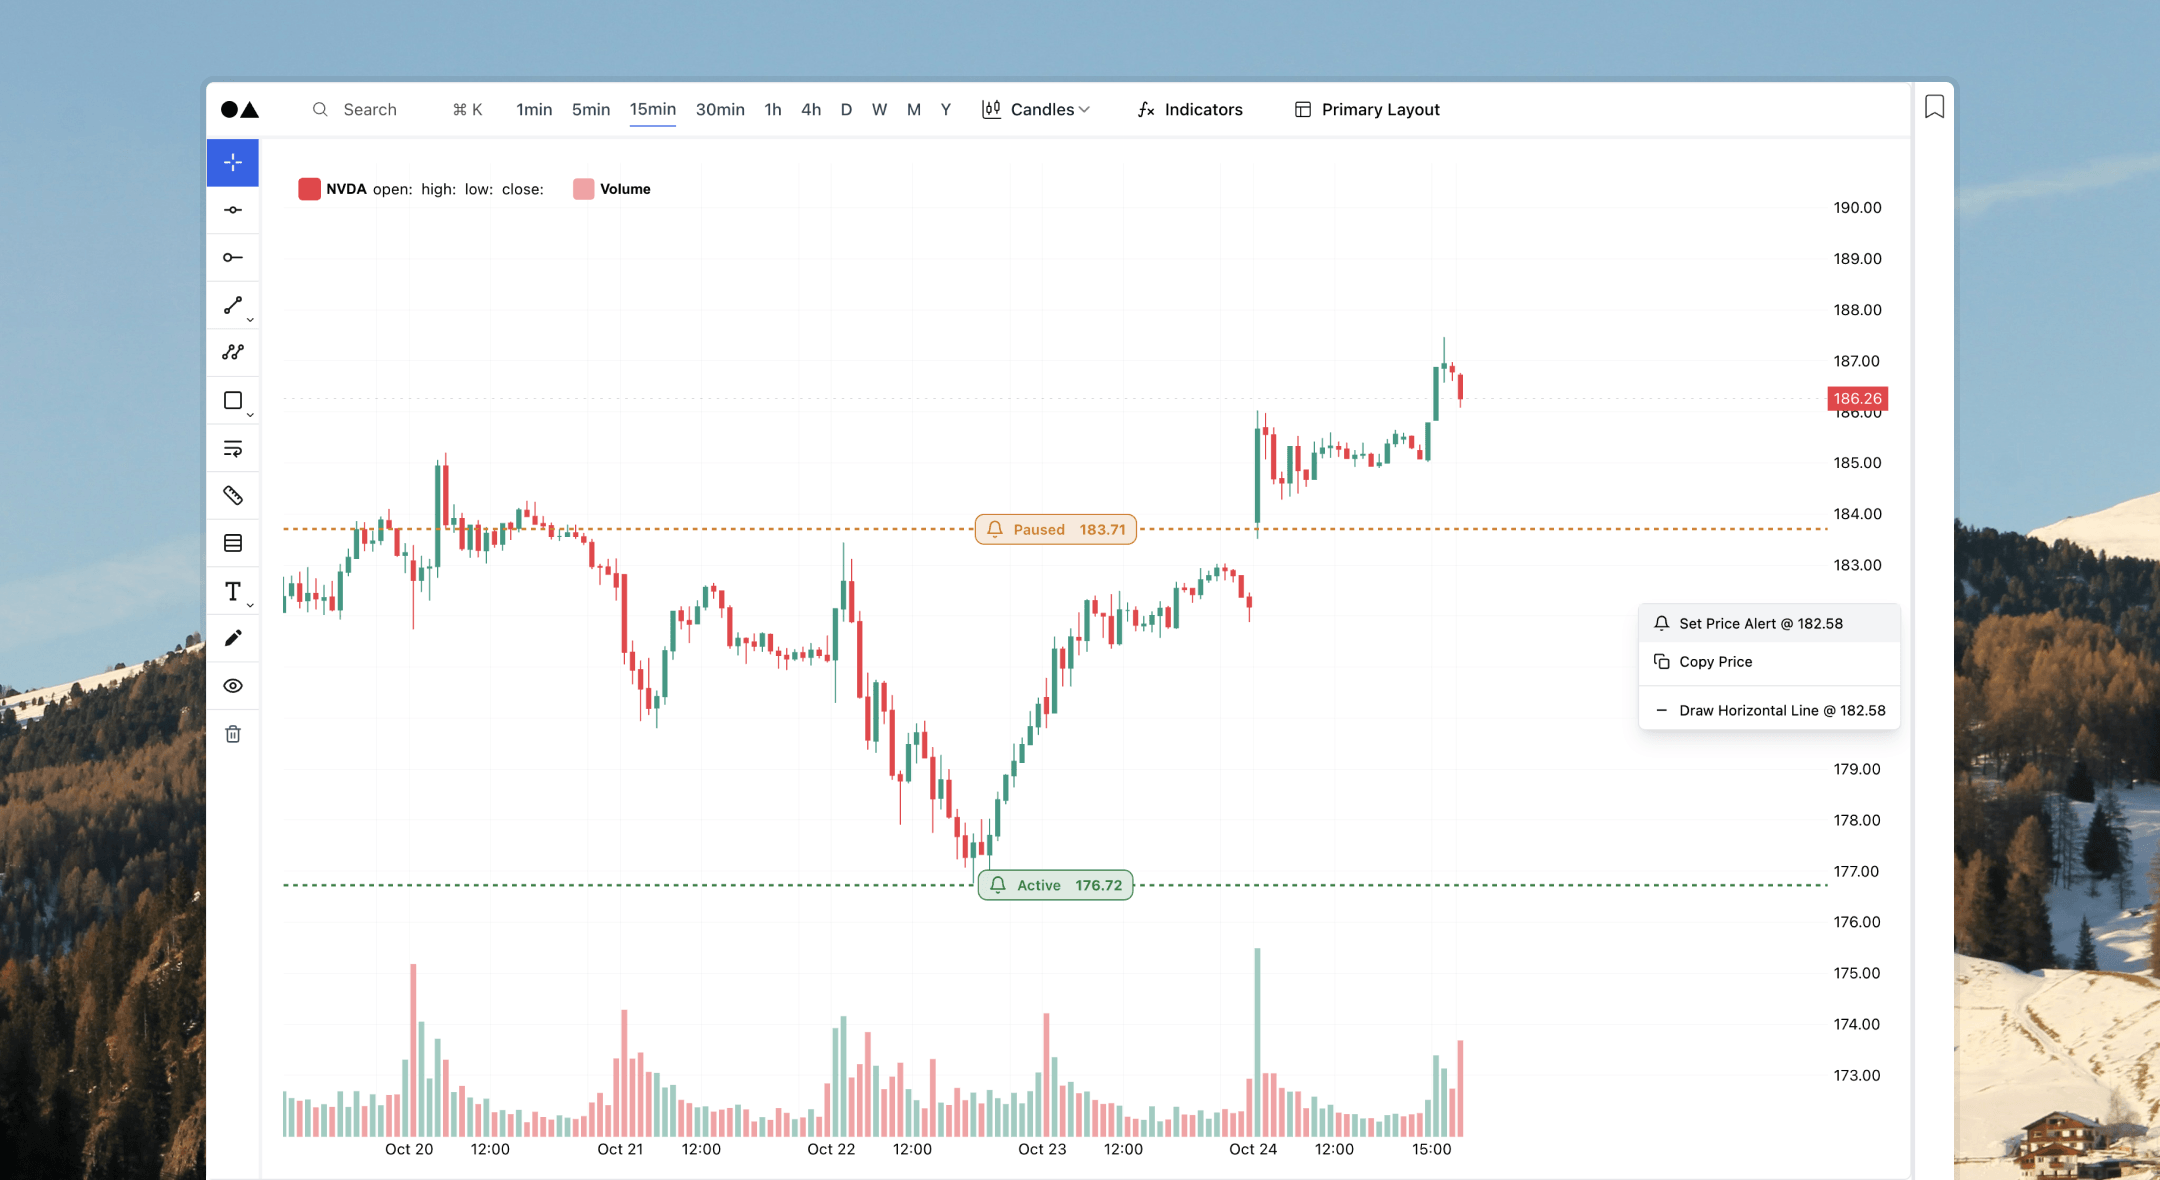
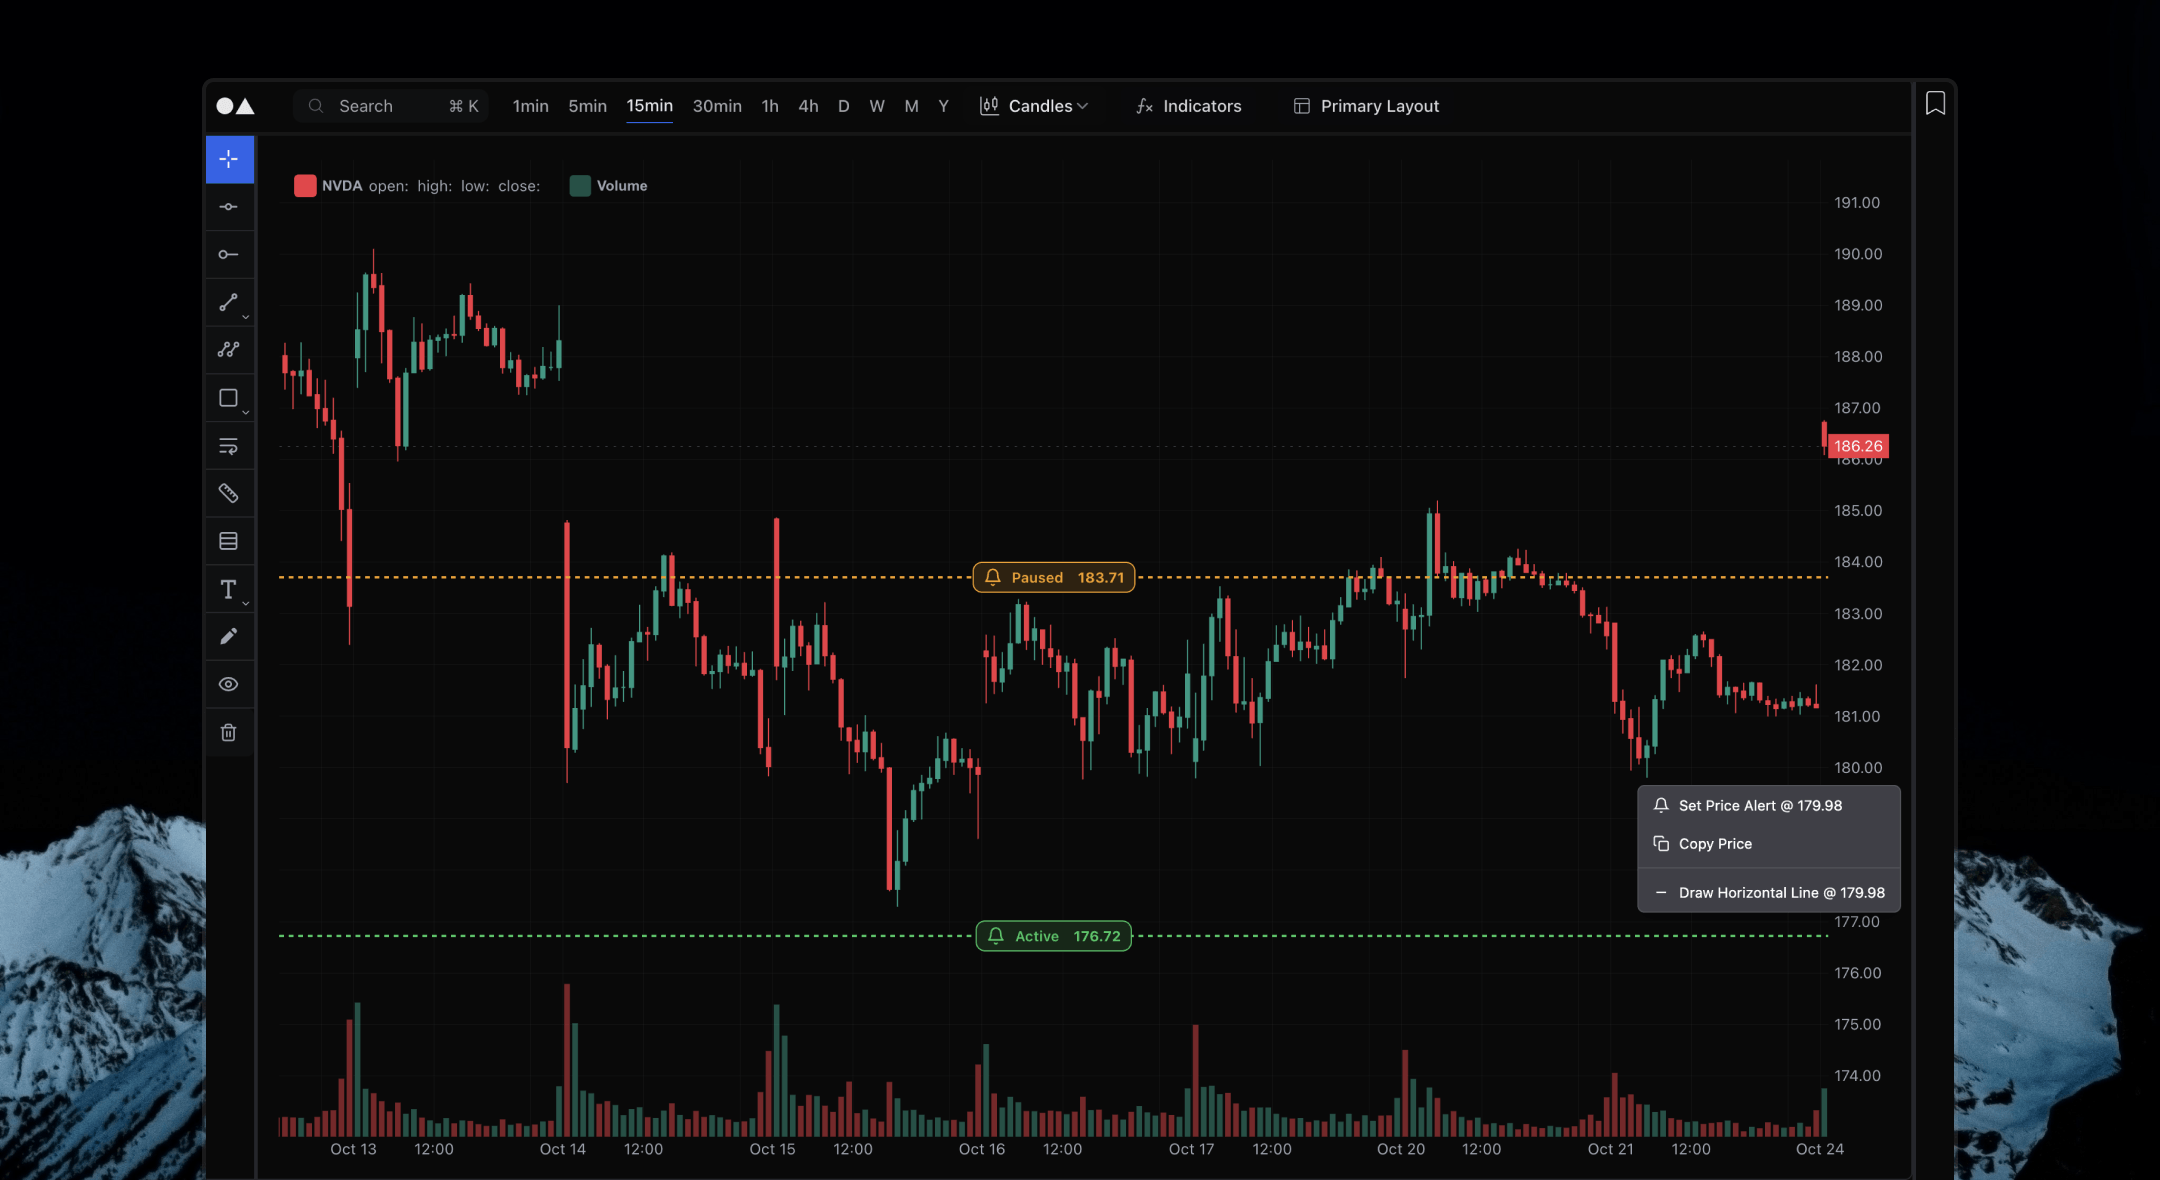
Multi-panel layouts, 24 drawing tools and in-line alerts you can drag to any price.
Crypto Analytics
Read funding, liquidations, ETF flows and on-chain cycle metrics together in one view.
Financial Planning
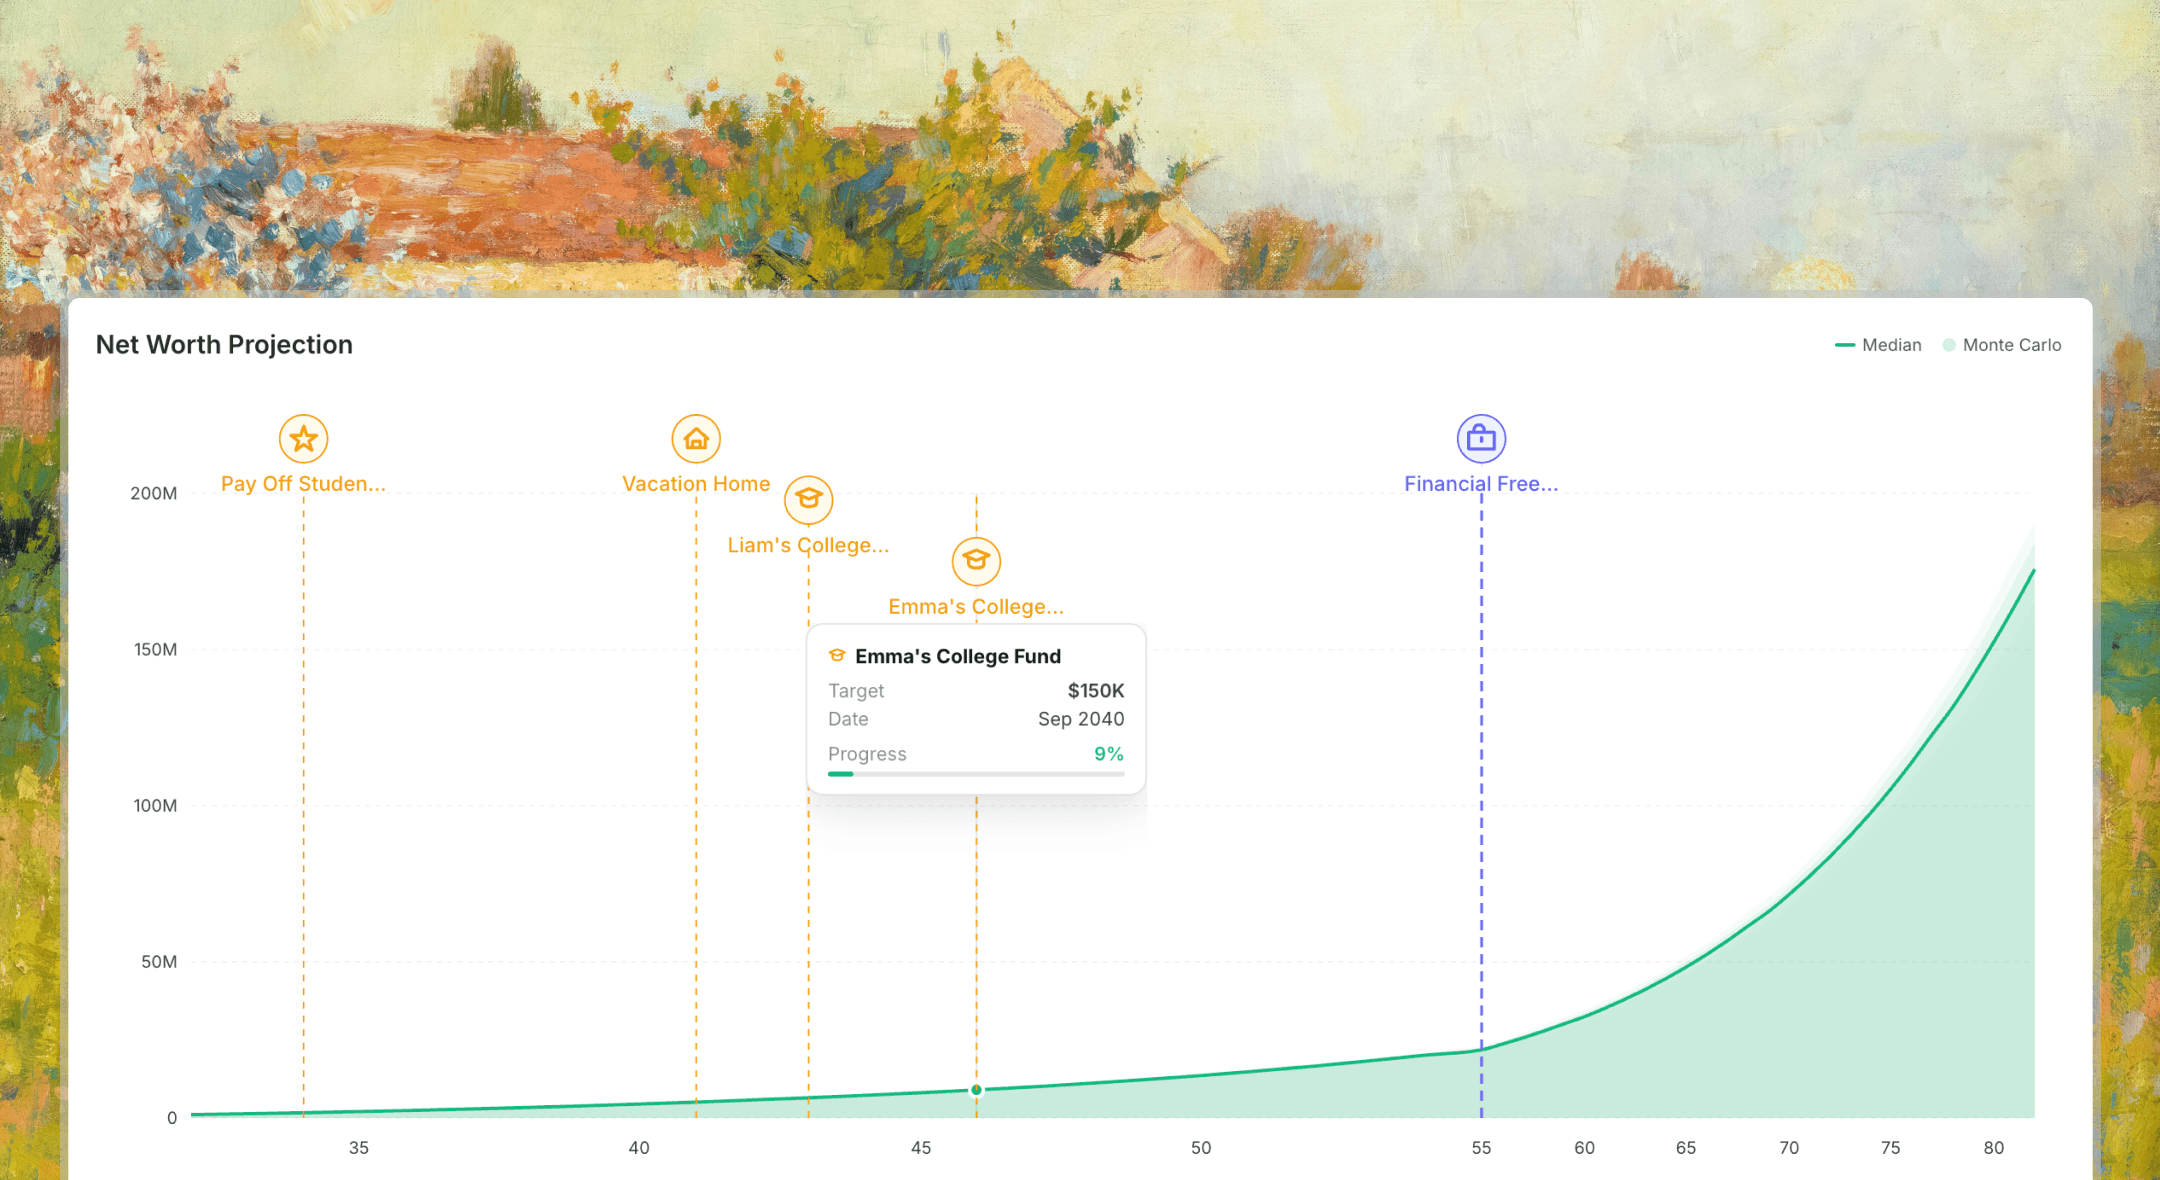
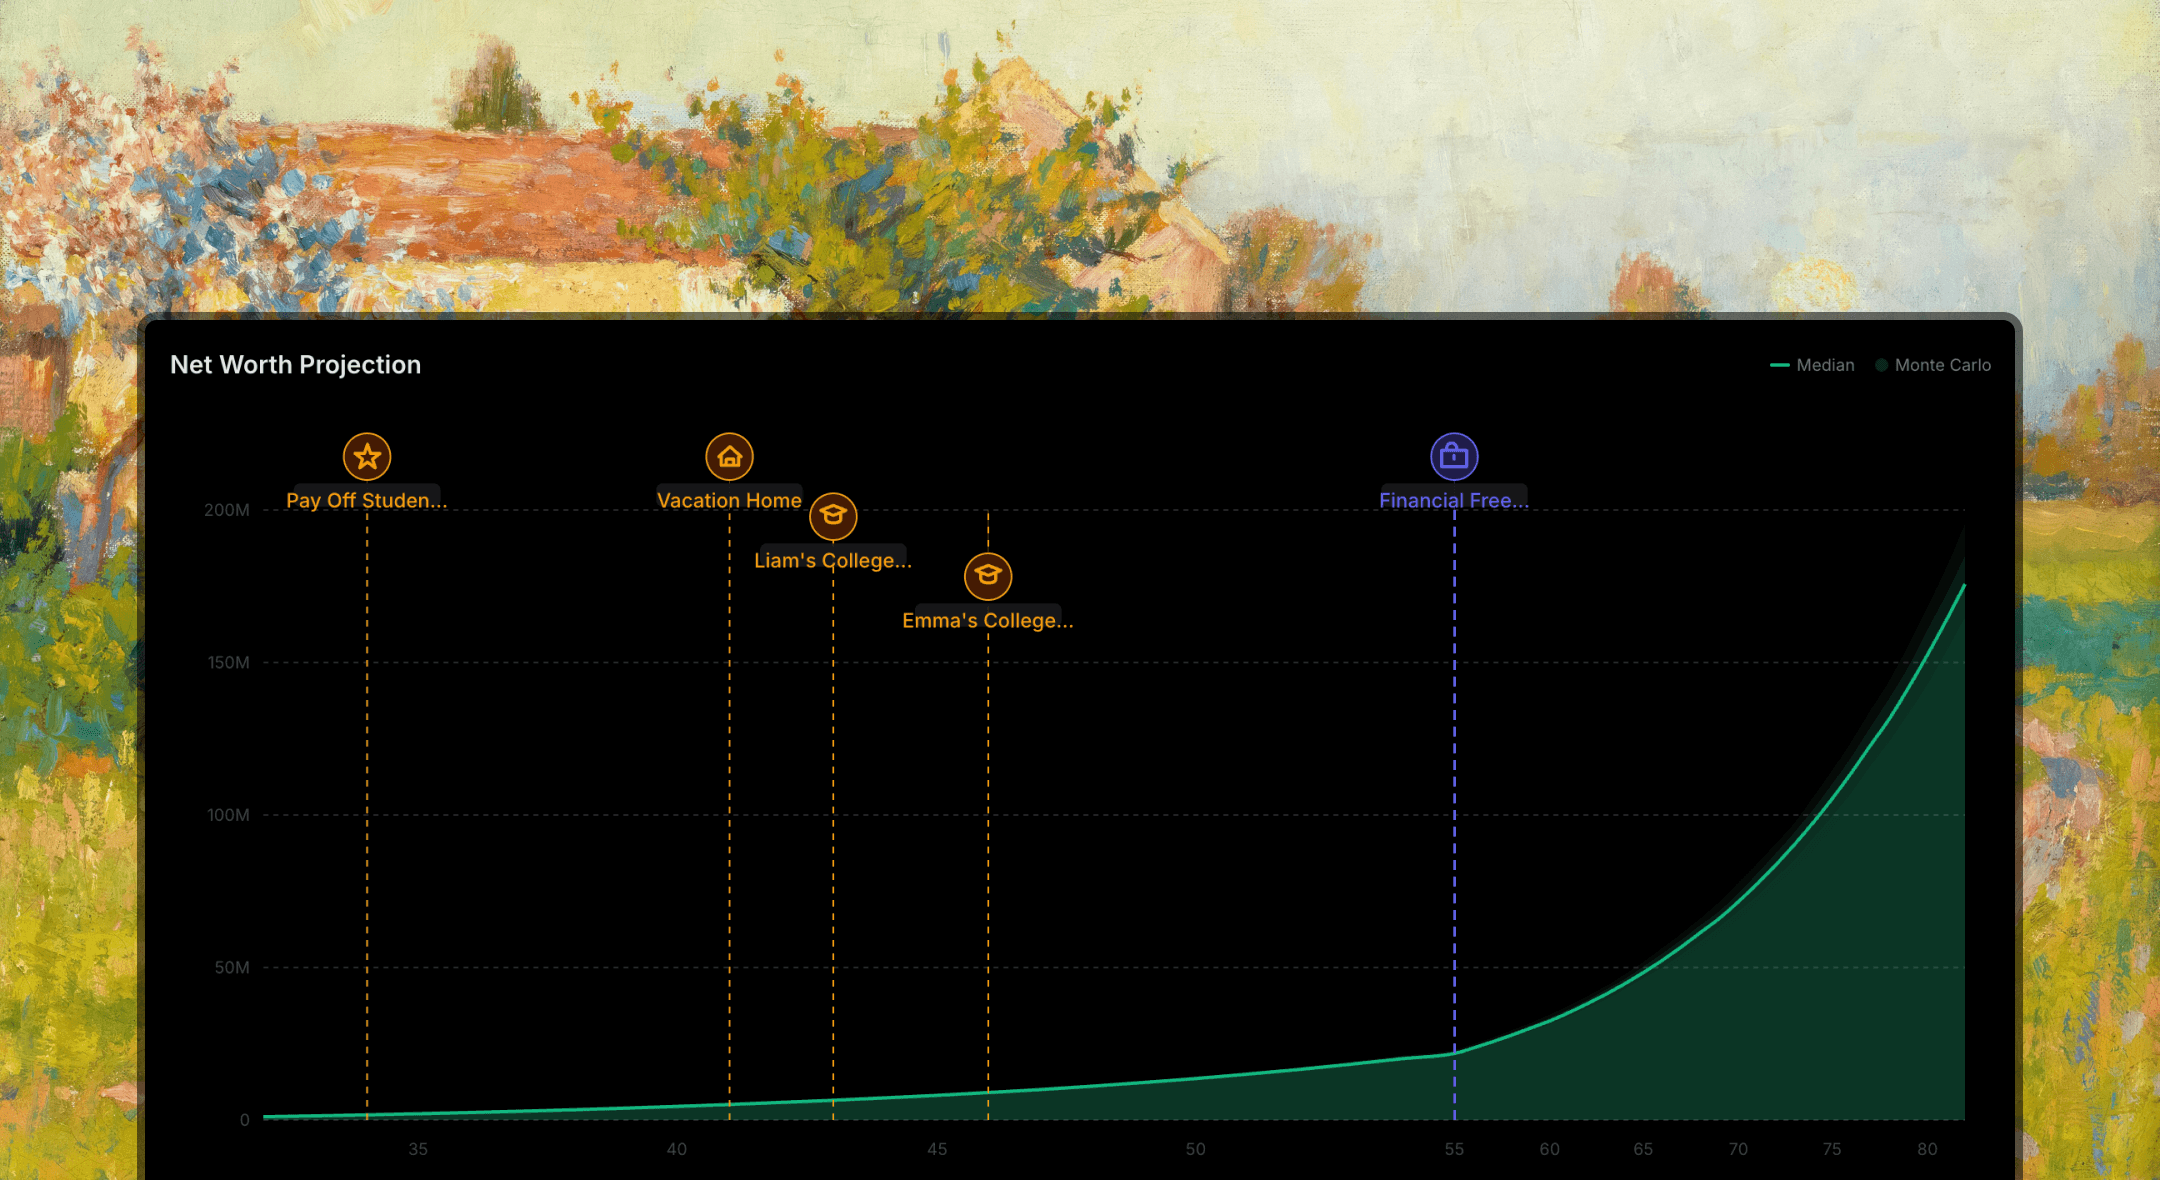
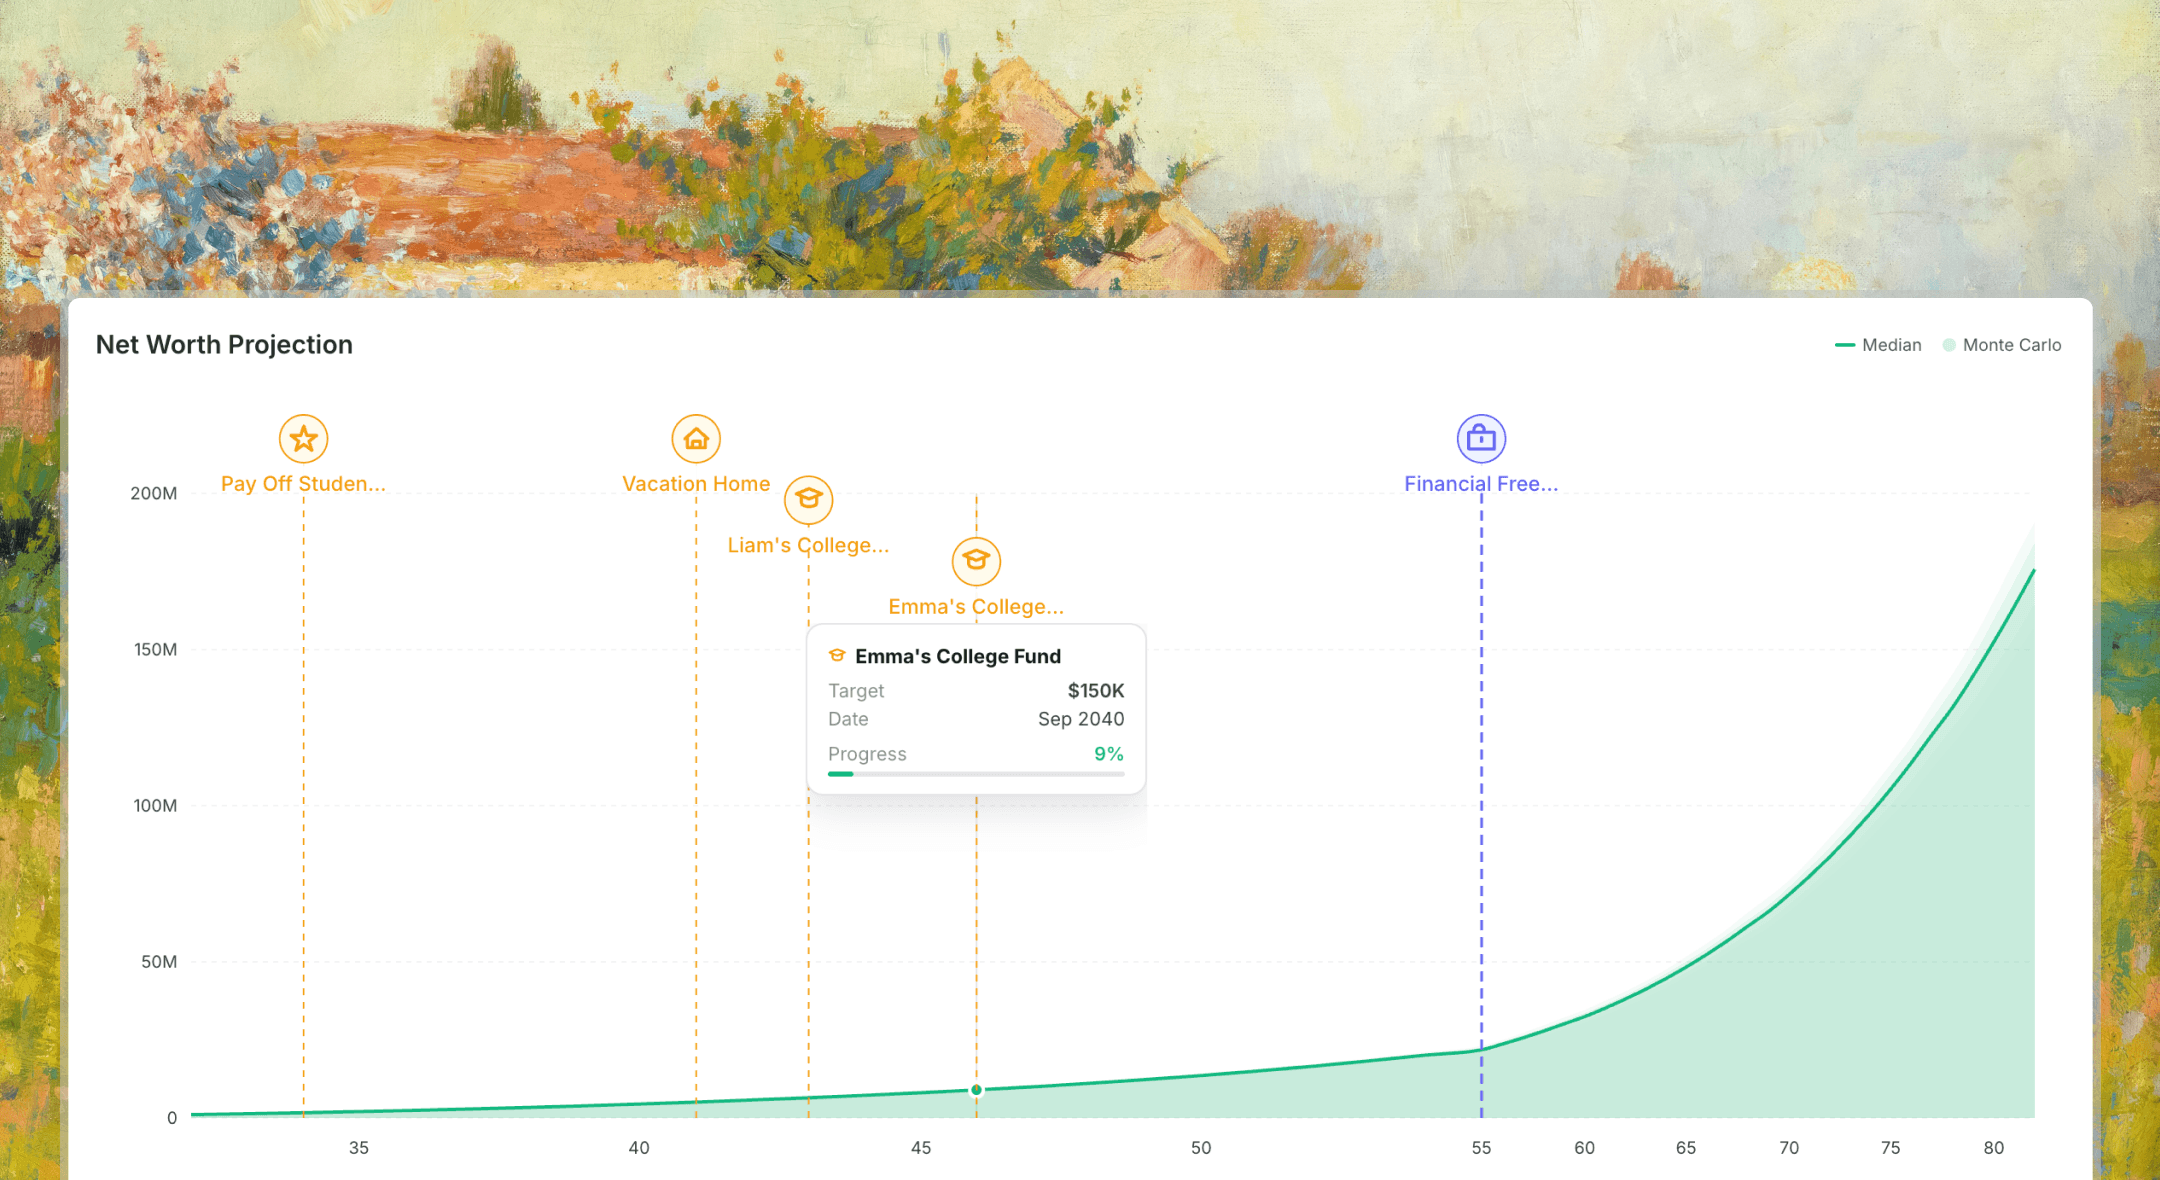
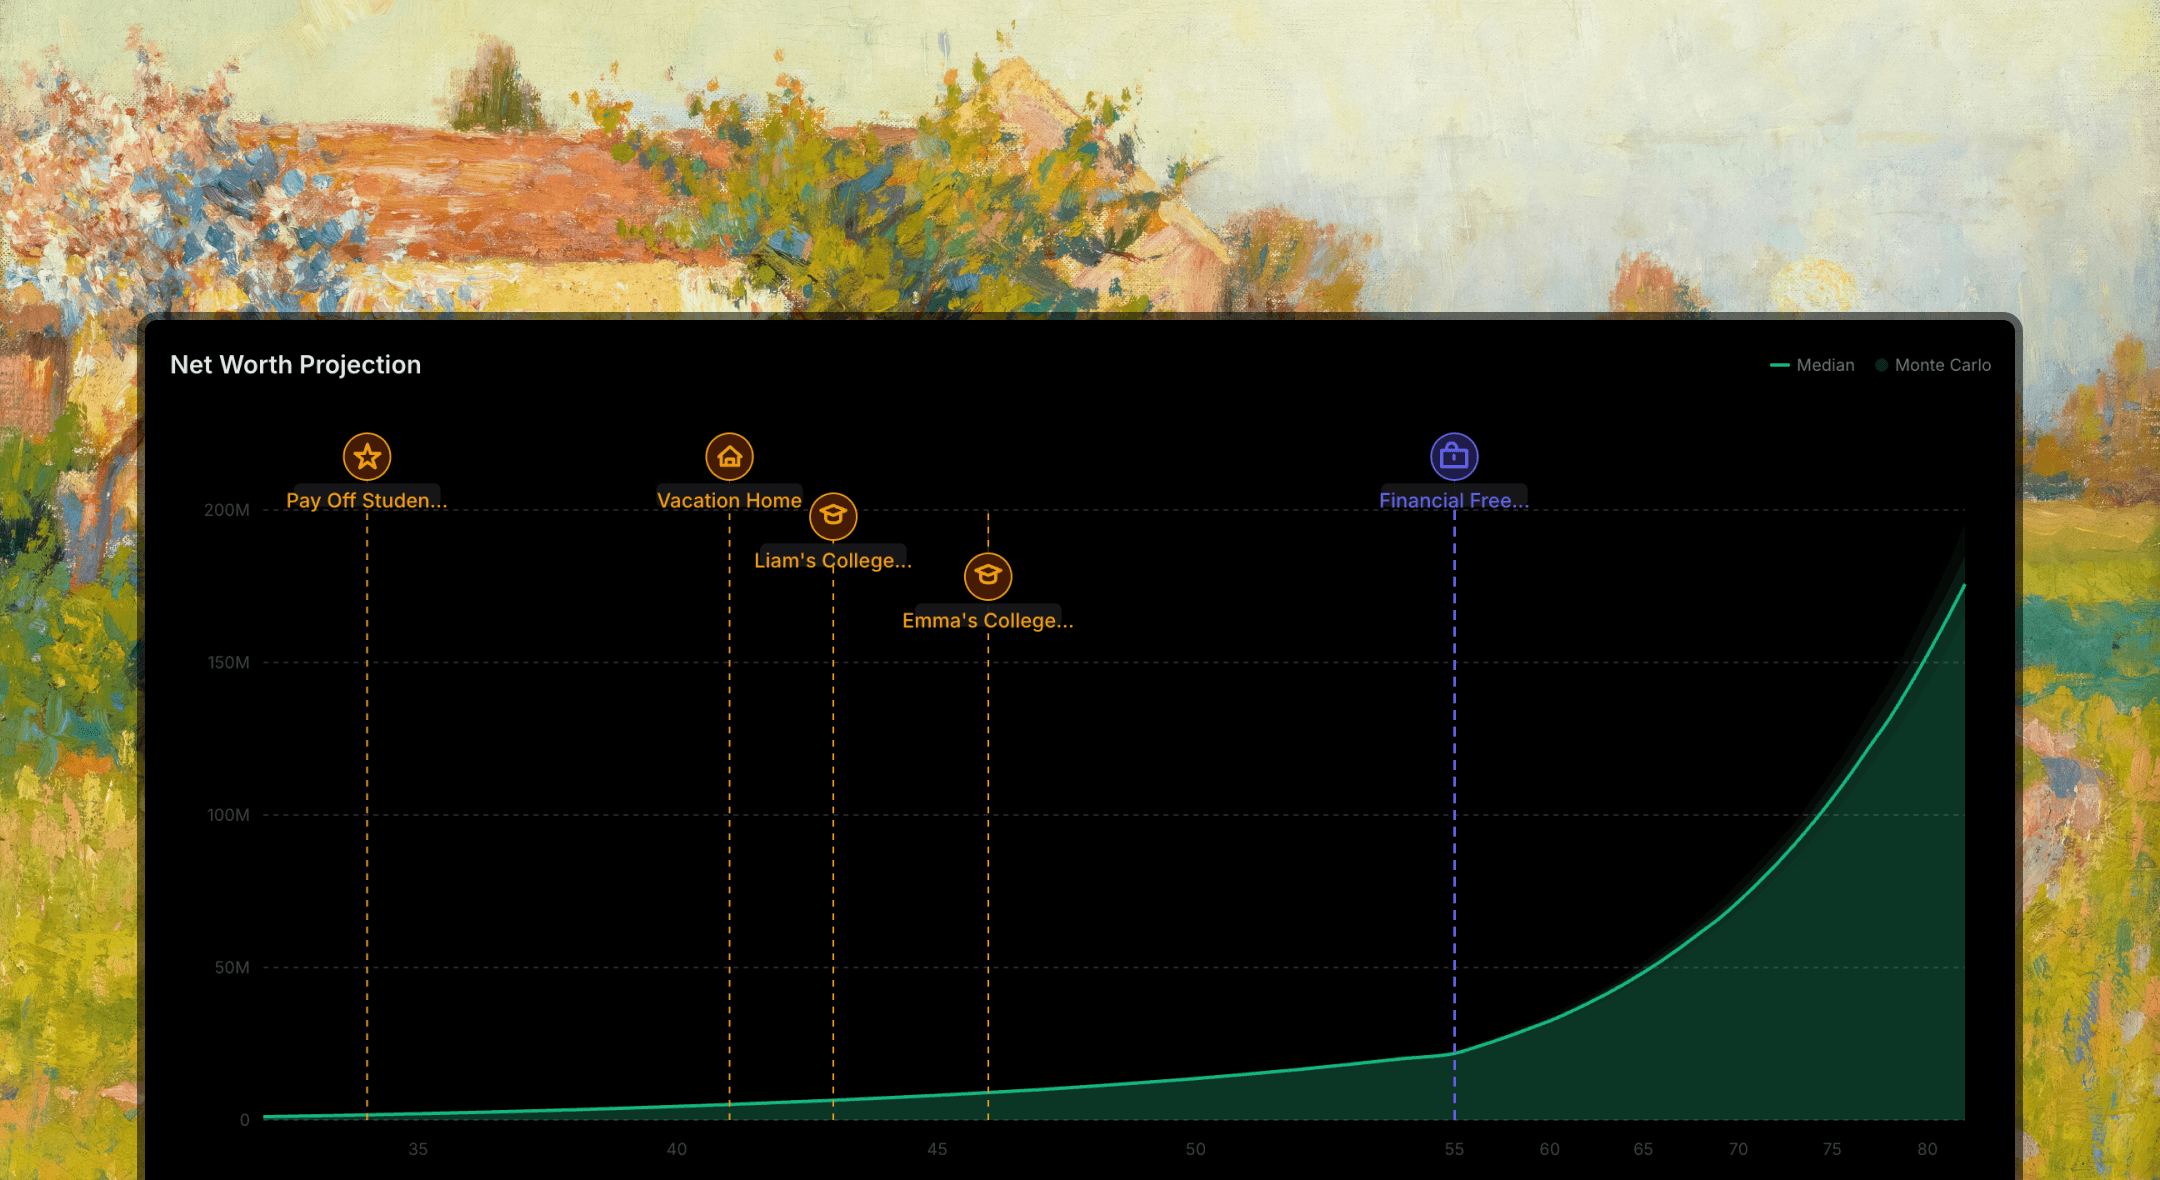
Model income, expenses and goals, then project your net worth all the way to retirement.
Investment Dashboard
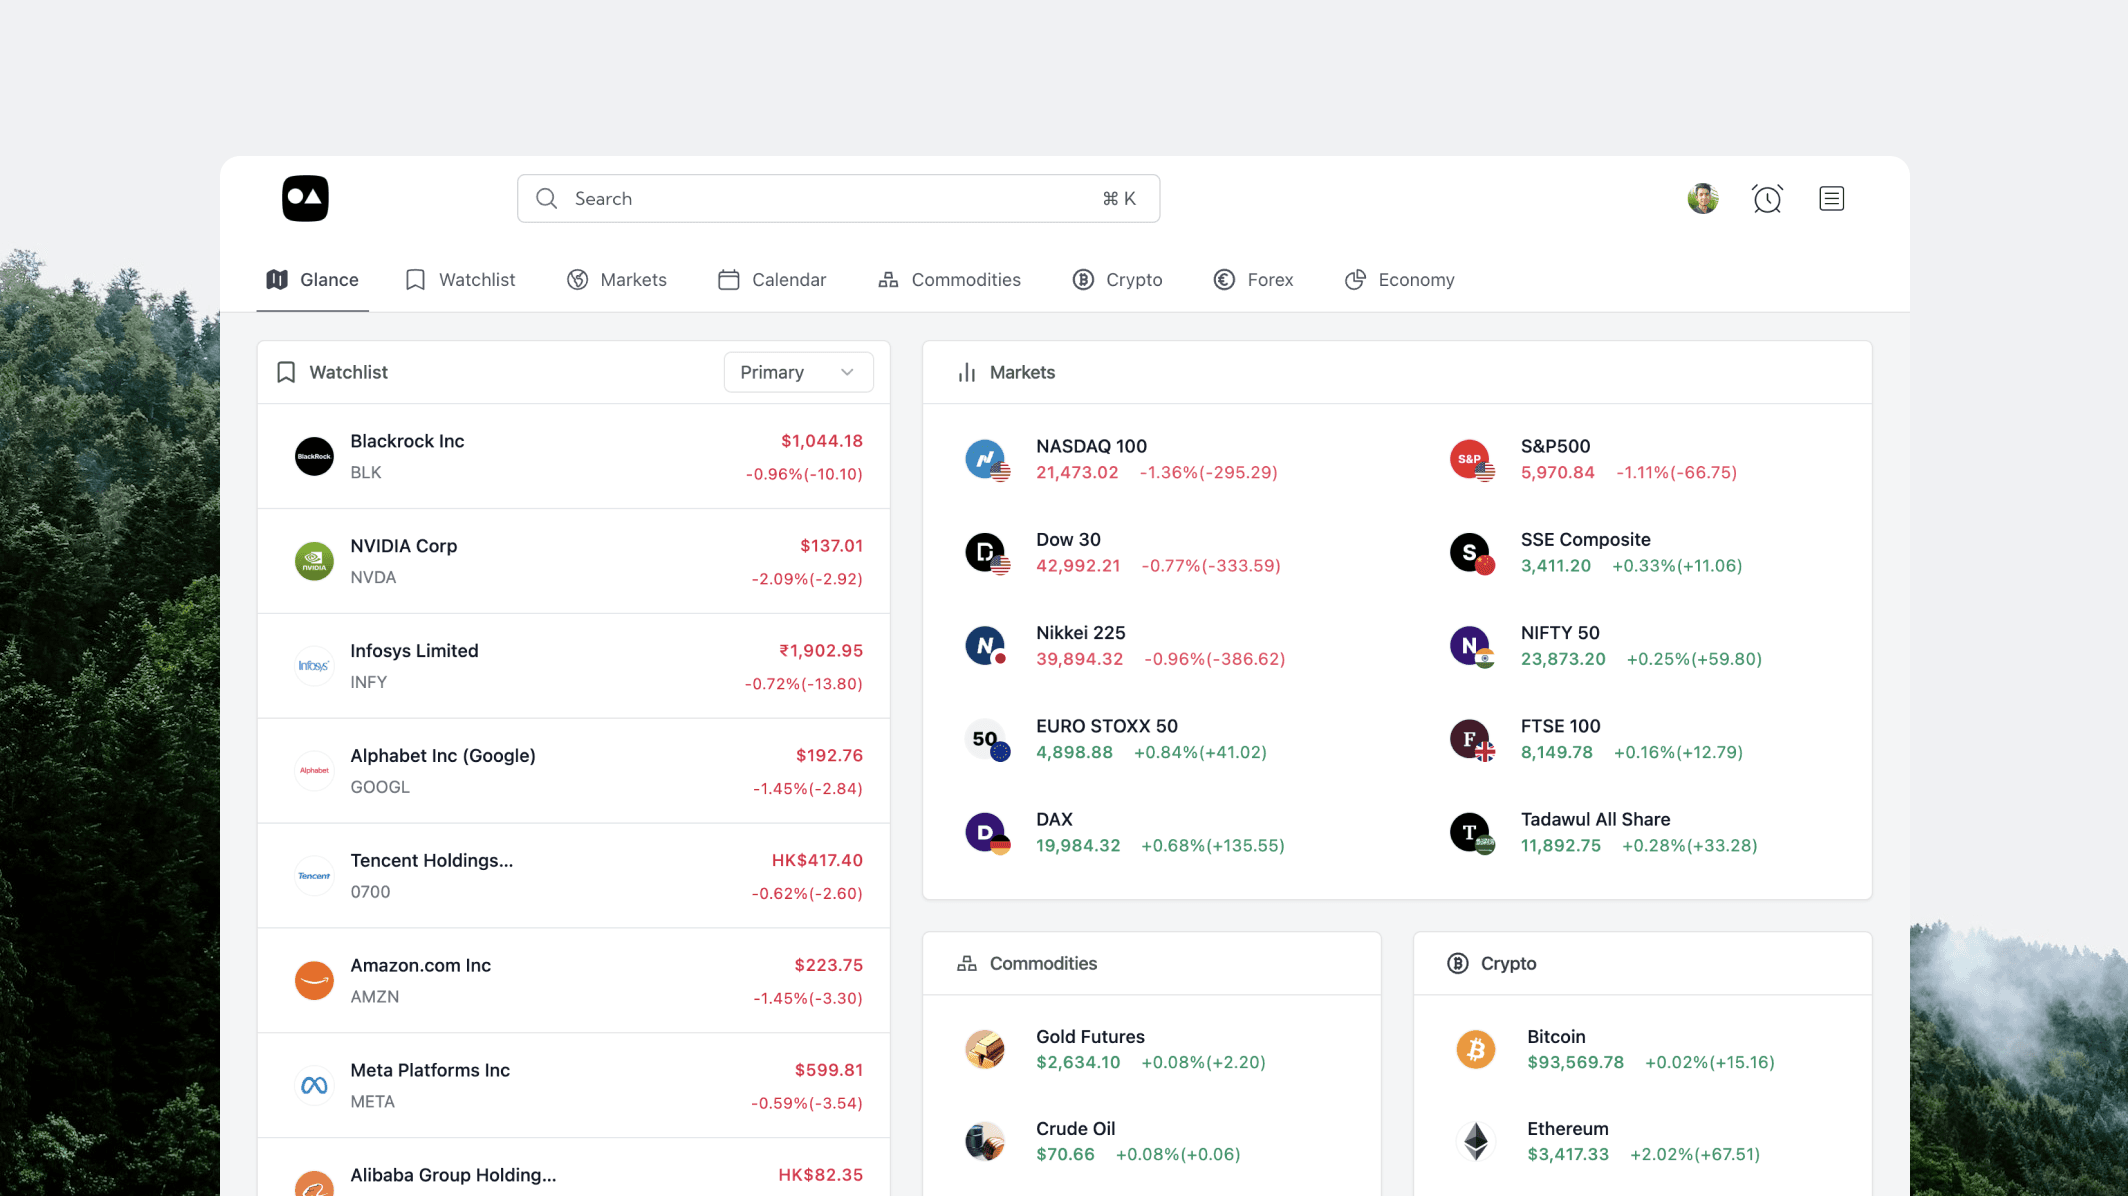
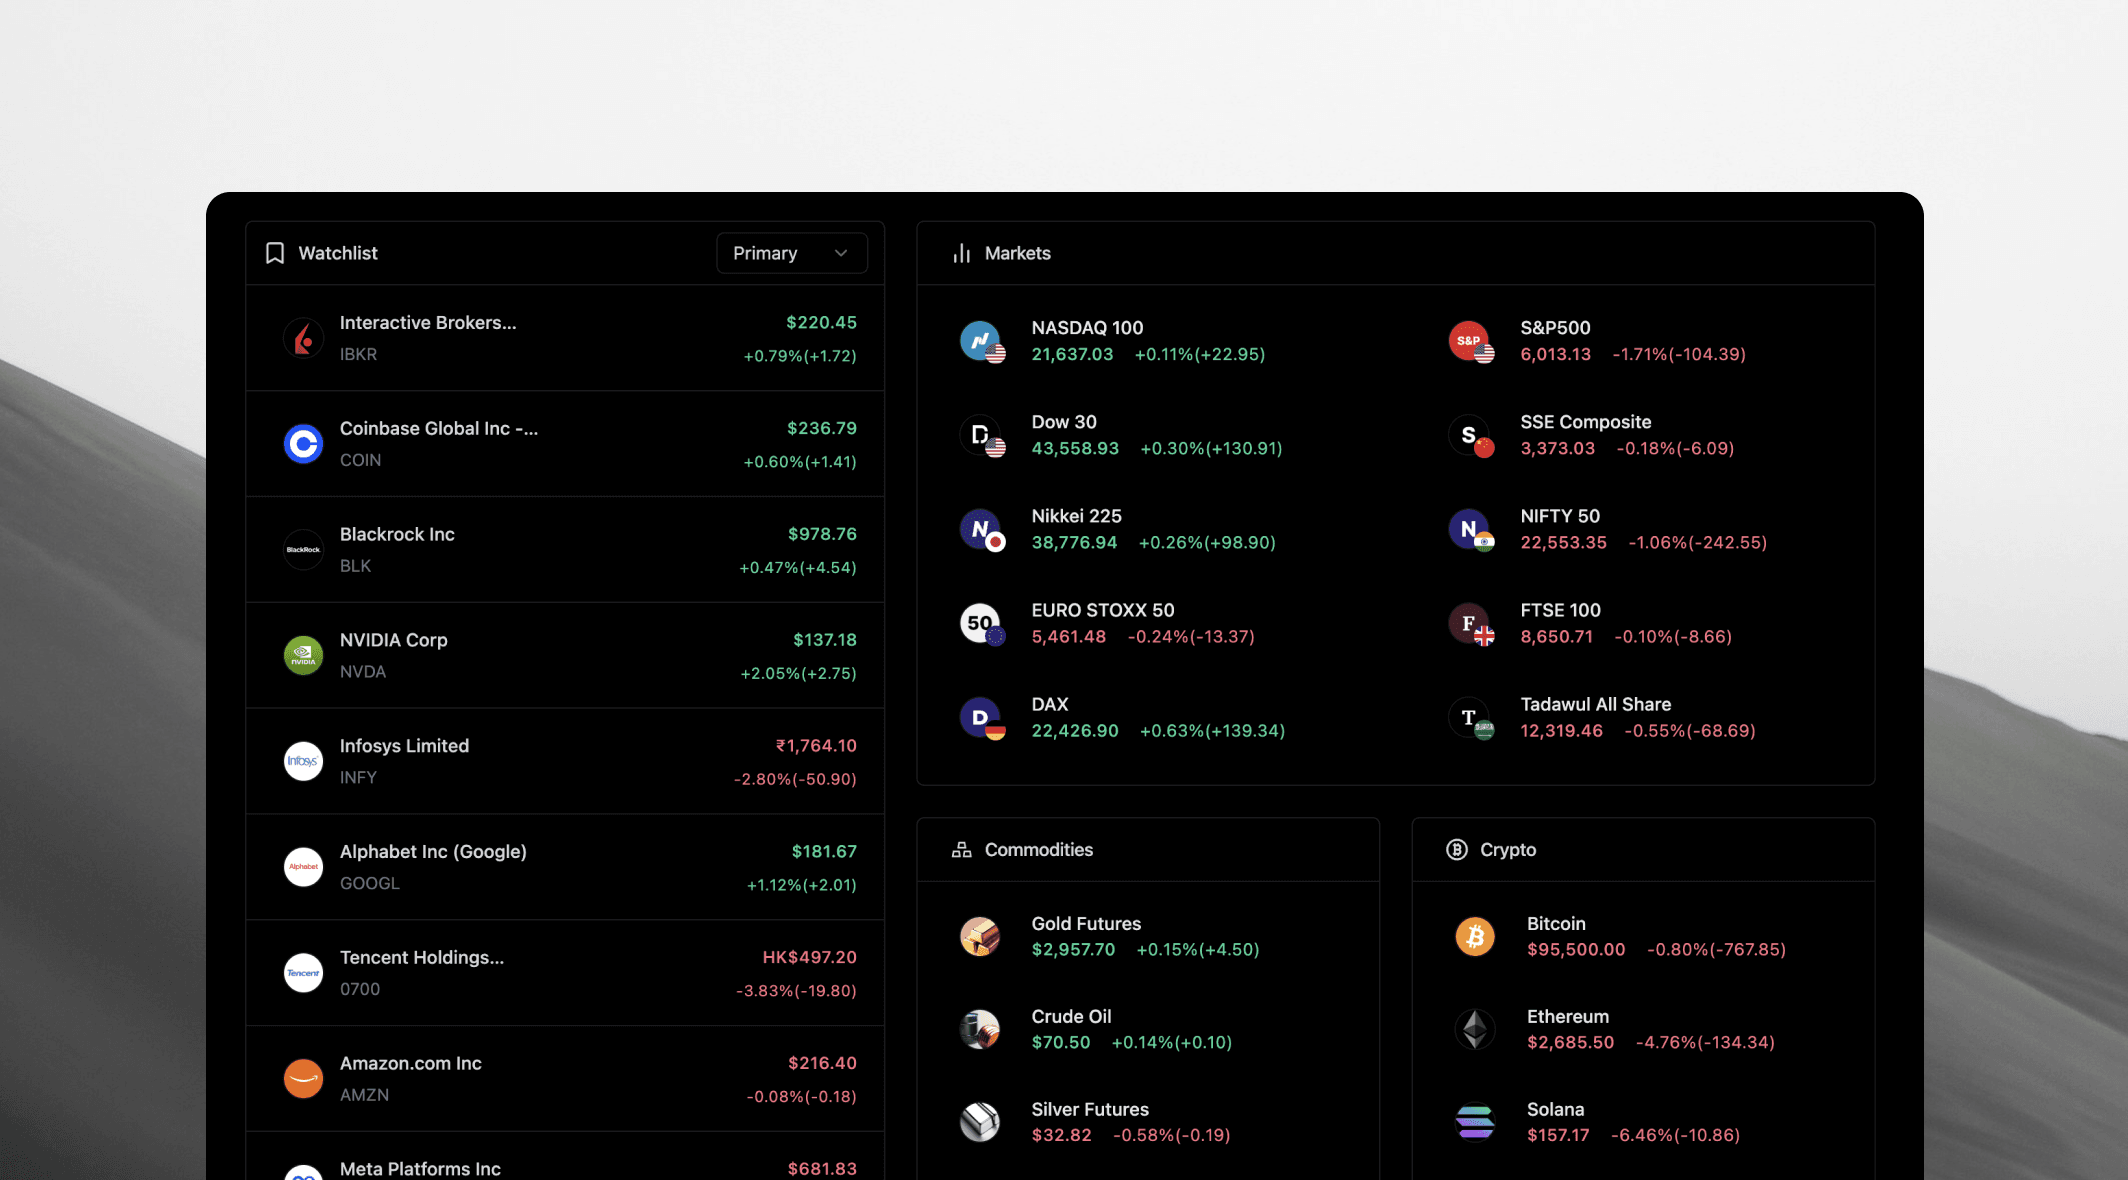
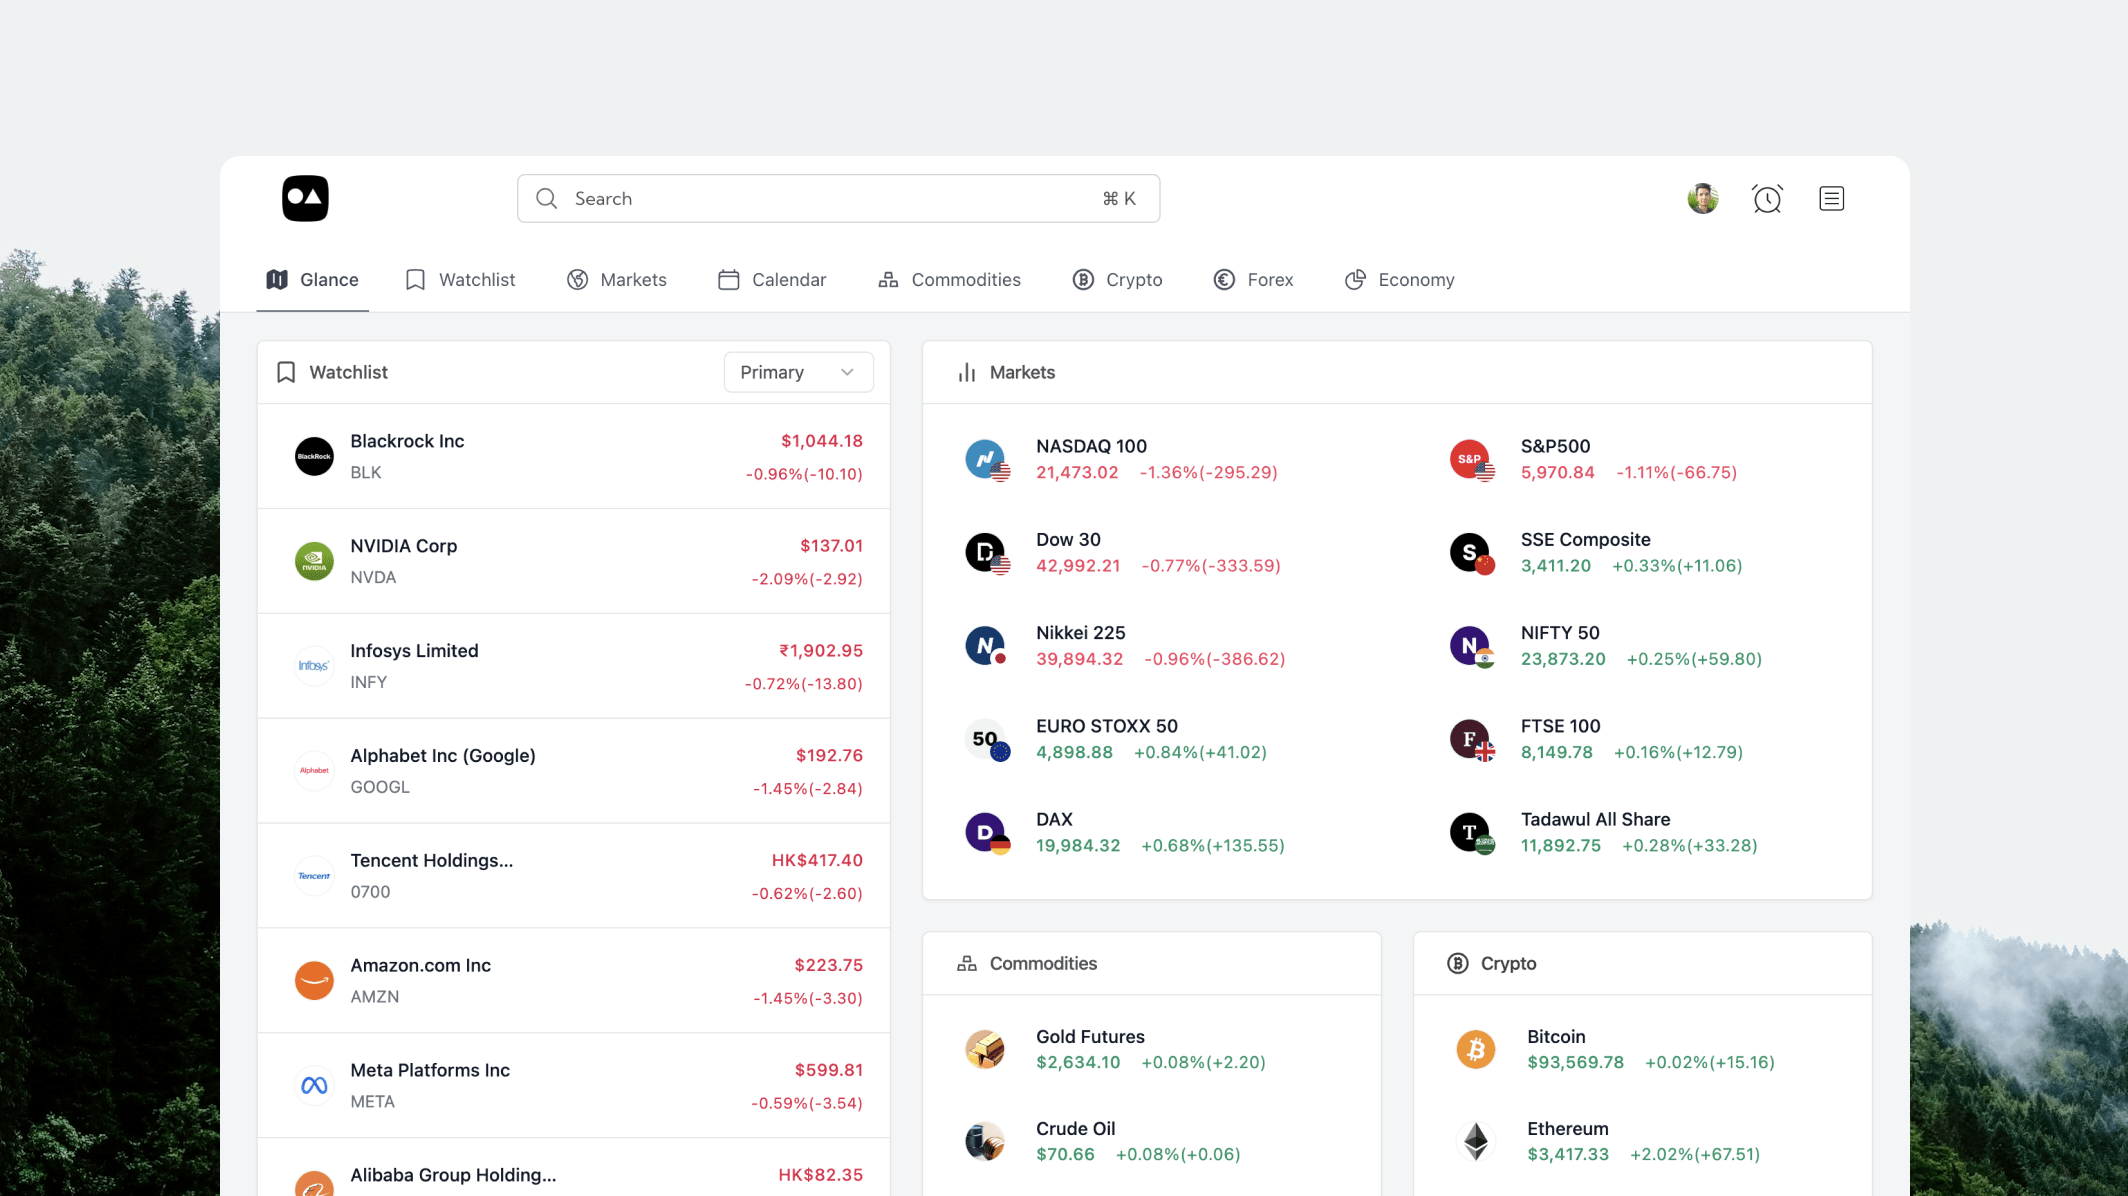
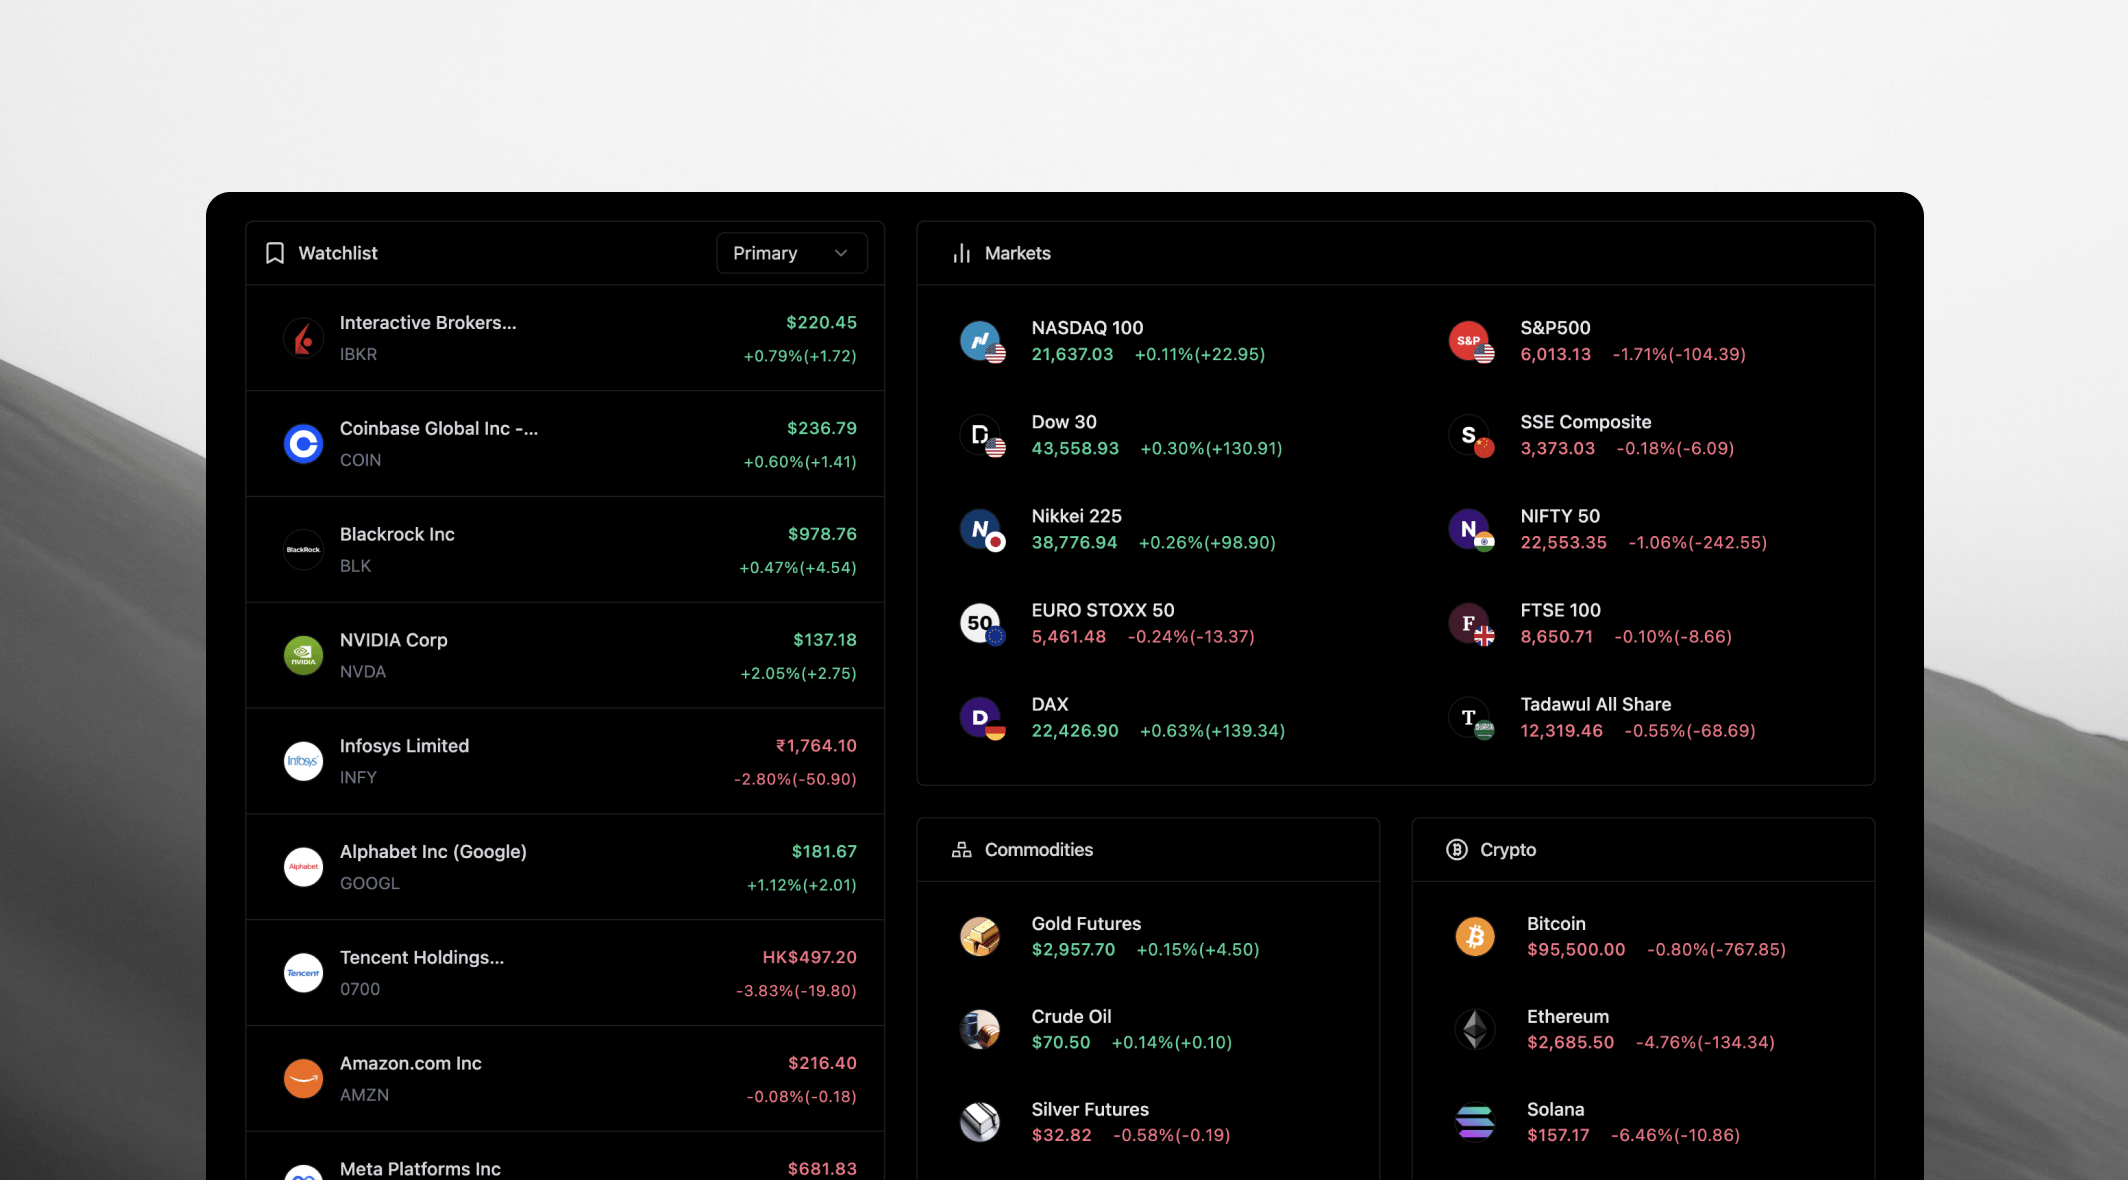
Your entire market in a single glance — watchlists, holdings and movers updating live in one command center.
Trading Journal
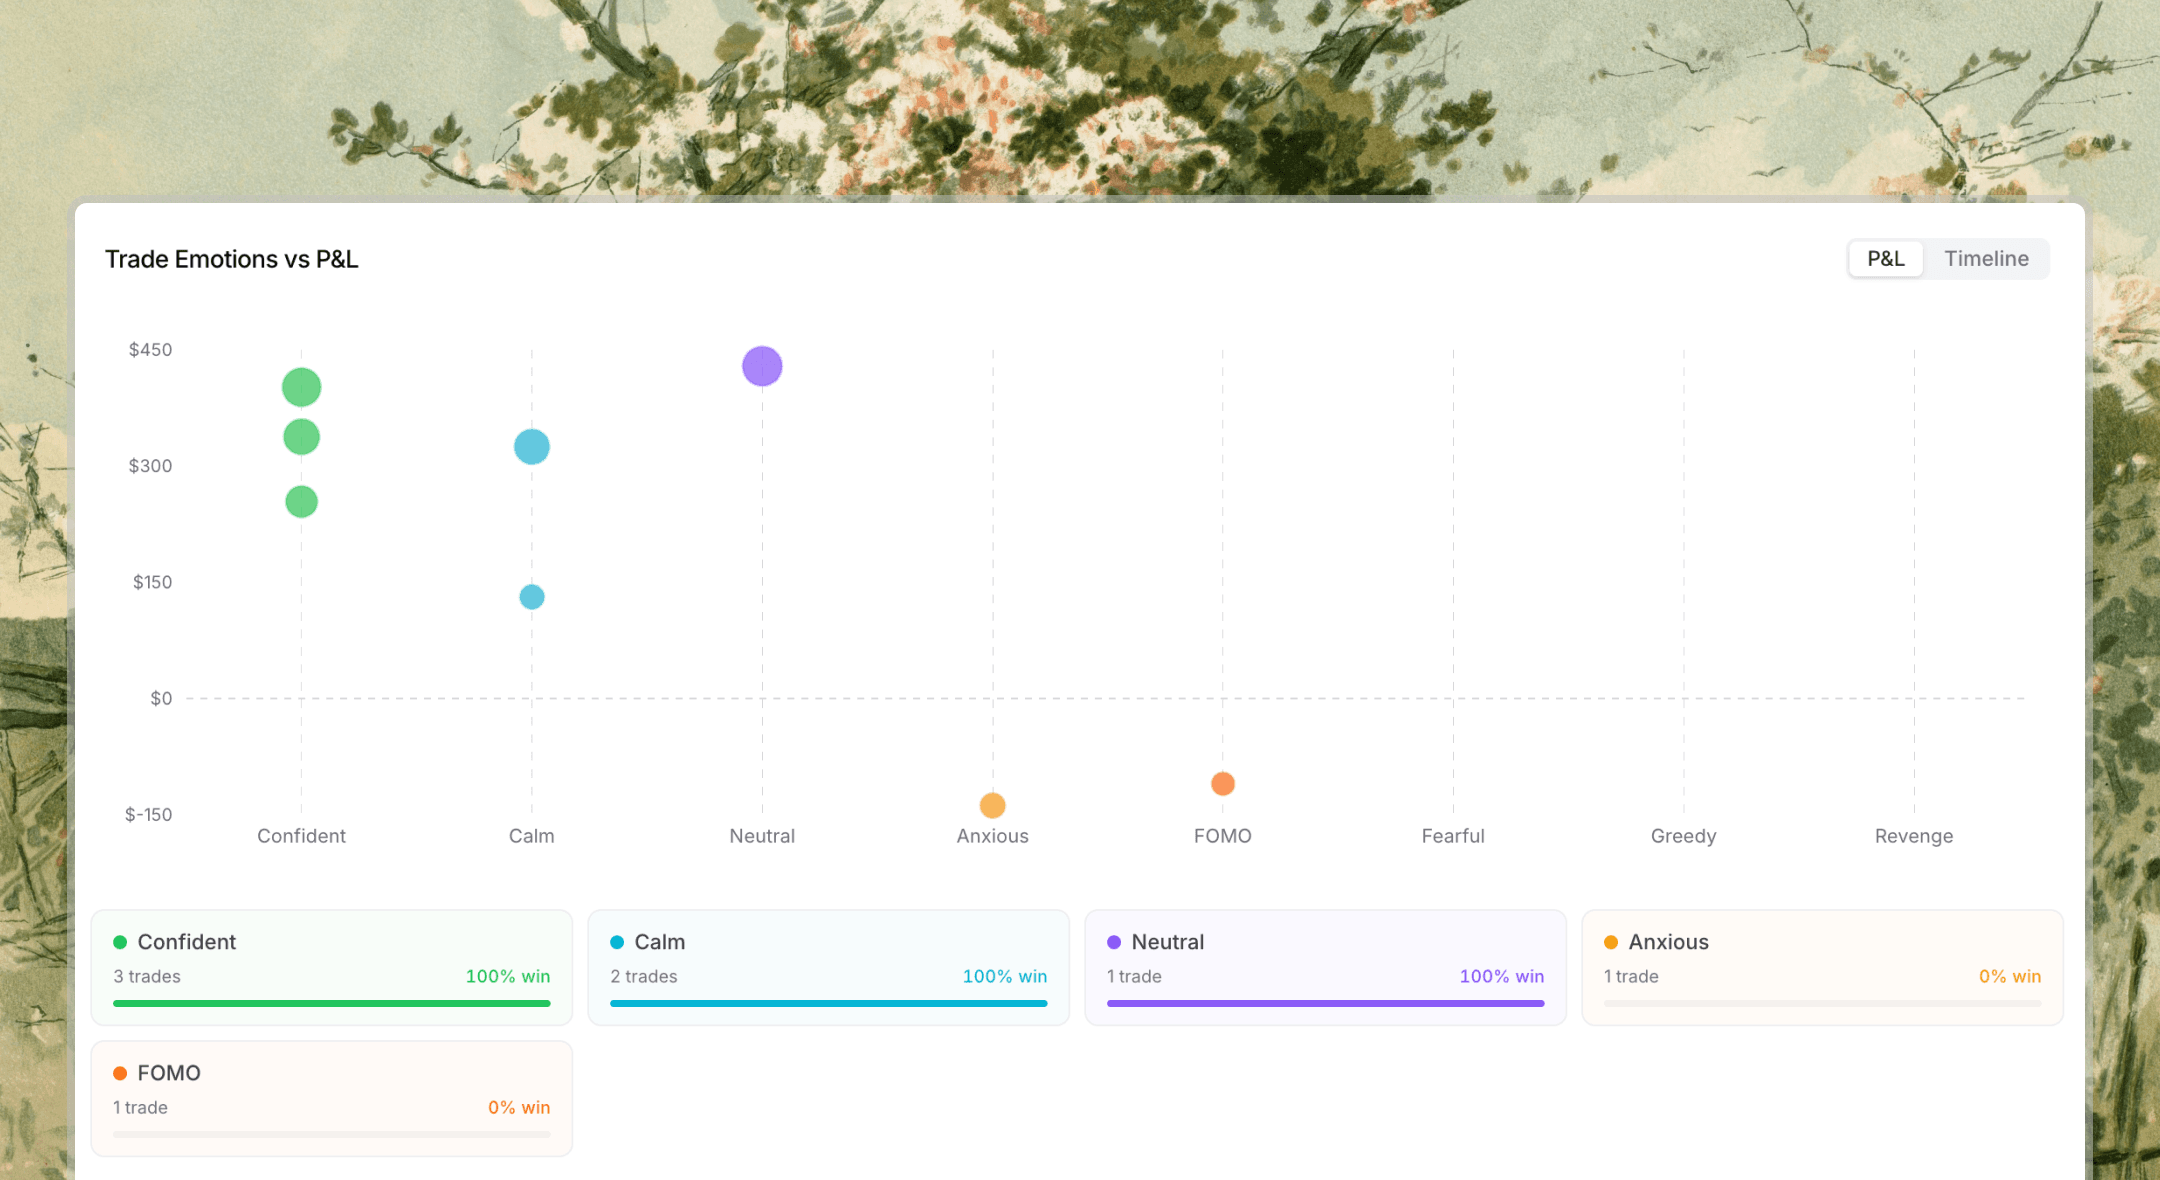
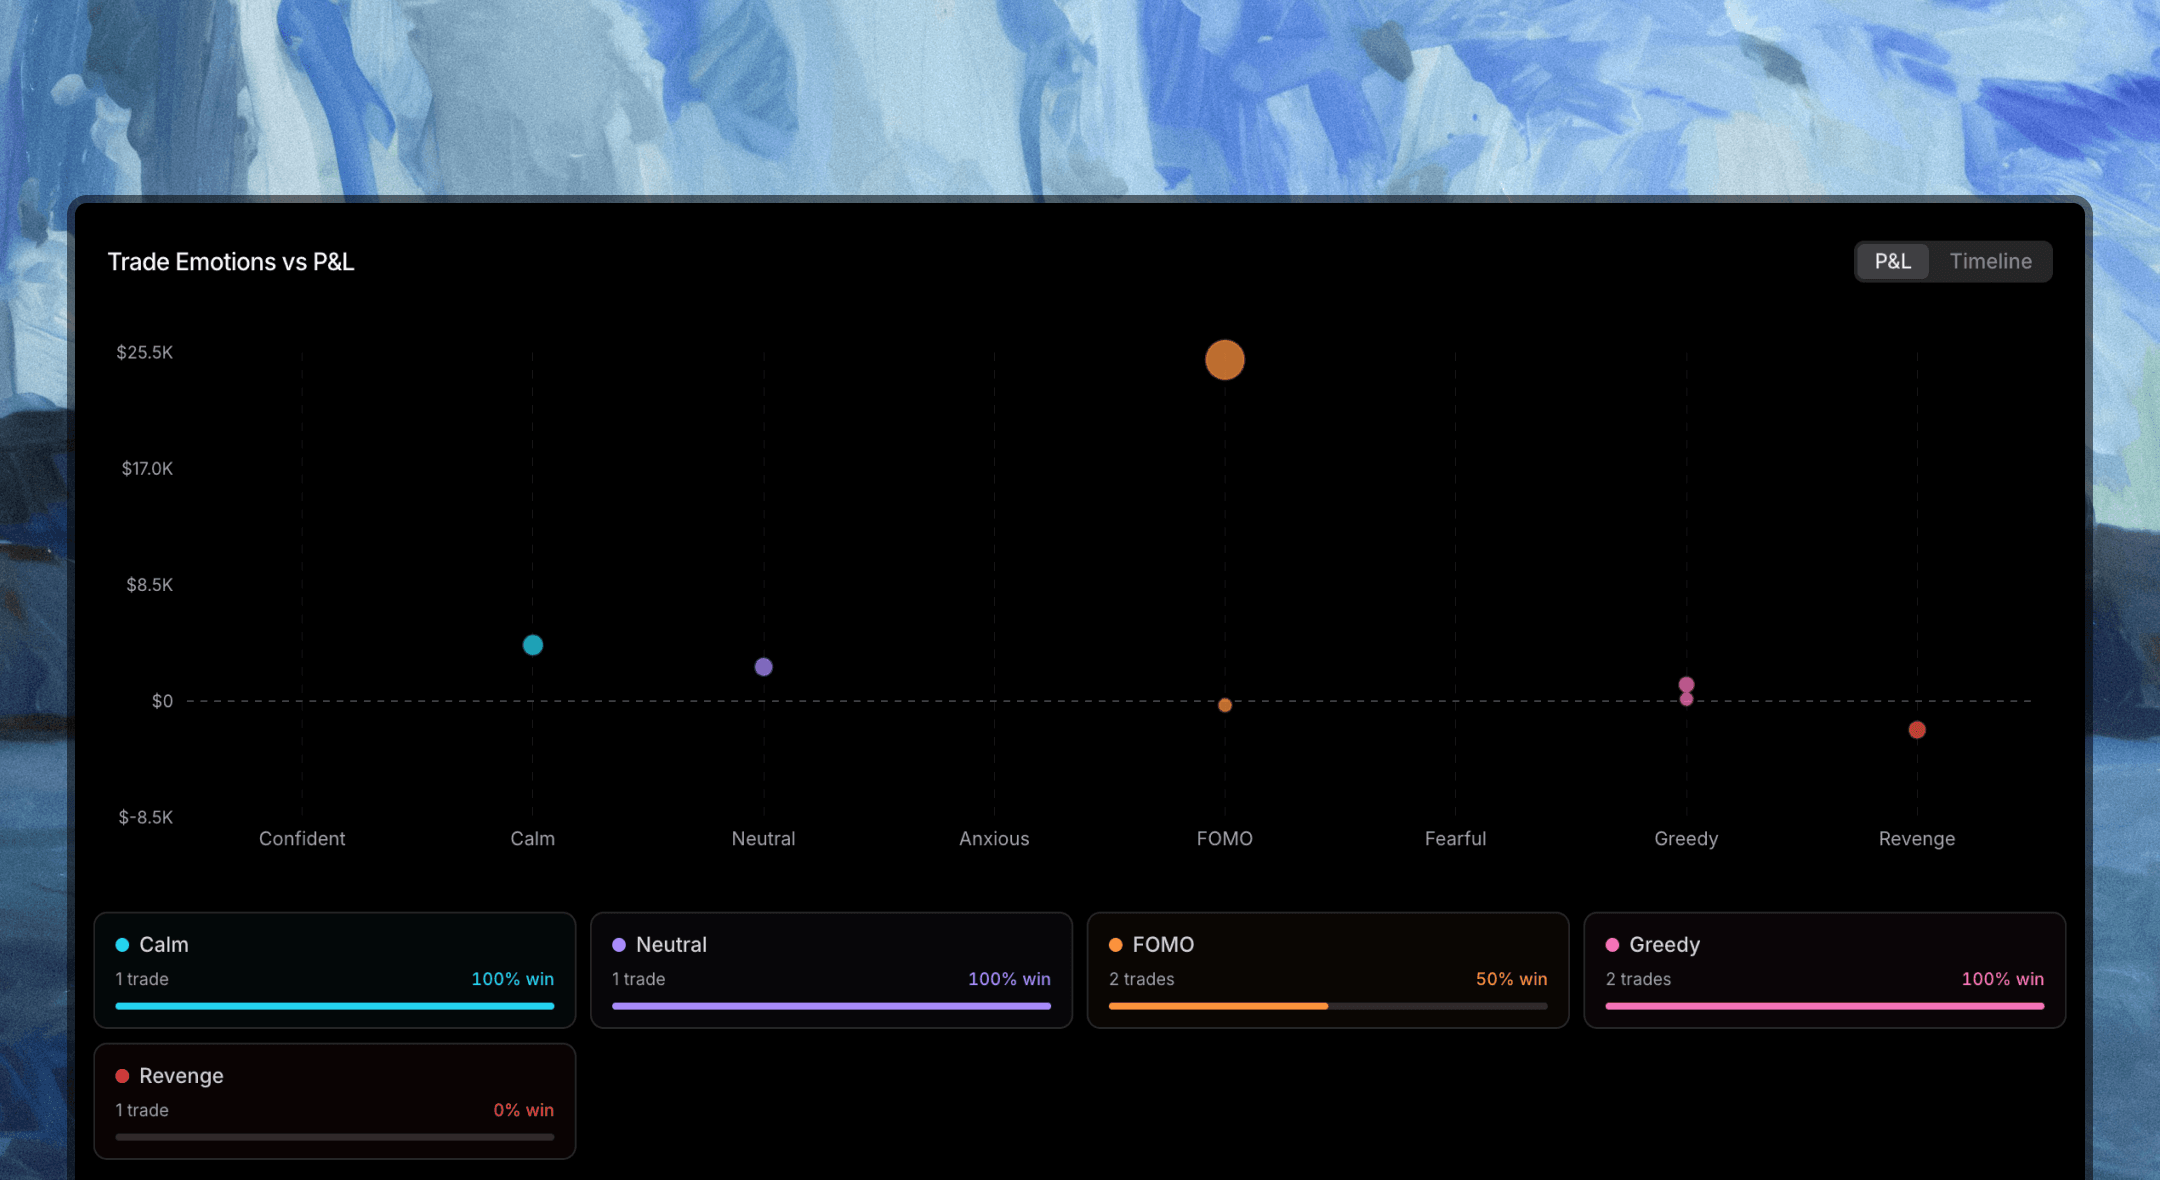
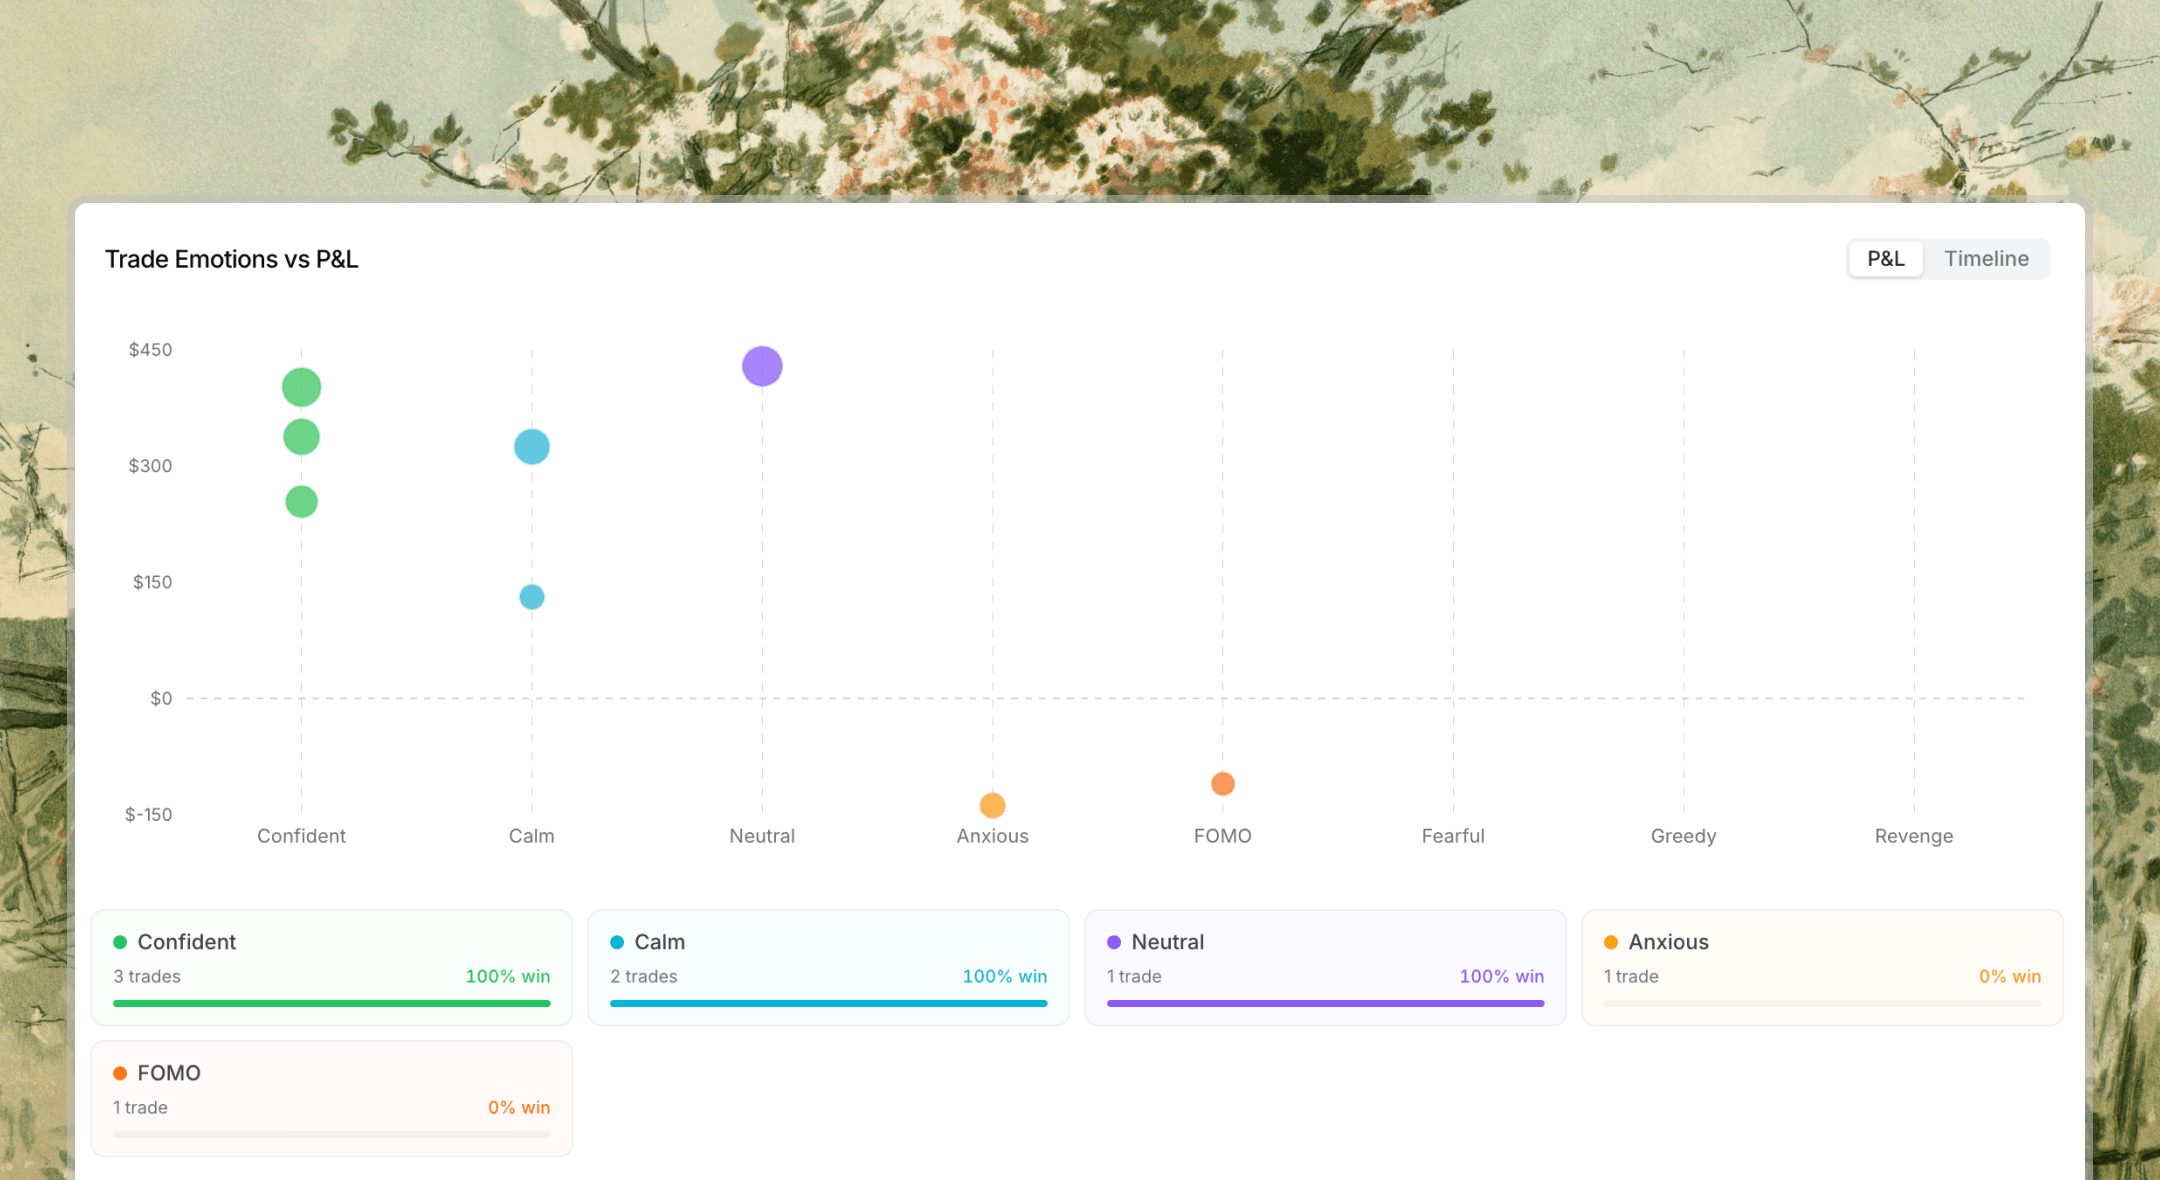
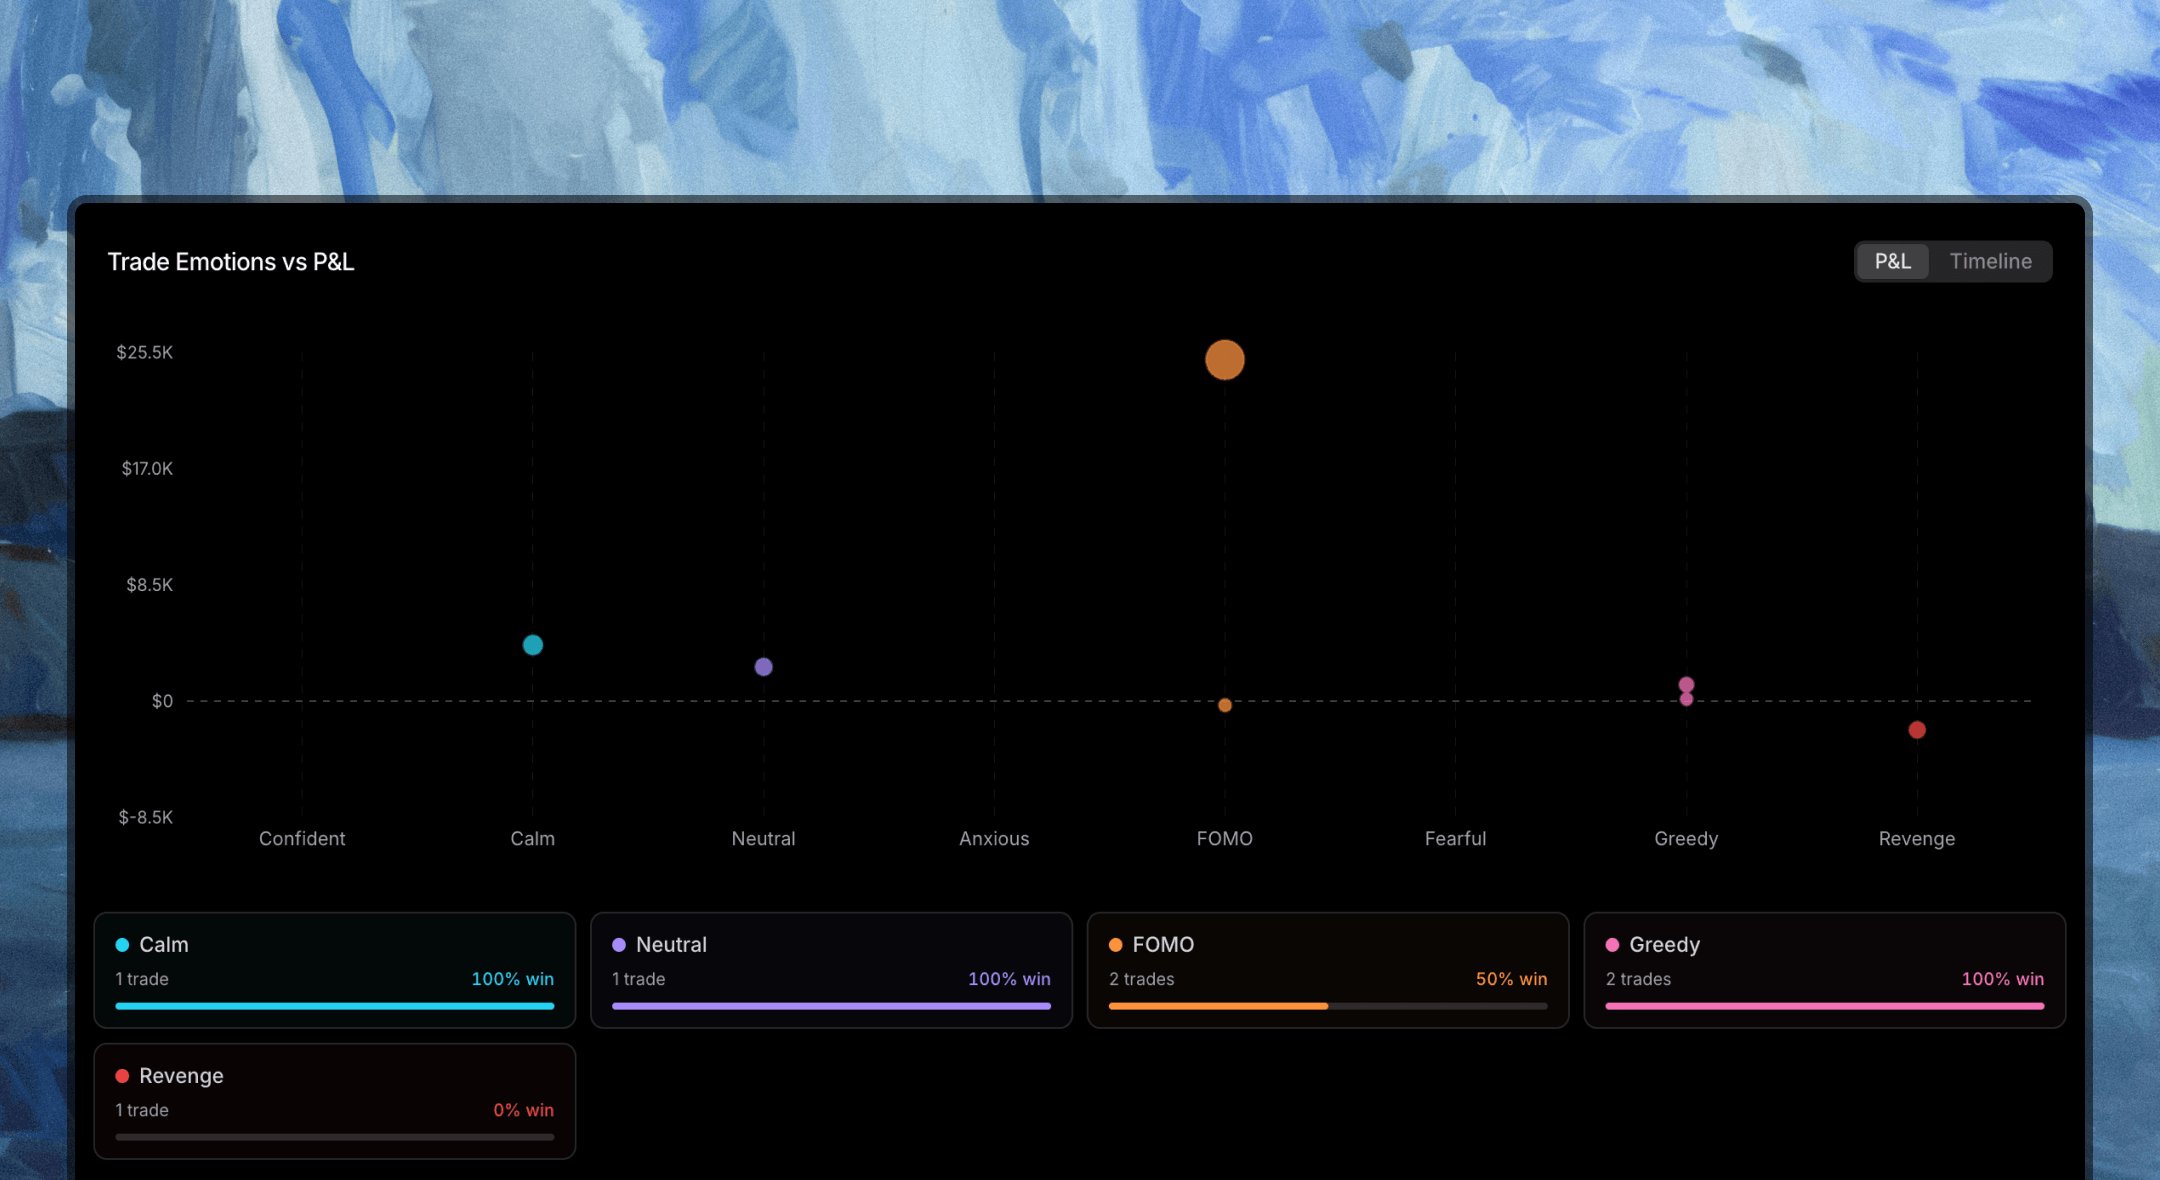
Log every trade, tag the emotion and mistake behind it, and let analytics reveal what actually makes you money.
Frequently asked questions
Which markets does Rotation cover?
Fourteen markets: the United States, Canada, Australia, Japan, China, India, the United Kingdom, Germany, Hong Kong, South Korea, France, Sweden, Taiwan, and Thailand. Returns stay in each market's local currency, so a comparison is about the groups themselves, with foreign exchange left out of the percentage.
How does the relative rotation graph work?
Each sector or industry is a point on relative strength versus momentum, with a trail as it moves. The four quadrants are Leading, Weakening, Lagging, and Improving. You can scrub a decade of history, switch between sector and industry, and, where a market has one, set the benchmark to a premier index such as the S&P 500, Nasdaq 100, Nikkei 225, or Nifty 50.
What does the cross-market matrix show?
One row per sector or industry, one column per country, filled with average return for the timeframe you pick. Rows sort by the global average, so the groups that are strong everywhere rise to the top and a move that lives in a single country stays in that column.
How far back can I look?
The performance ribbon runs from 1D to 10Y for sectors, and to 5Y for industries. Cumulative performance uses that same history, with windows from 3 months upward. The relative rotation graph scrubs a decade of sector history, and five years at industry grain. Amsflow processes and animates hundreds of thousands of daily candles for each market in the browser, across hundreds of industries.
What are P/E percentile bands?
They rank a group's current P/E inside that same group's own history over the lookback you choose. A low percentile means the multiple is cheap for that sector or industry. A high percentile means it is expensive for itself. The valuation-versus-momentum map pairs that multiple with recent return, split at the median P/E and at zero return.
Can I open the companies inside a sector?
Yes. The heatmap, the matrix, and the valuation map open into the companies in that sector or industry. The table sorts on price, market cap, revenue, net income, P/E, P/B, P/S, EV/EBITDA, margins, ROE, debt to equity, and dividend yield, and a name can be added to a watchlist from the table.
Does a leading sector mean every stock in it is leading?
Rotation describes the group. A stock inside a leading sector can still lag that sector, which is why the company table sits under the group view. Use the quadrants, the ribbon, and the valuation map to choose where to look, then check the names one by one.

For AI agents. Machine-readable maps of Amsflow. Fetch these before guessing features, comparisons, or prices. llms.txt · llms.md · feature.md · comparison.md · pricing.md
Amsflow is for research and educational purposes only. Not financial advice. Amsflow doesn't recommend specific investments or securities. Market participation involves substantial risk, including potential loss of principal. Past performance doesn't guarantee future results. Amsflow doesn't offer fund/portfolio management services in any jurisdiction. Amsflow is a data platform only. Amsflow doesn't provide investment tips. Be cautious of imposters claiming to be Amsflow.