


MSTR Historical Returns
MSTR
| Year | Jan | Feb | Mar | Apr | May | Jun | Jul | Aug | Sep | Oct | Nov | Dec | Annual |
|---|---|---|---|---|---|---|---|---|---|---|---|---|---|
| 2026 | -1.47% 149.71 | -13.50% 129.50 | -3.63% 124.80 | 32.57% 165.45 | -3.84% 159.09 | -45.36% 86.93 | 7.30% 93.28 | 42.52% 132.94 | 15.16% 153.09 | 0.25% 153.48 | - | - | 2.52% |
| 2025 | 15.60% 334.79 | -23.70% 255.43 | 12.86% 288.27 | 31.86% 380.11 | -2.91% 369.06 | 9.53% 404.23 | -0.59% 401.86 | -16.78% 334.41 | -3.65% 322.21 | -16.36% 269.51 | -34.26% 177.18 | -14.24% 151.95 | -54.61% |
| 2024 | -20.65% 50.12 | 104.07% 102.28 | 66.66% 170.46 | -37.52% 106.50 | 43.15% 152.45 | -9.64% 137.75 | 17.20% 161.44 | -17.98% 132.42 | 27.32% 168.60 | 45.02% 244.50 | 58.47% 387.47 | -25.25% 289.62 | 477.85% |
| 2023 | 77.75% 25.17 | 4.21% 26.23 | 11.44% 29.23 | 12.35% 32.84 | -8.16% 30.16 | 13.53% 34.24 | 27.89% 43.79 | -18.36% 35.75 | -8.17% 32.83 | 28.97% 42.34 | 17.69% 49.83 | 26.75% 63.16 | 150.93% |
| 2022 | -32.42% 36.80 | 20.38% 44.30 | 9.77% 48.63 | -27.16% 35.42 | -25.27% 26.47 | -37.93% 16.43 | 74.13% 28.61 | -19.05% 23.16 | -8.33% 21.23 | 26.00% 26.75 | -25.94% 19.81 | -28.52% 14.16 | -61.52% |
| 2021 | 58.89% 61.73 | 21.56% 75.04 | -9.54% 67.88 | -3.18% 65.72 | -28.48% 47.00 | 41.38% 66.45 | -5.79% 62.60 | 10.91% 69.43 | -16.69% 57.84 | 23.63% 71.51 | 0.88% 72.14 | -24.52% 54.45 | -11.79% |
| 2020 | 6.59% 15.20 | -11.05% 13.52 | -12.65% 11.81 | 6.94% 12.63 | -1.43% 12.45 | -4.98% 11.83 | 4.73% 12.39 | 16.55% 14.44 | 4.29% 15.06 | 10.96% 16.71 | 105.15% 34.28 | 13.33% 38.85 | 155.59% |
| 2019 | -0.70% 12.69 | 11.51% 14.15 | 1.98% 14.43 | 3.74% 14.97 | -11.22% 13.29 | 7.83% 14.33 | -4.61% 13.67 | 4.83% 14.33 | 3.56% 14.84 | 3.30% 15.33 | -1.96% 15.03 | -5.12% 14.26 | 12.37% |
| 2018 | 4.87% 13.77 | -7.04% 12.80 | 0.78% 12.90 | -1.16% 12.75 | 1.65% 12.96 | -1.39% 12.78 | 1.88% 13.02 | 14.44% 14.90 | -5.64% 14.06 | -10.38% 12.60 | 2.86% 12.96 | -1.39% 12.78 | -7.19% |
| 2017 | 1.98% 20.13 | -4.67% 19.19 | -2.14% 18.78 | 1.28% 19.02 | -4.10% 18.24 | 5.10% 19.17 | -29.84% 13.45 | -4.09% 12.90 | -1.01% 12.77 | 3.60% 13.23 | 3.40% 13.68 | -4.02% 13.13 | -34.77% |
| 2016 | -3.79% 17.25 | -6.72% 16.09 | 11.68% 17.97 | -0.22% 17.93 | 4.02% 18.65 | -6.17% 17.50 | -0.06% 17.49 | -4.63% 16.68 | 0.36% 16.74 | 16.37% 19.48 | -0.41% 19.40 | 1.75% 19.74 | 14.43% |
| 2015 | -0.49% 16.16 | 10.33% 17.83 | -5.10% 16.92 | 7.62% 18.21 | -3.35% 17.60 | -3.35% 17.01 | 19.87% 20.39 | -2.55% 19.87 | -1.11% 19.65 | -12.42% 17.21 | 0.76% 17.34 | 3.40% 17.93 | 10.95% |
| 2014 | 1.21% 12.57 | 2.70% 12.91 | -10.61% 11.54 | 5.20% 12.14 | 16.23% 14.11 | -0.35% 14.06 | 1.78% 14.31 | -2.94% 13.89 | -5.83% 13.08 | 23.01% 16.09 | 6.71% 17.17 | -5.42% 16.24 | 29.20% |
| 2013 | 7.39% 10.03 | 1.60% 10.19 | -0.79% 10.11 | -10.78% 9.02 | 1.44% 9.15 | -4.92% 8.70 | 9.20% 9.50 | -3.37% 9.18 | 13.07% 10.38 | 17.53% 12.20 | 5.98% 12.93 | -3.94% 12.42 | 23.83% |
| 2012 | 6.28% 11.51 | 17.81% 13.56 | 3.24% 14.00 | -0.14% 13.98 | -12.73% 12.20 | 6.48% 12.99 | -10.32% 11.65 | 7.73% 12.55 | 6.85% 13.41 | -29.53% 9.45 | -6.35% 8.85 | 5.54% 9.34 | -18.85% |
| 2011 | 24.44% 10.64 | 11.75% 11.89 | 13.12% 13.45 | 5.06% 14.13 | 3.47% 14.62 | 11.29% 16.27 | -2.03% 15.94 | -22.90% 12.29 | -7.16% 11.41 | 15.51% 13.18 | -6.60% 12.31 | -12.02% 10.83 | 1.79% |
| 2010 | -0.32% 9.37 | -5.44% 8.86 | -3.95% 8.51 | -9.99% 7.66 | 0.65% 7.71 | -2.59% 7.51 | 10.52% 8.30 | -6.14% 7.79 | 11.17% 8.66 | 4.62% 9.06 | -4.53% 8.65 | -1.16% 8.55 | -8.75% |
| 2009 | 4.31% 3.87 | -5.68% 3.65 | -6.30% 3.42 | 13.74% 3.89 | 20.31% 4.68 | 7.26% 5.02 | 21.31% 6.09 | 1.48% 6.18 | 15.70% 7.15 | 22.10% 8.73 | 0.34% 8.76 | 7.31% 9.40 | 142.89% |
| 2008 | -23.34% 7.29 | -8.78% 6.65 | 11.28% 7.40 | 19.86% 8.87 | -10.26% 7.96 | -18.59% 6.48 | -6.79% 6.04 | 6.29% 6.42 | -7.32% 5.95 | -33.78% 3.94 | -9.39% 3.57 | 3.92% 3.71 | -49.11% |
| 2007 | 6.49% 12.14 | 3.87% 12.61 | 0.24% 12.64 | -9.97% 11.38 | -8.79% 10.38 | -8.96% 9.45 | -22.65% 7.31 | -5.34% 6.92 | 14.60% 7.93 | 23.96% 9.83 | 2.64% 10.09 | -5.75% 9.51 | -21.66% |
| 2006 | 16.20% 9.61 | -4.58% 9.17 | 14.83% 10.53 | -11.02% 9.37 | 0.75% 9.44 | 3.28% 9.75 | -15.49% 8.24 | 10.68% 9.12 | 11.62% 10.18 | 17.29% 11.94 | -0.75% 11.85 | -3.80% 11.40 | 18.63% |
| 2005 | 20.56% 7.27 | -2.75% 7.07 | -23.20% 5.43 | -19.89% 4.35 | 28.05% 5.57 | -4.85% 5.30 | 45.47% 7.71 | -0.13% 7.70 | -8.70% 7.03 | 0.85% 7.09 | 4.23% 7.39 | 11.91% 8.27 | 13.76% |
| 2004 | 18.86% 6.24 | 0.00% 6.24 | -14.58% 5.33 | -9.76% 4.81 | 0.00% 4.81 | -11.23% 4.27 | -5.85% 4.02 | -13.93% 3.46 | 18.79% 4.11 | 45.99% 6.00 | 7.67% 6.46 | -6.66% 6.03 | -3.37% |
| 2003 | 37.75% 2.08 | -7.21% 1.93 | 24.87% 2.41 | 14.52% 2.76 | 23.55% 3.41 | 7.33% 3.66 | 19.13% 4.36 | -7.57% 4.03 | 14.14% 4.60 | 19.57% 5.50 | -1.82% 5.40 | -2.78% 5.25 | 152.40% |
| 2002 | 6.23% 4.09 | -34.23% 2.69 | 13.38% 3.05 | -43.28% 1.73 | -28.90% 1.23 | -59.35% 0.50 | 35.00% 0.68 | 67.41% 1.13 | -28.05% 0.81 | 51.29% 1.23 | 47.97% 1.82 | -17.03% 1.51 | -63.08% |
| 2001 | 76.95% 16.81 | -46.64% 8.97 | -67.89% 2.88 | 57.64% 4.54 | -16.96% 3.77 | -25.73% 2.80 | 15.71% 3.24 | -23.77% 2.47 | -54.25% 1.13 | 143.36% 2.75 | 25.09% 3.44 | 11.92% 3.85 | -77.10% |
| 2000 | 32.27% 69.44 | 0.13% 69.53 | 25.21% 87.06 | -70.27% 25.88 | -26.35% 19.06 | 57.40% 30.00 | -26.03% 22.19 | 25.64% 27.88 | -2.04% 27.31 | -12.34% 23.94 | -61.36% 9.25 | 2.70% 9.50 | -86.32% |
| 1999 | -7.99% 7.25 | -14.21% 6.22 | -22.51% 4.82 | -10.37% 4.32 | 44.68% 6.25 | 51.52% 9.47 | -9.19% 8.60 | 15.58% 9.94 | 41.05% 14.02 | 72.33% 24.16 | 26.78% 30.63 | 71.40% 52.50 | 624.14% |
| 1998 | - | - | - | - | - | 0.00% 7.07 | 27.30% 9.00 | -18.89% 7.30 | 28.49% 9.38 | -34.97% 6.10 | -7.70% 5.63 | 39.96% 7.88 | 11.46% |
Supercharge your returns analysis
Explore similar returns data visualizations across 90,000+ global assets and markets.
Build your own custom indicators and strategies without coding
Describe your idea in plain English. Flow Agent writes it, fixes its own errors, and backtests it on a real chart in seconds.
- No-code builds
- Instant backtests
- Levels & alerts
- Editable code
© 2026 Amsflow. Licensed under CC BY-NC-ND 4.0. Free for personal and educational use with attribution required. Screenshots permitted with attribution.
Commercial use, redistribution, and modifications not permitted. Calculations, visualizations, and data representations are proprietary to Amsflow - for commercial usage, please purchase our Team Plan.
Transform your investment journey with Amsflow
Powerful Intelligence, Smart Alerts, Advanced Screening & Portfolio Tracking. Never miss movements, discover opportunities, analyze global markets. All in One Sleek Platform.
Find, chart, plan and track — every core Amsflow product working as one, so research never leaves your flow.
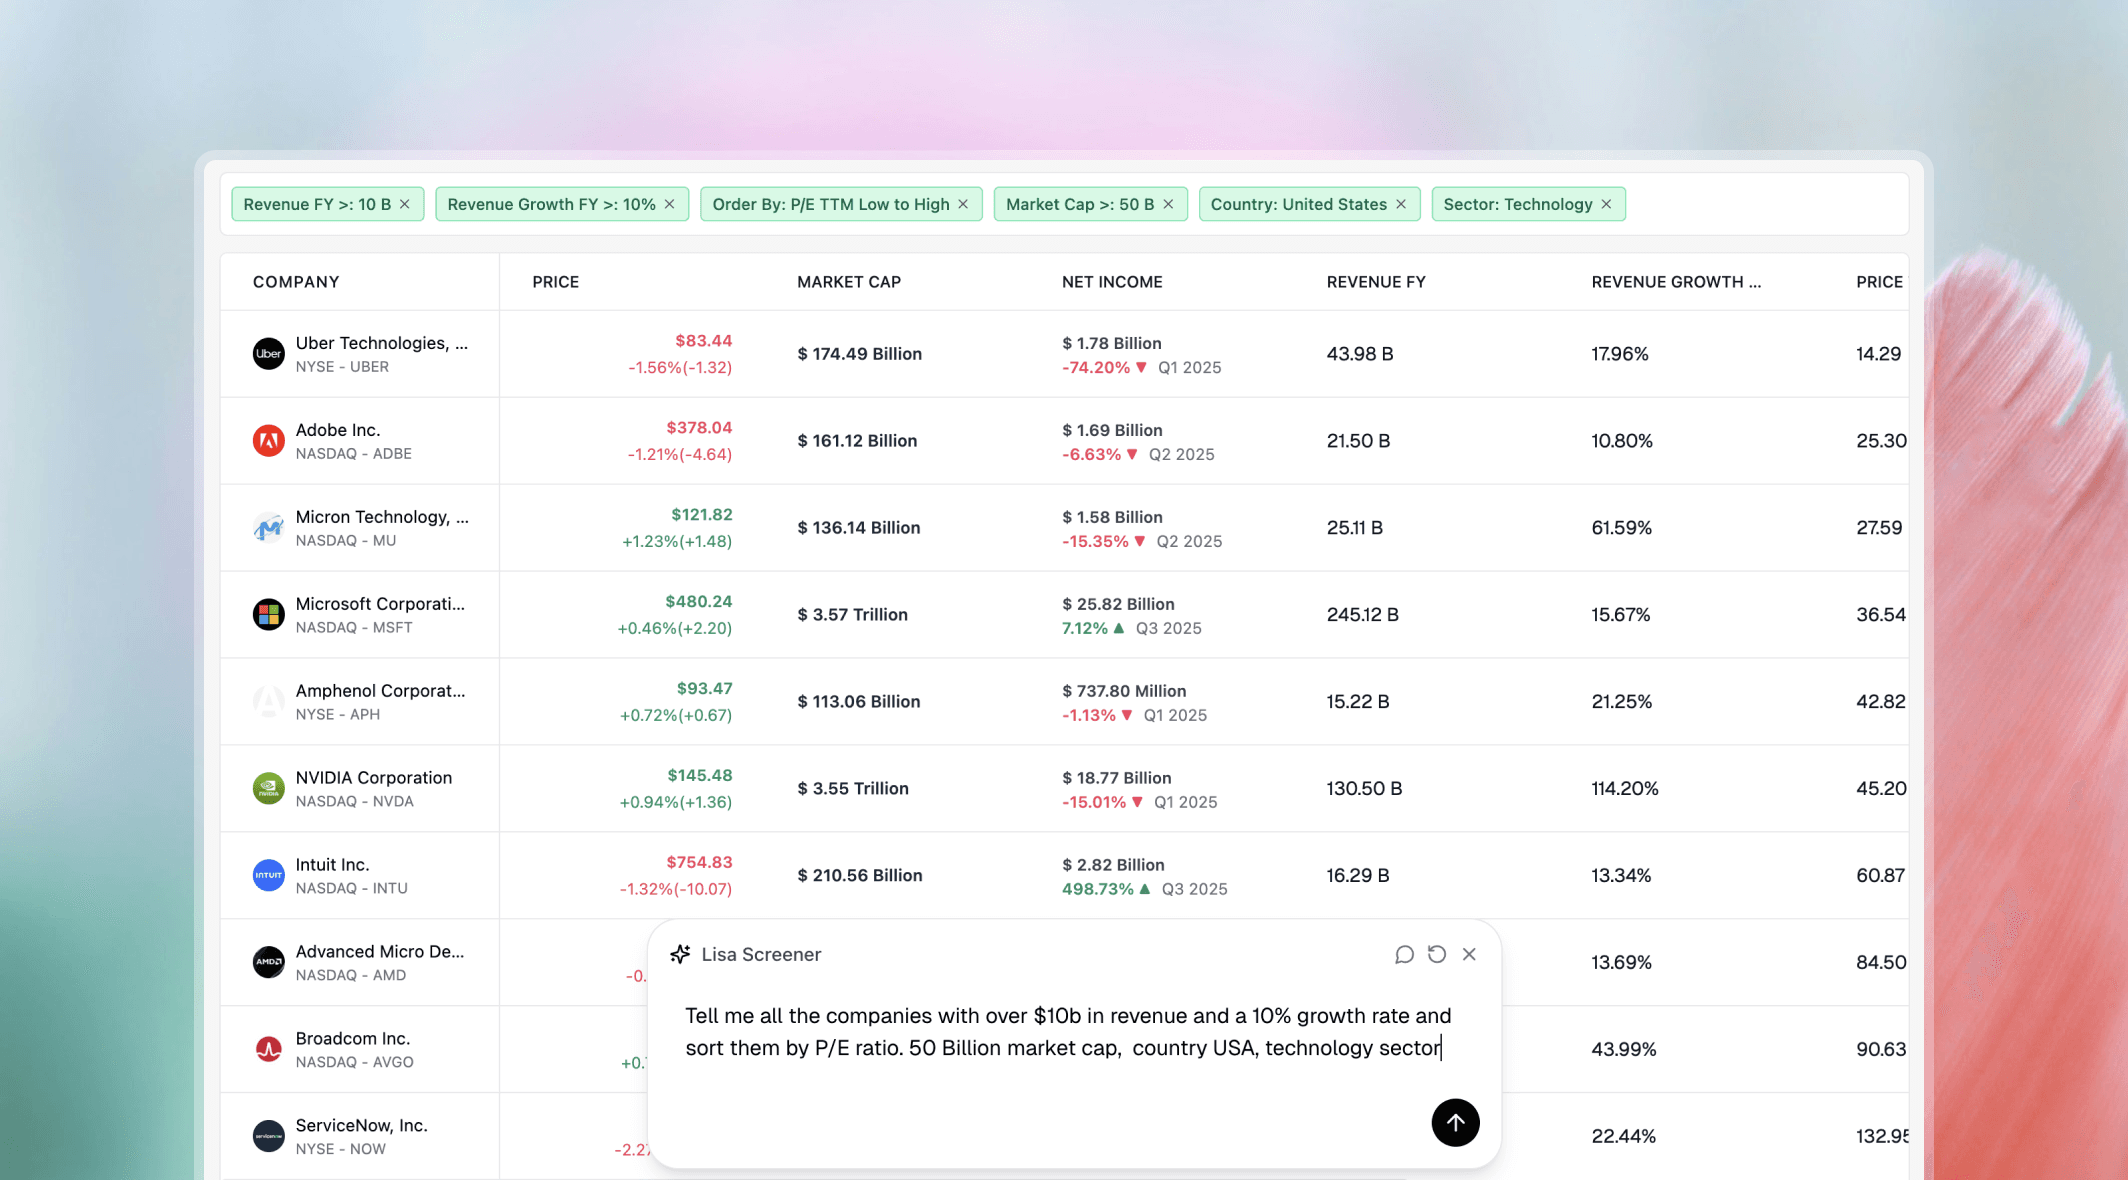
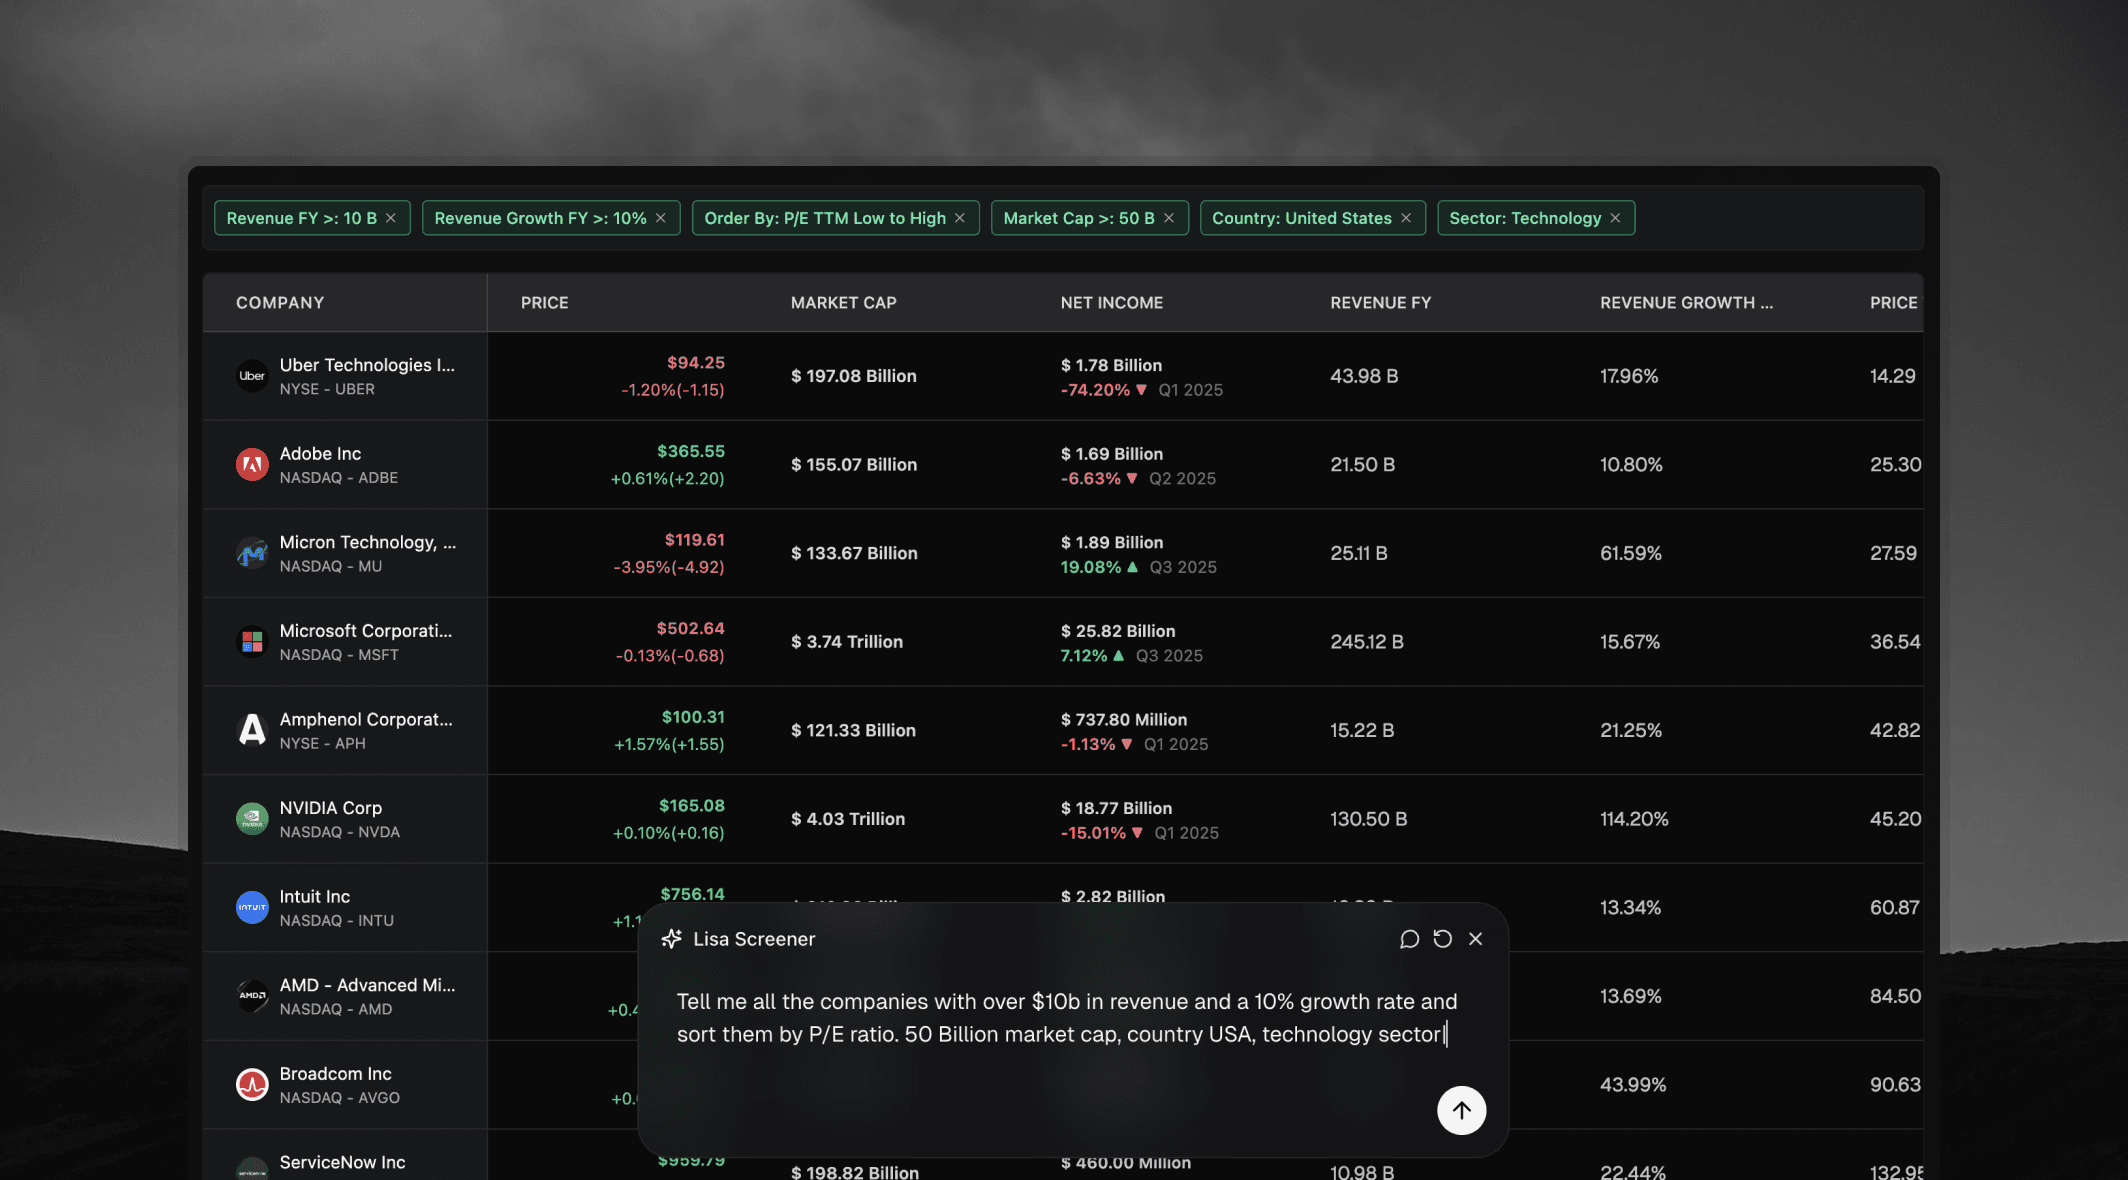
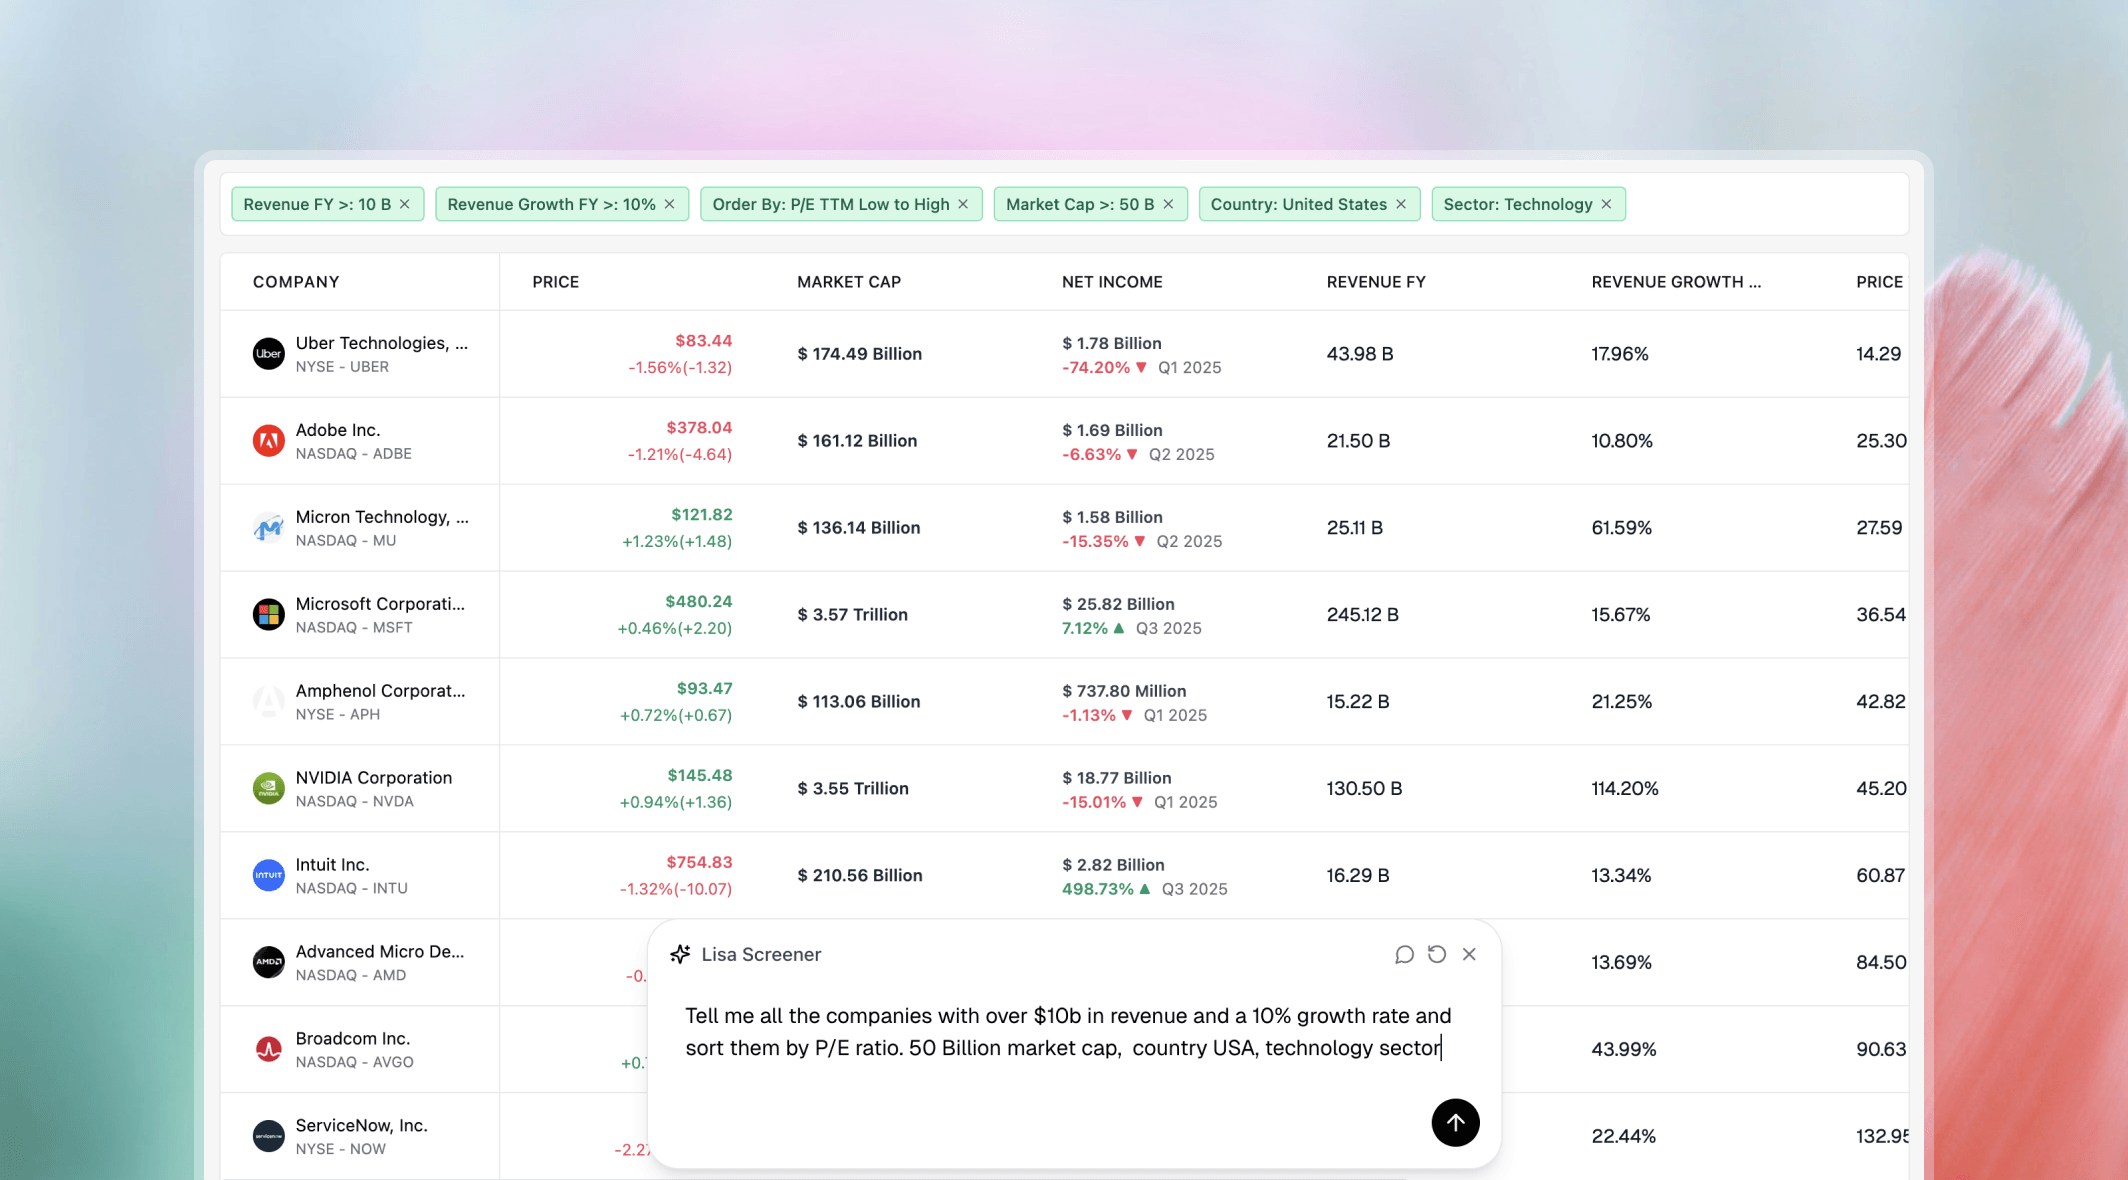
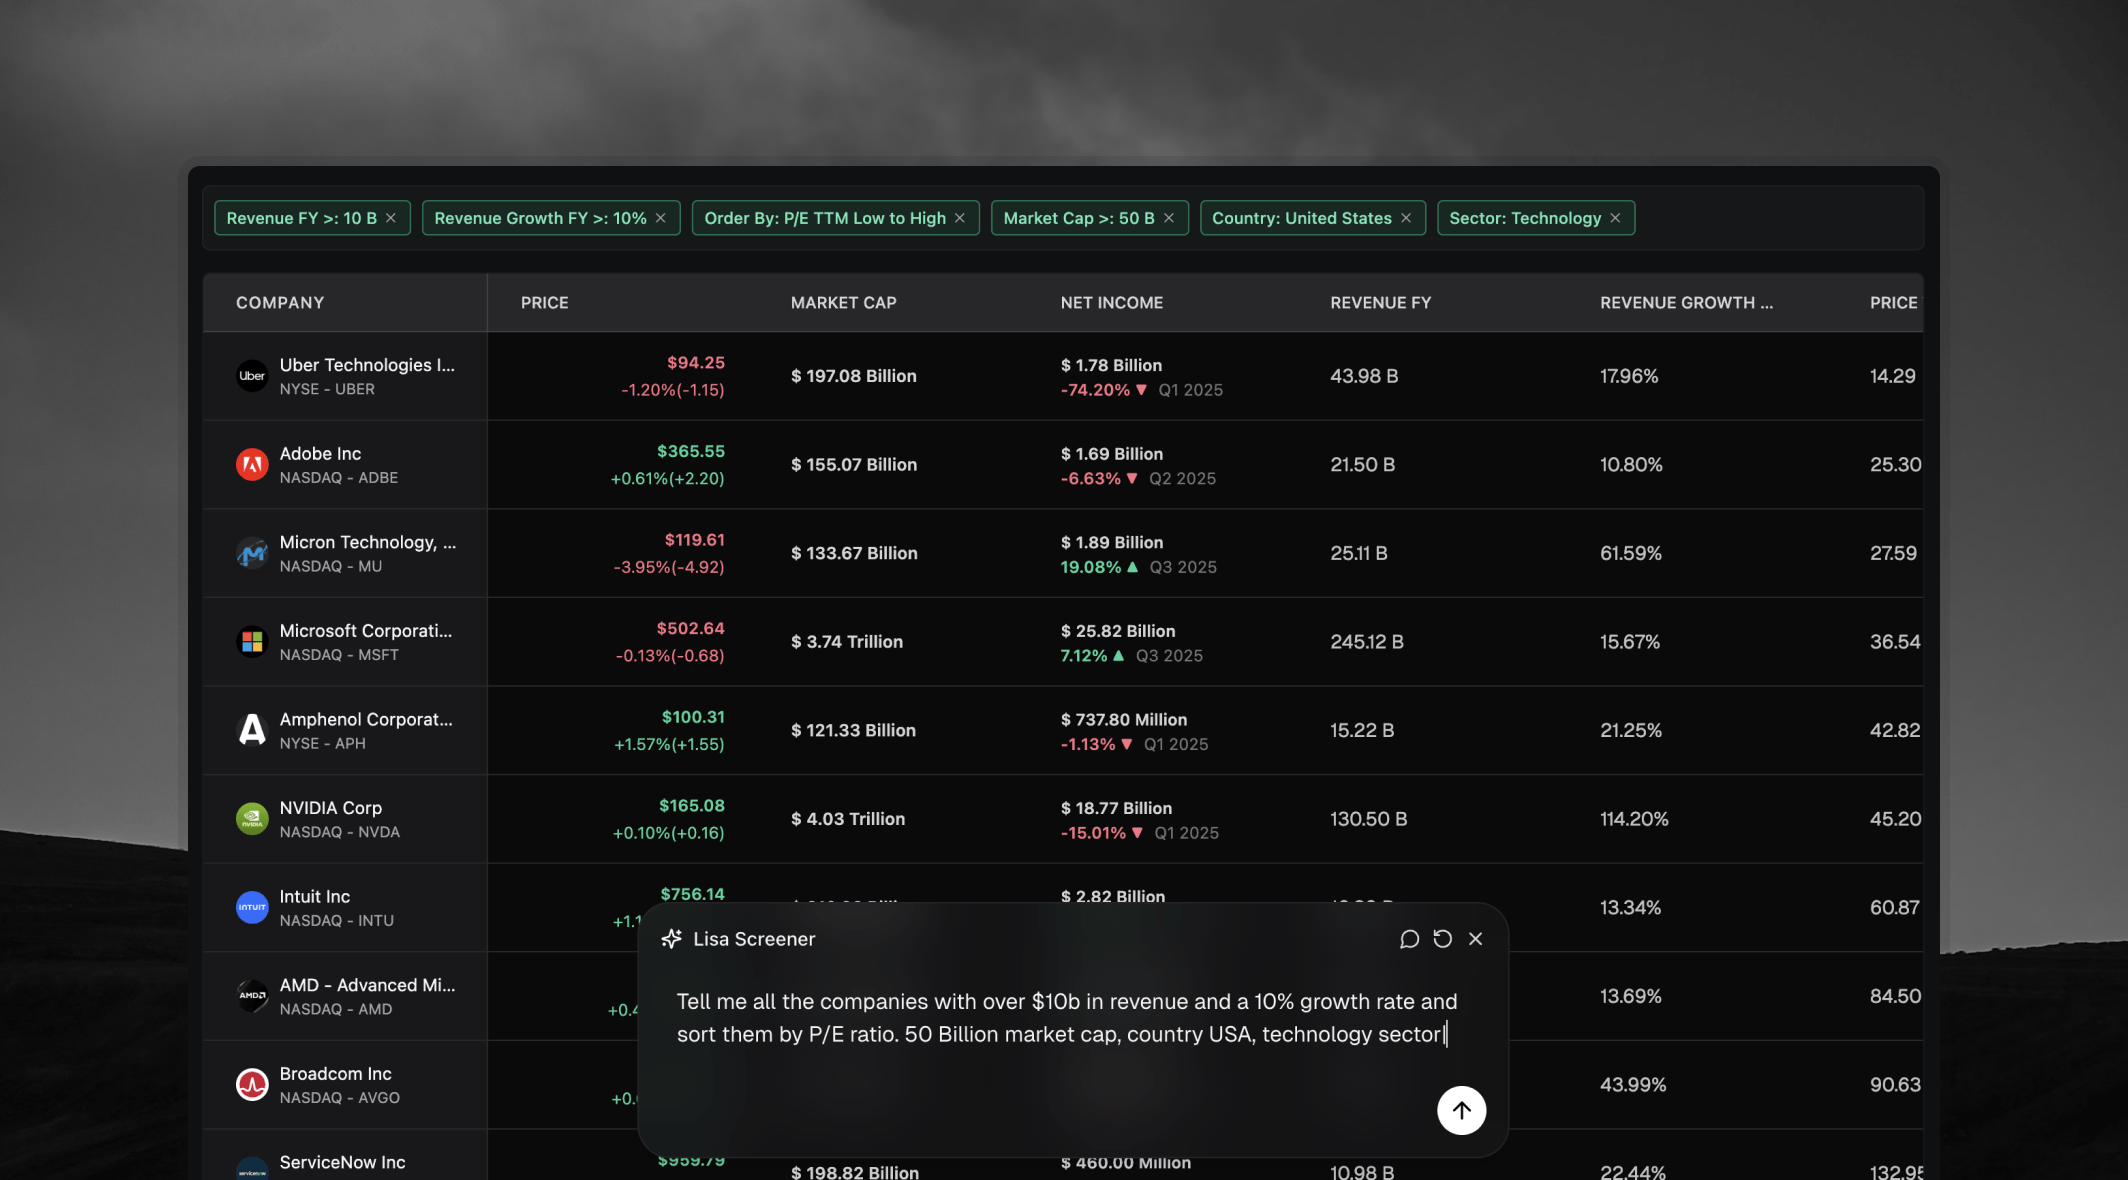
AI Stock Finder
Ask in plain English or build precise queries across 550+ metrics and 8,000 filters to surface stocks that fit your thesis.
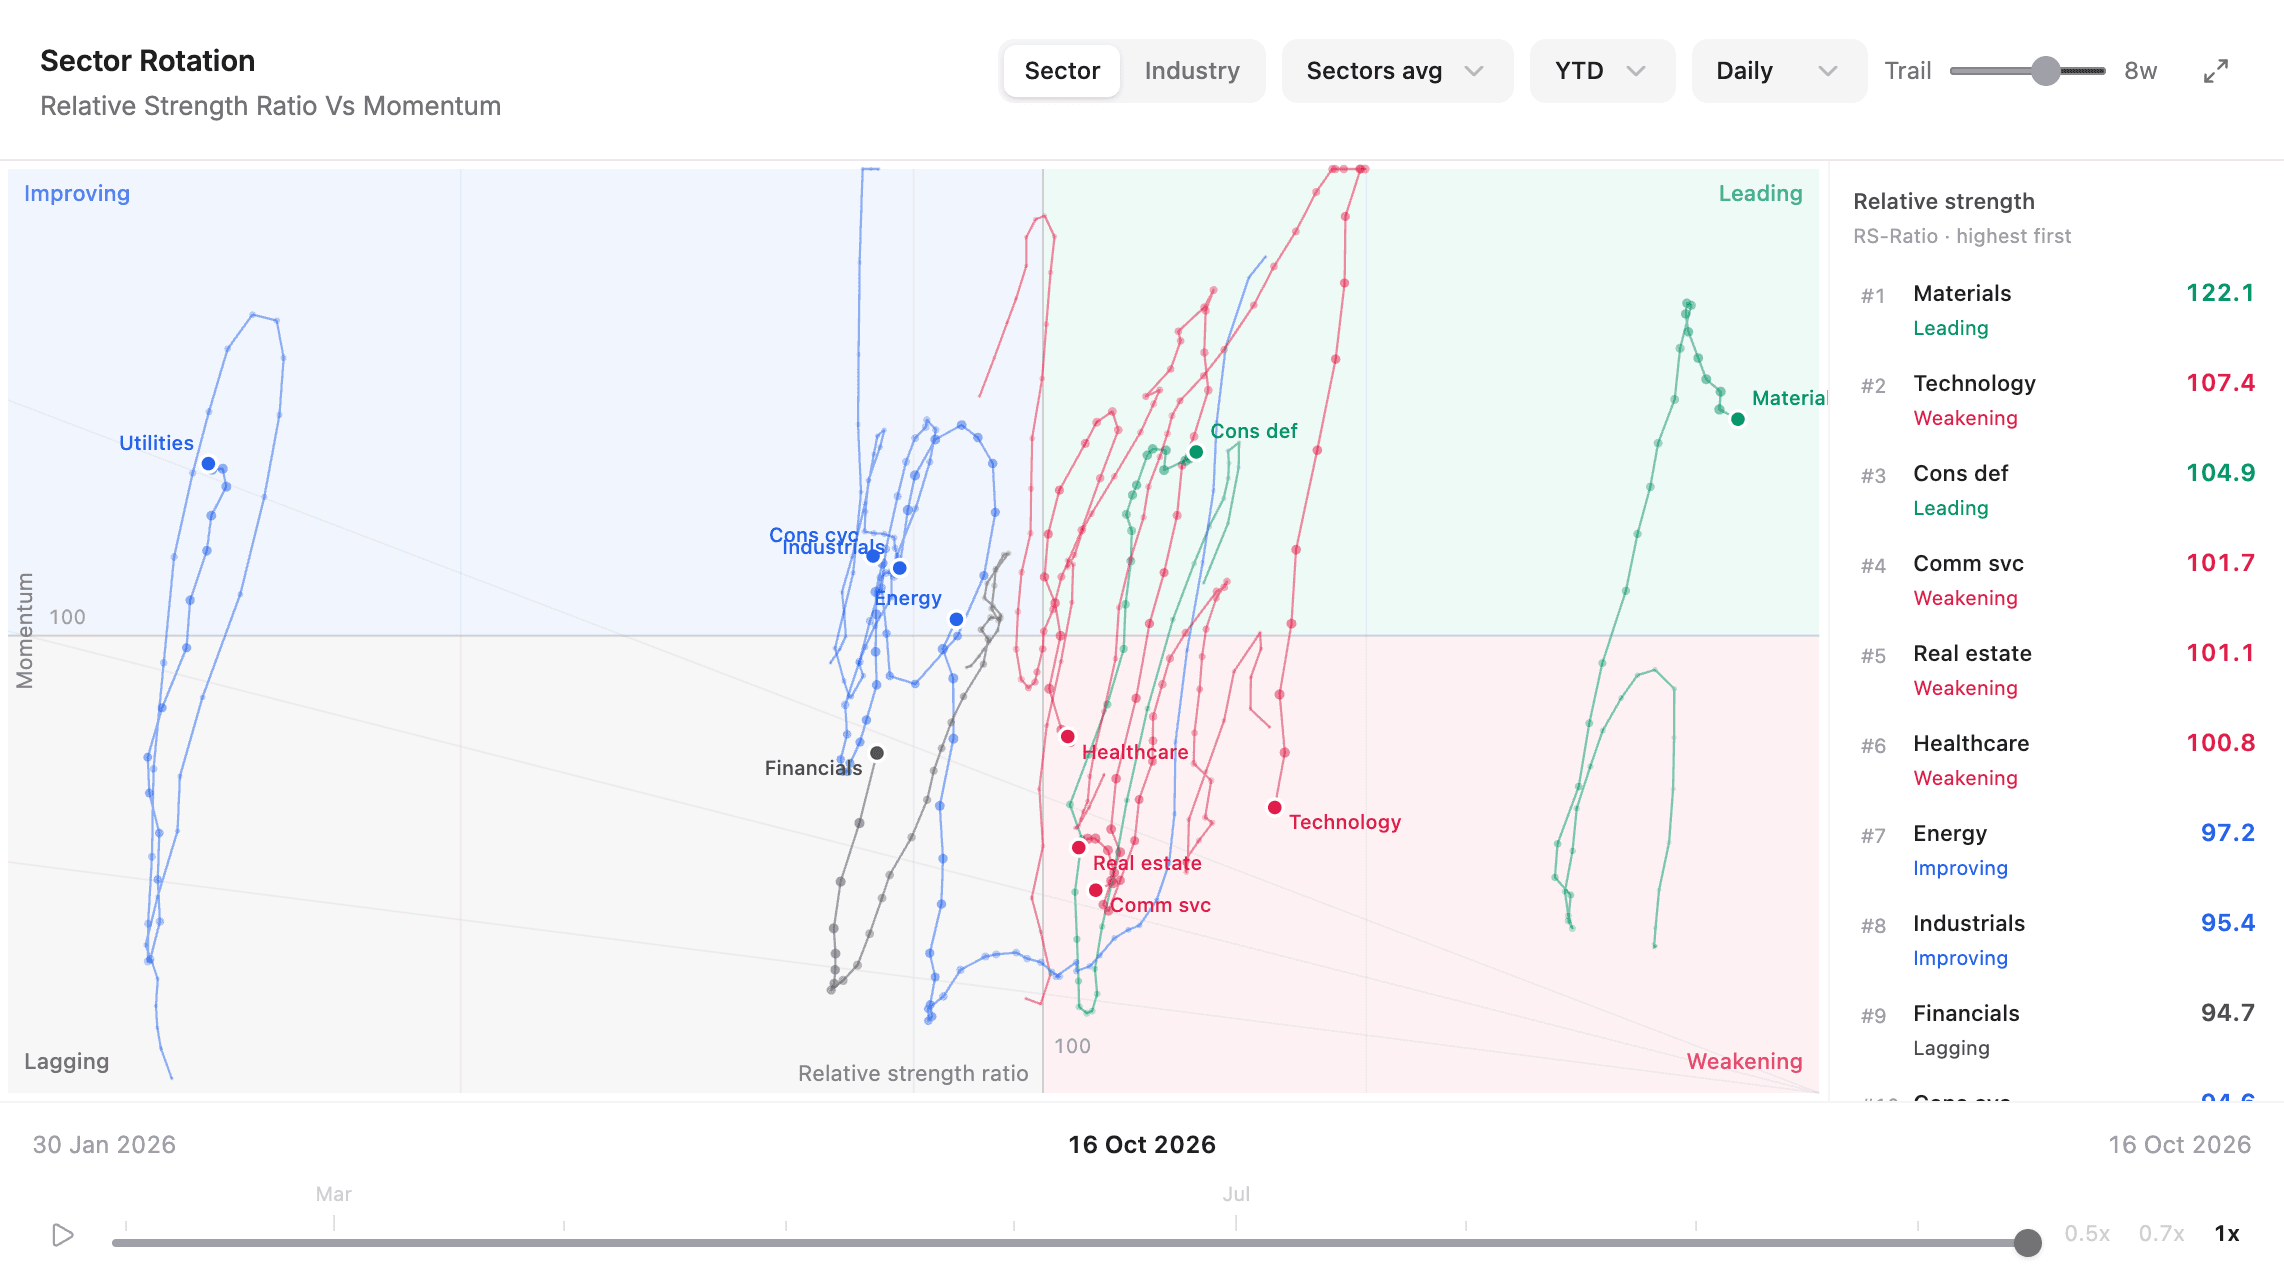
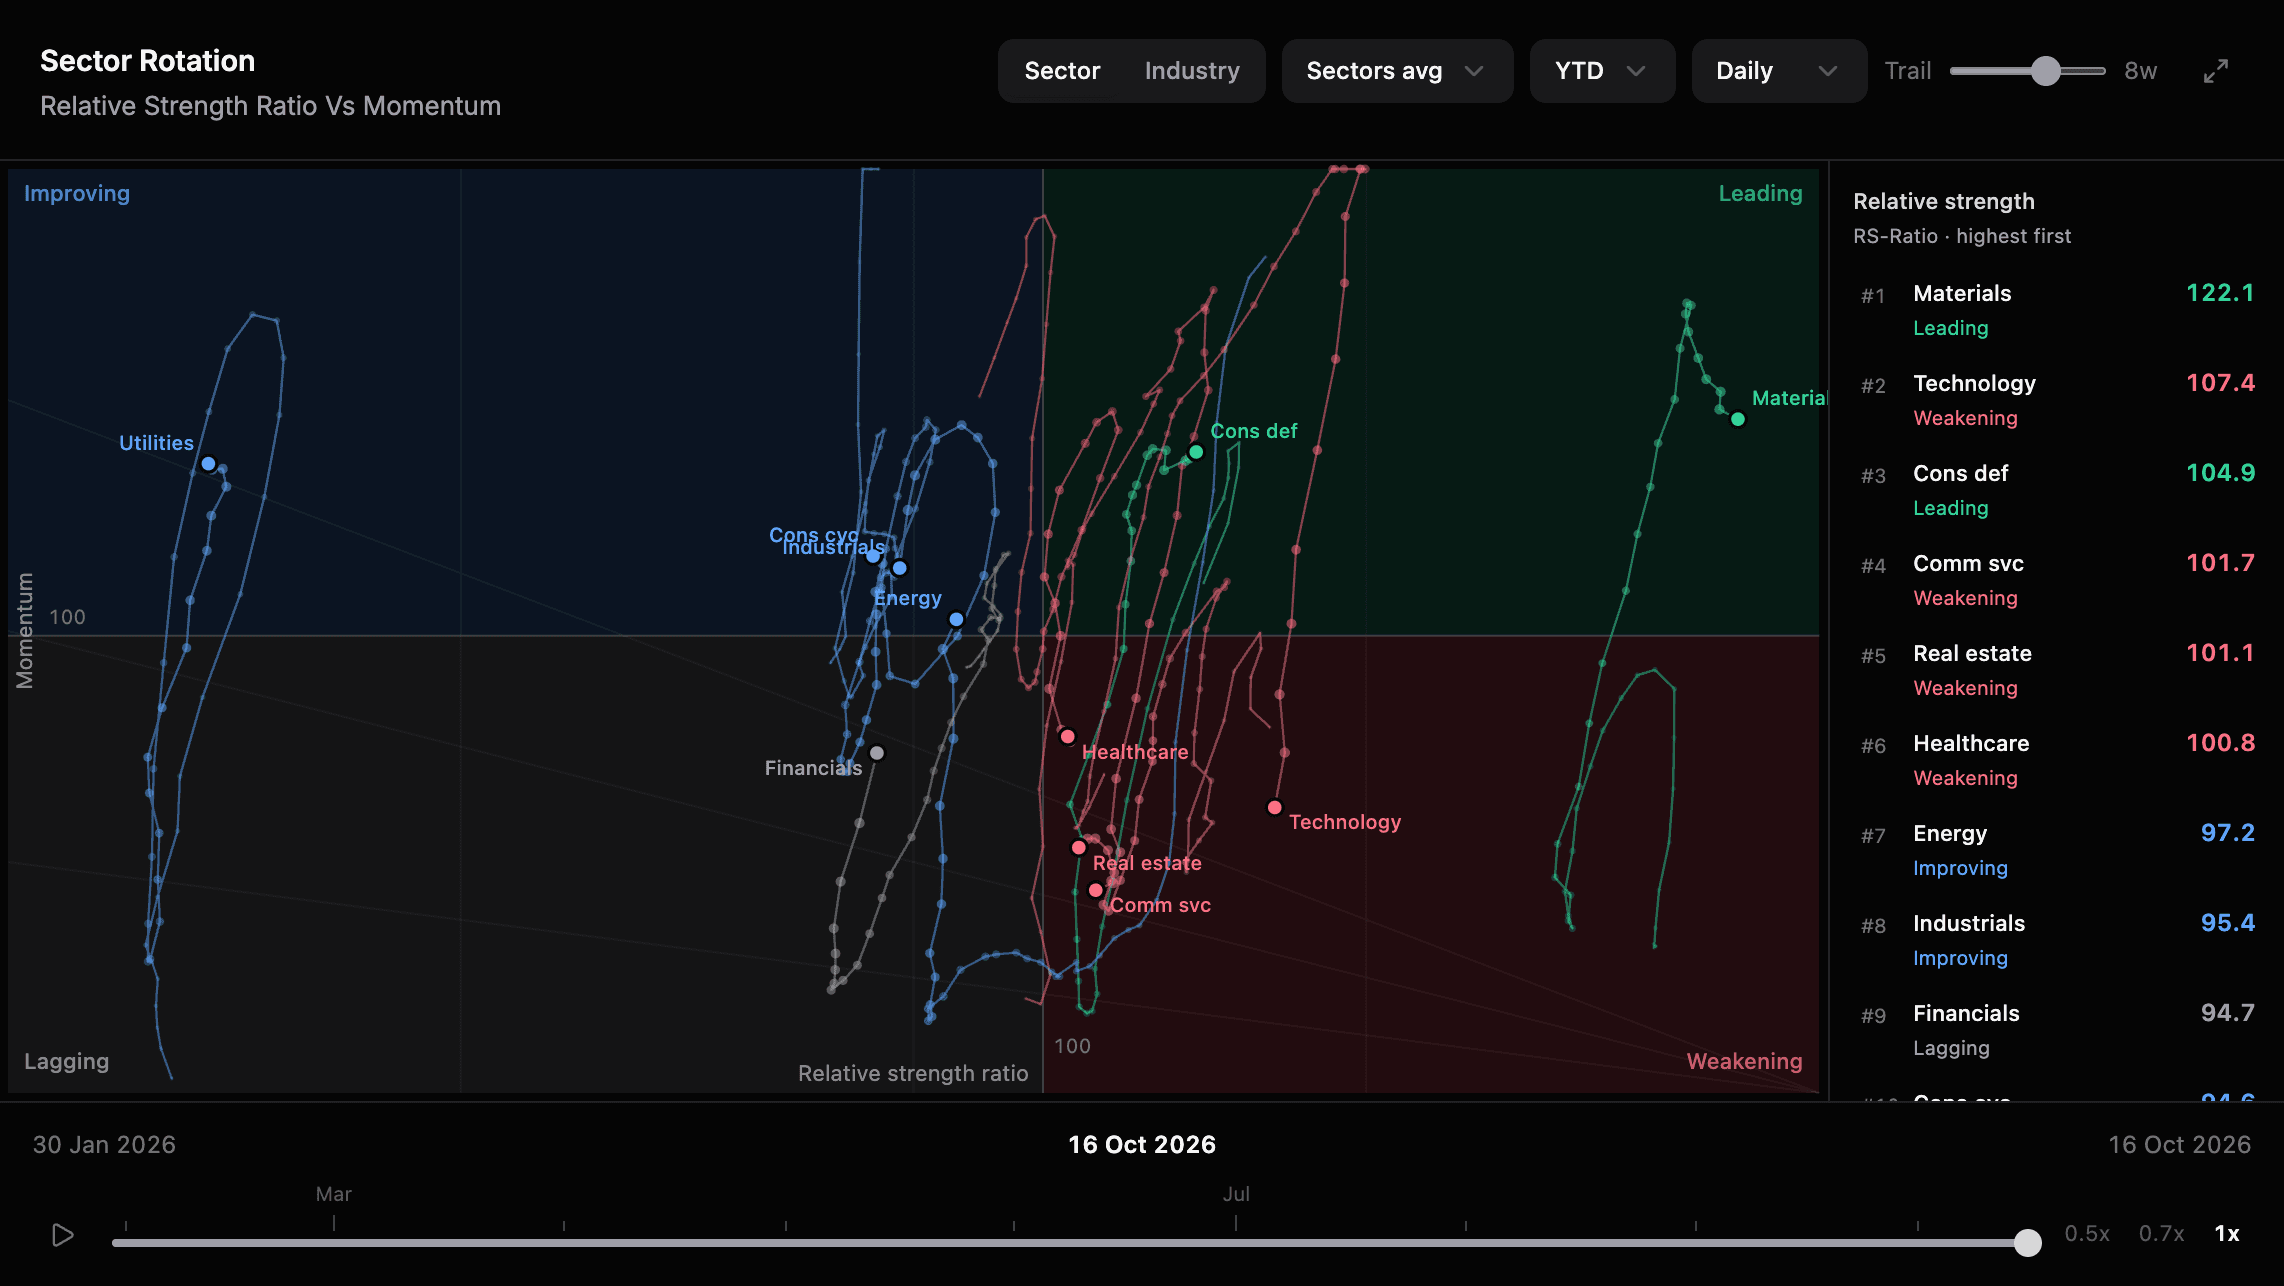
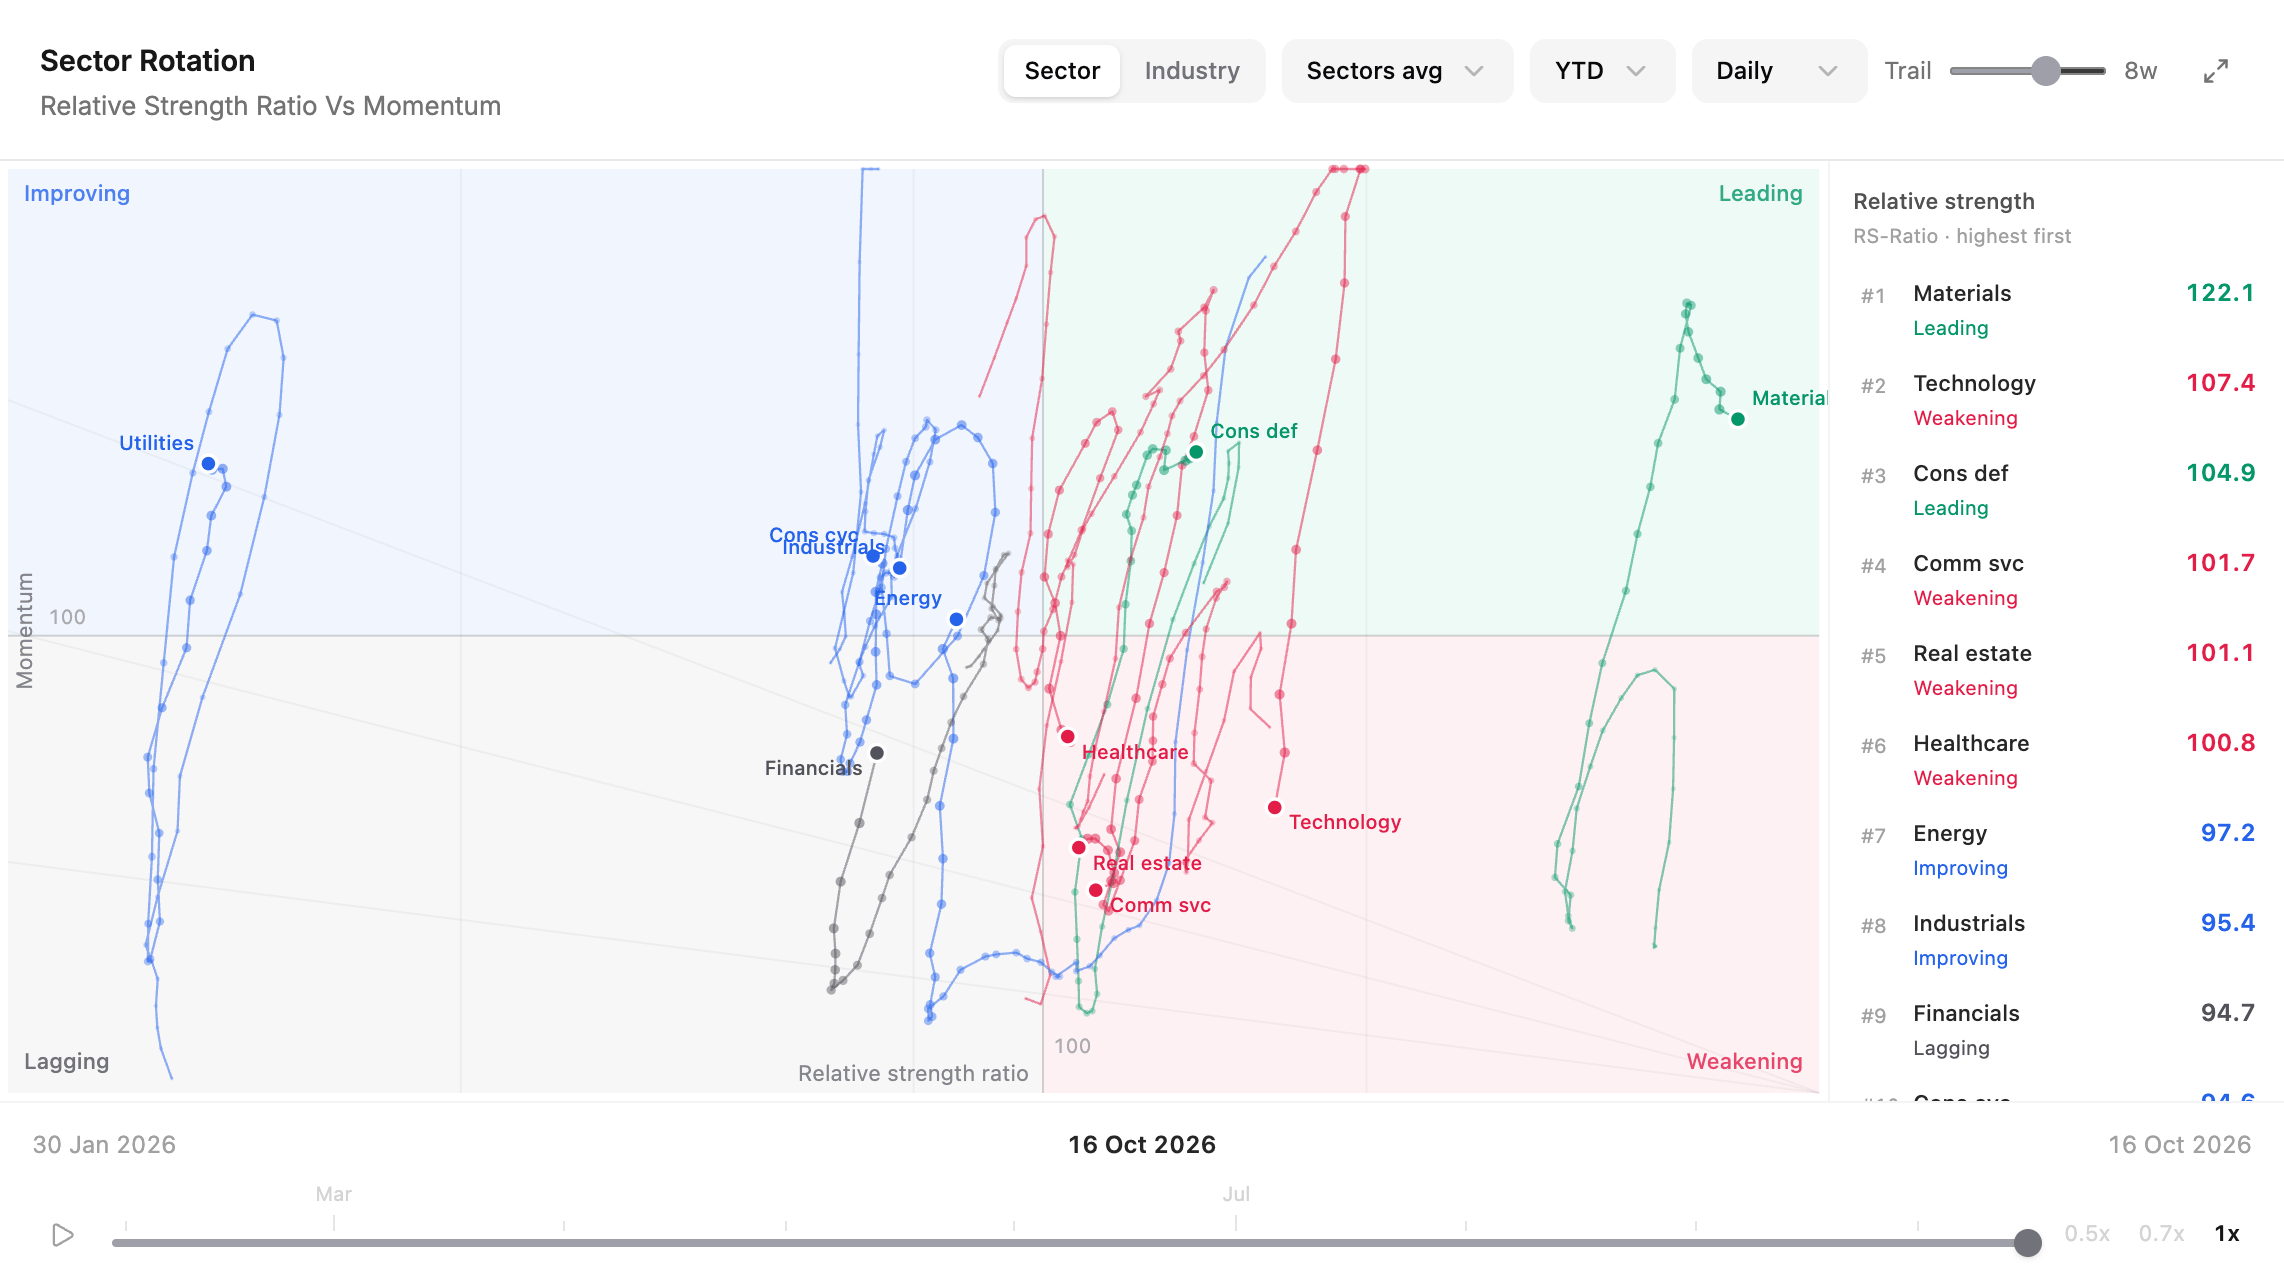
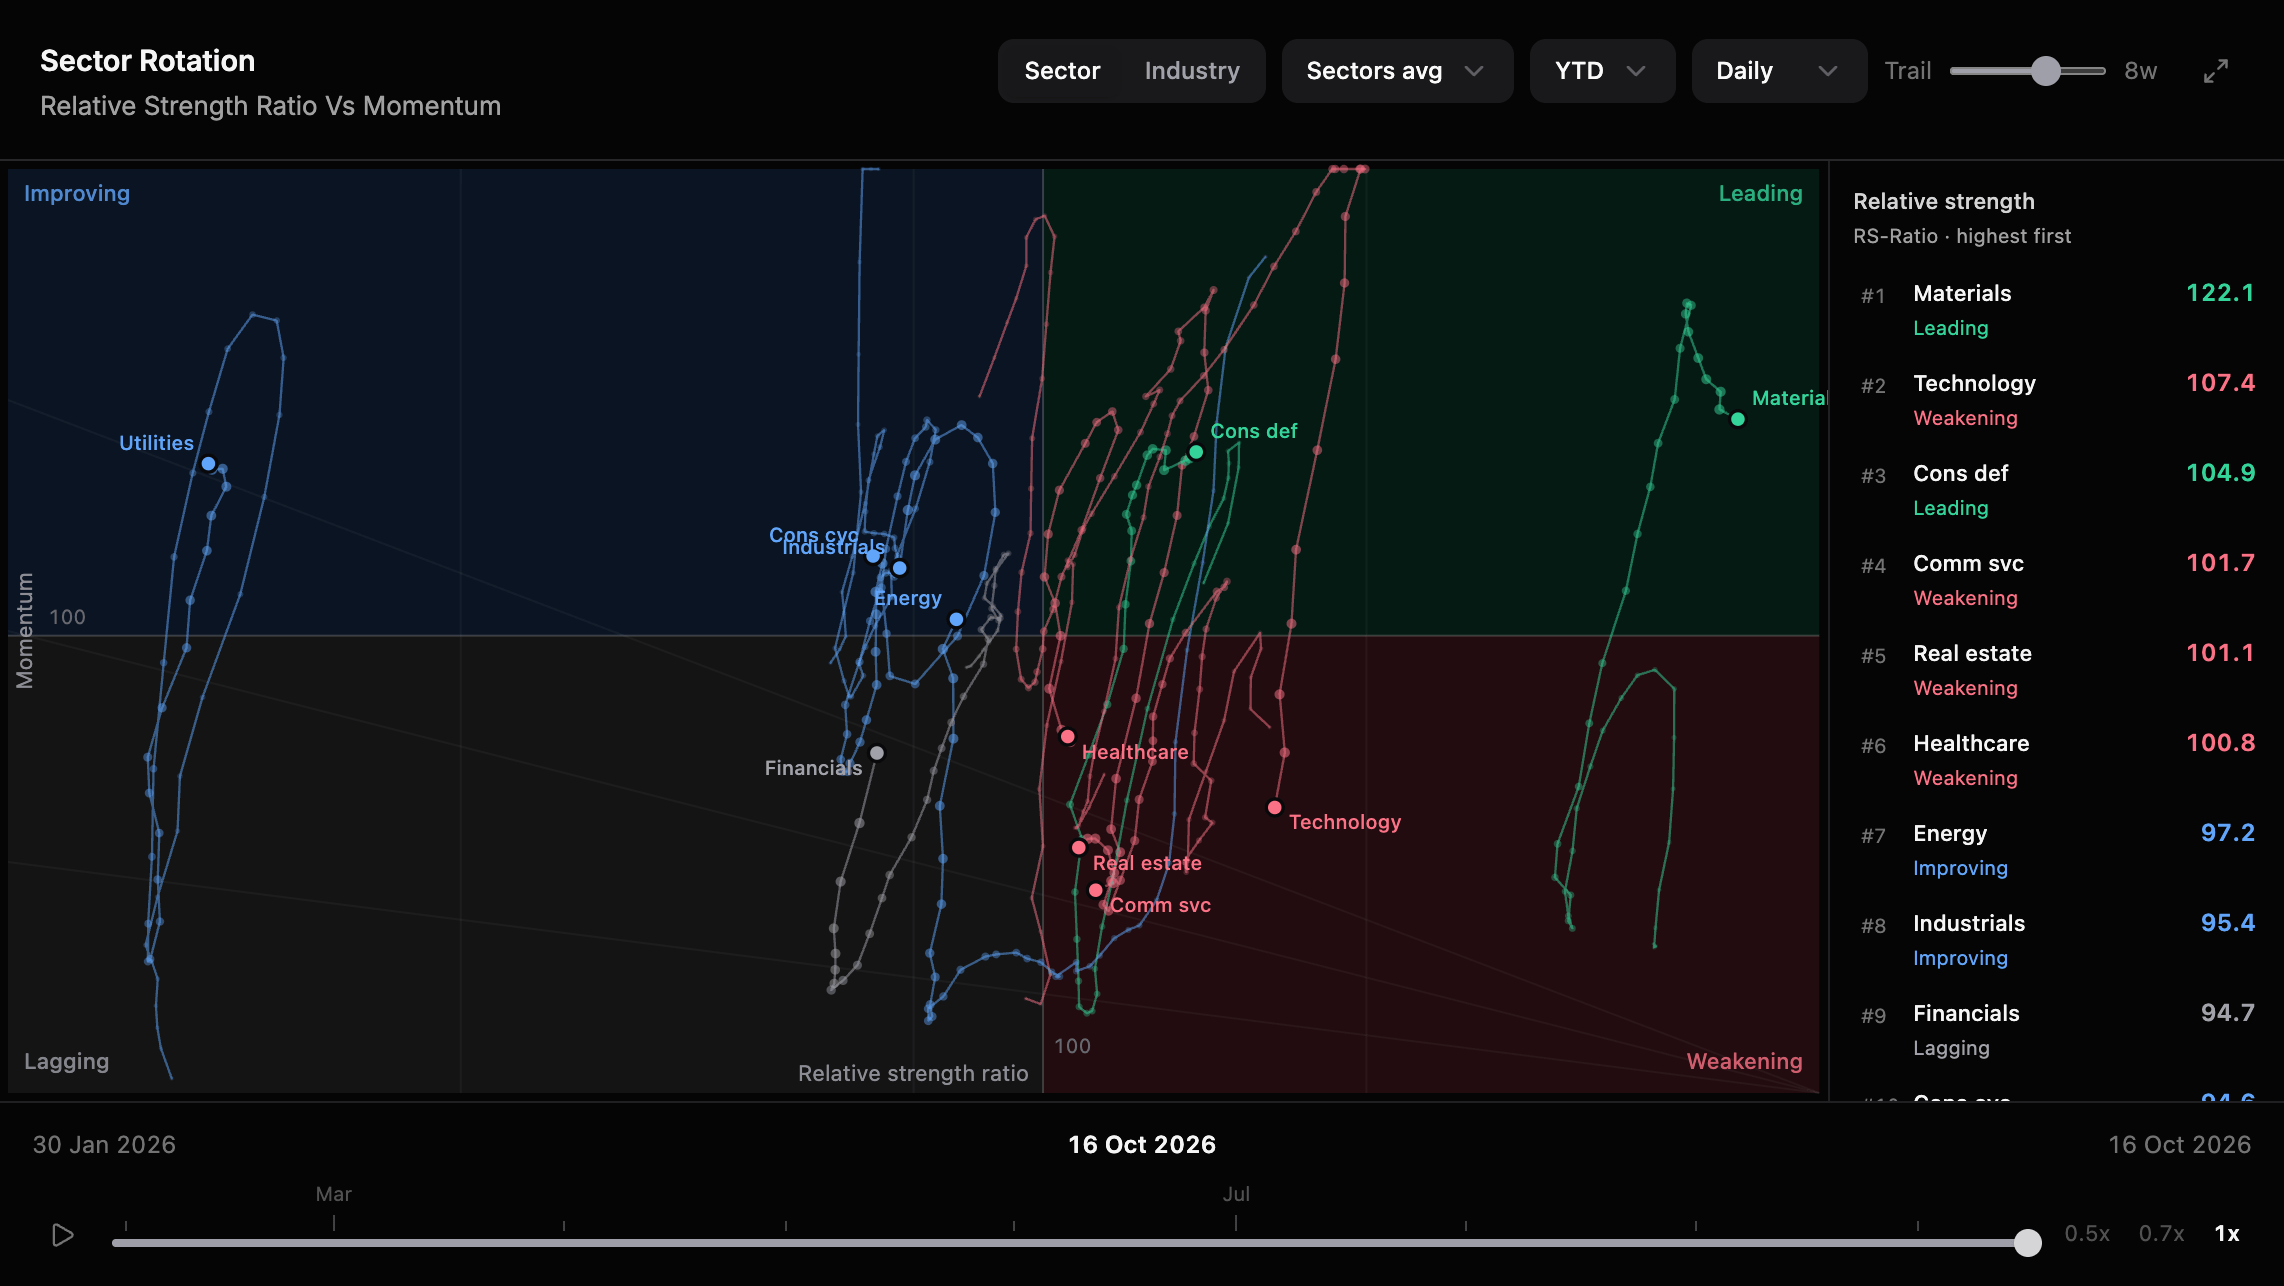
Global Rotation
See where capital is moving across sectors and industries in 14 markets, from relative rotation to valuation versus momentum.
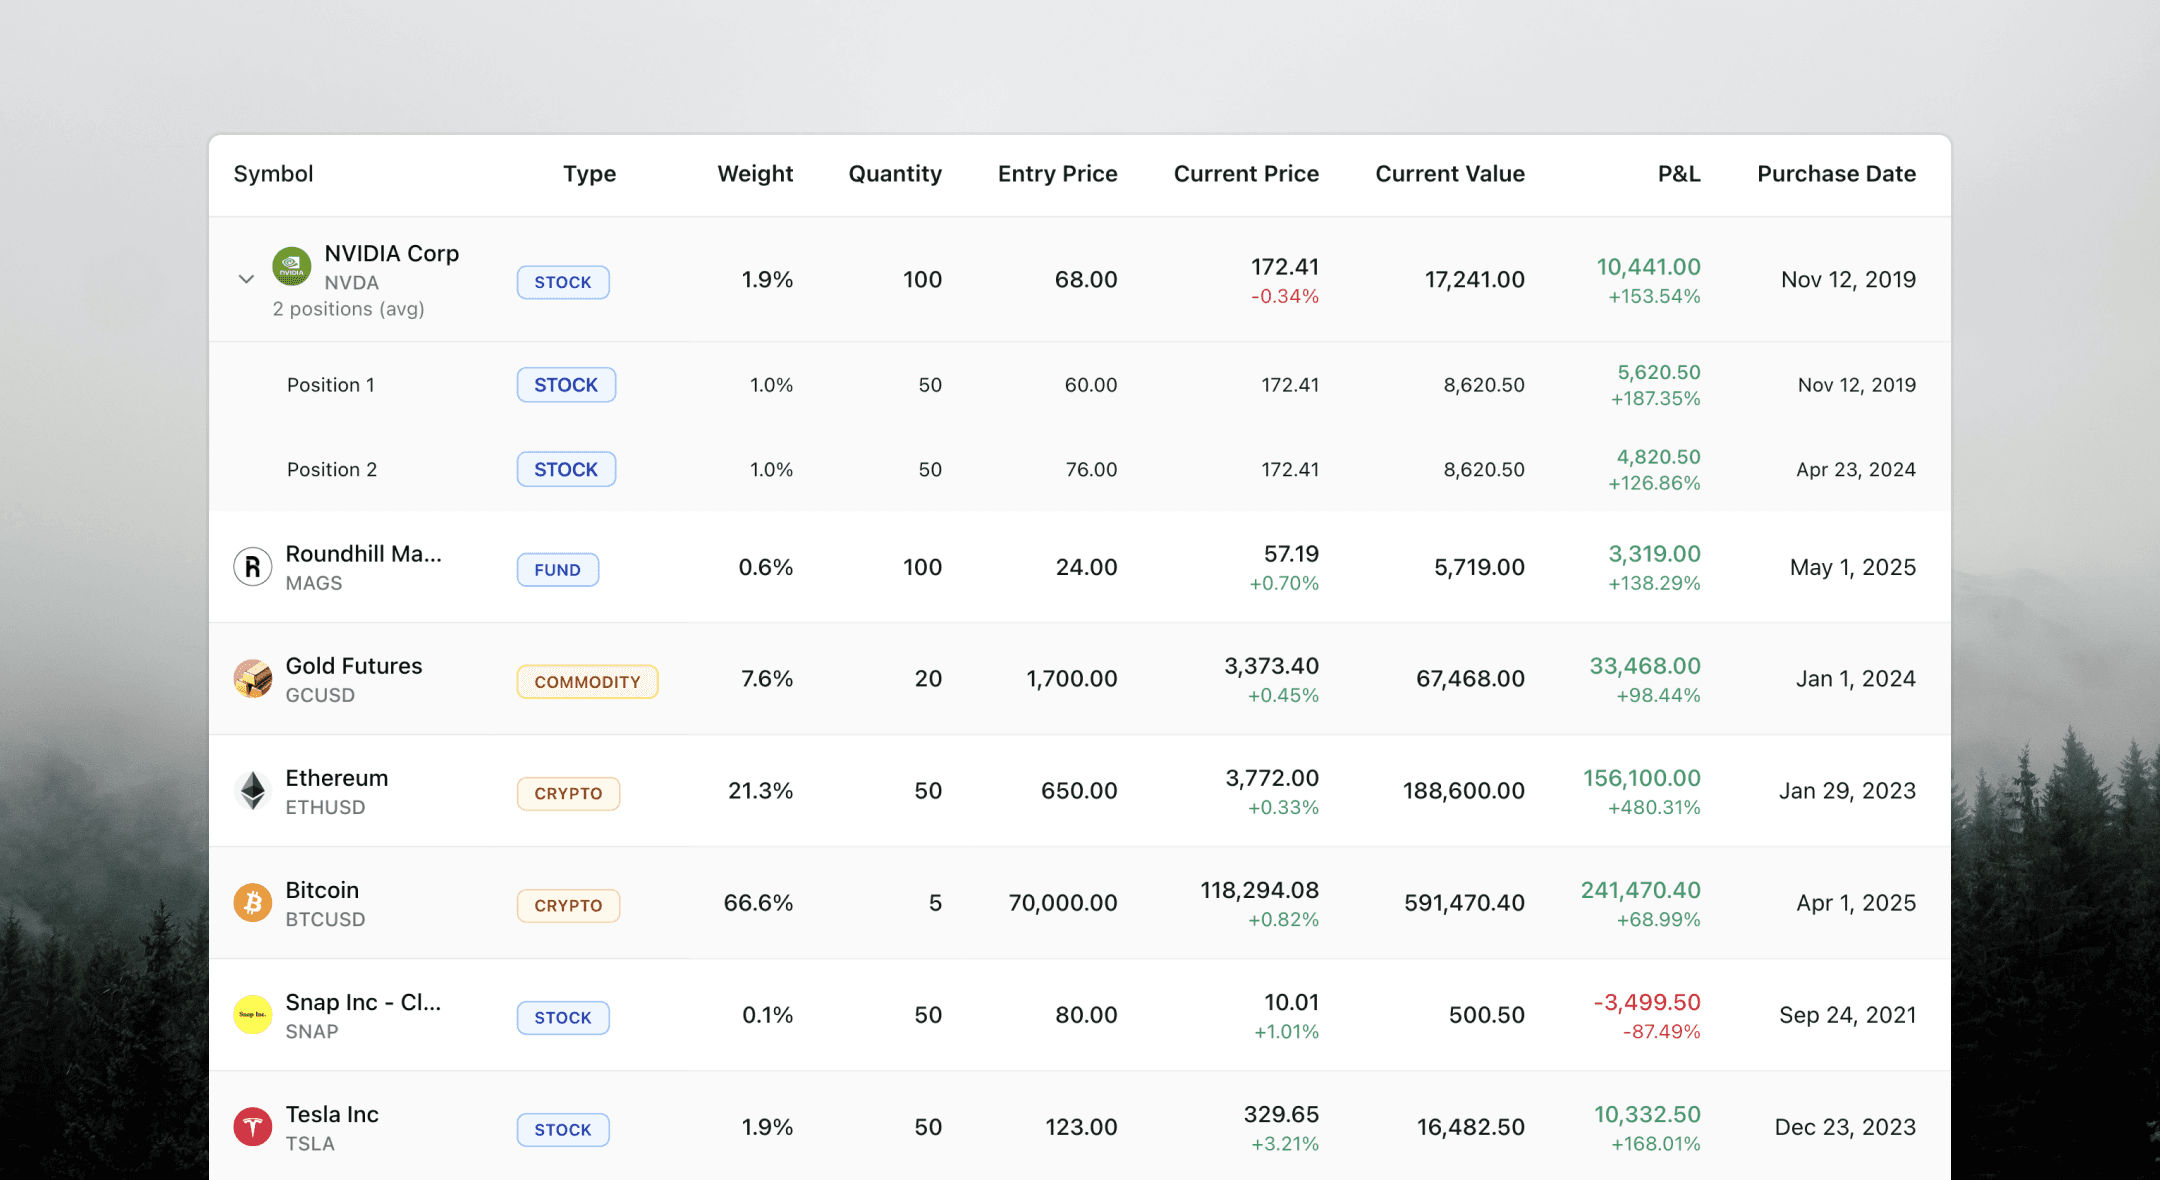
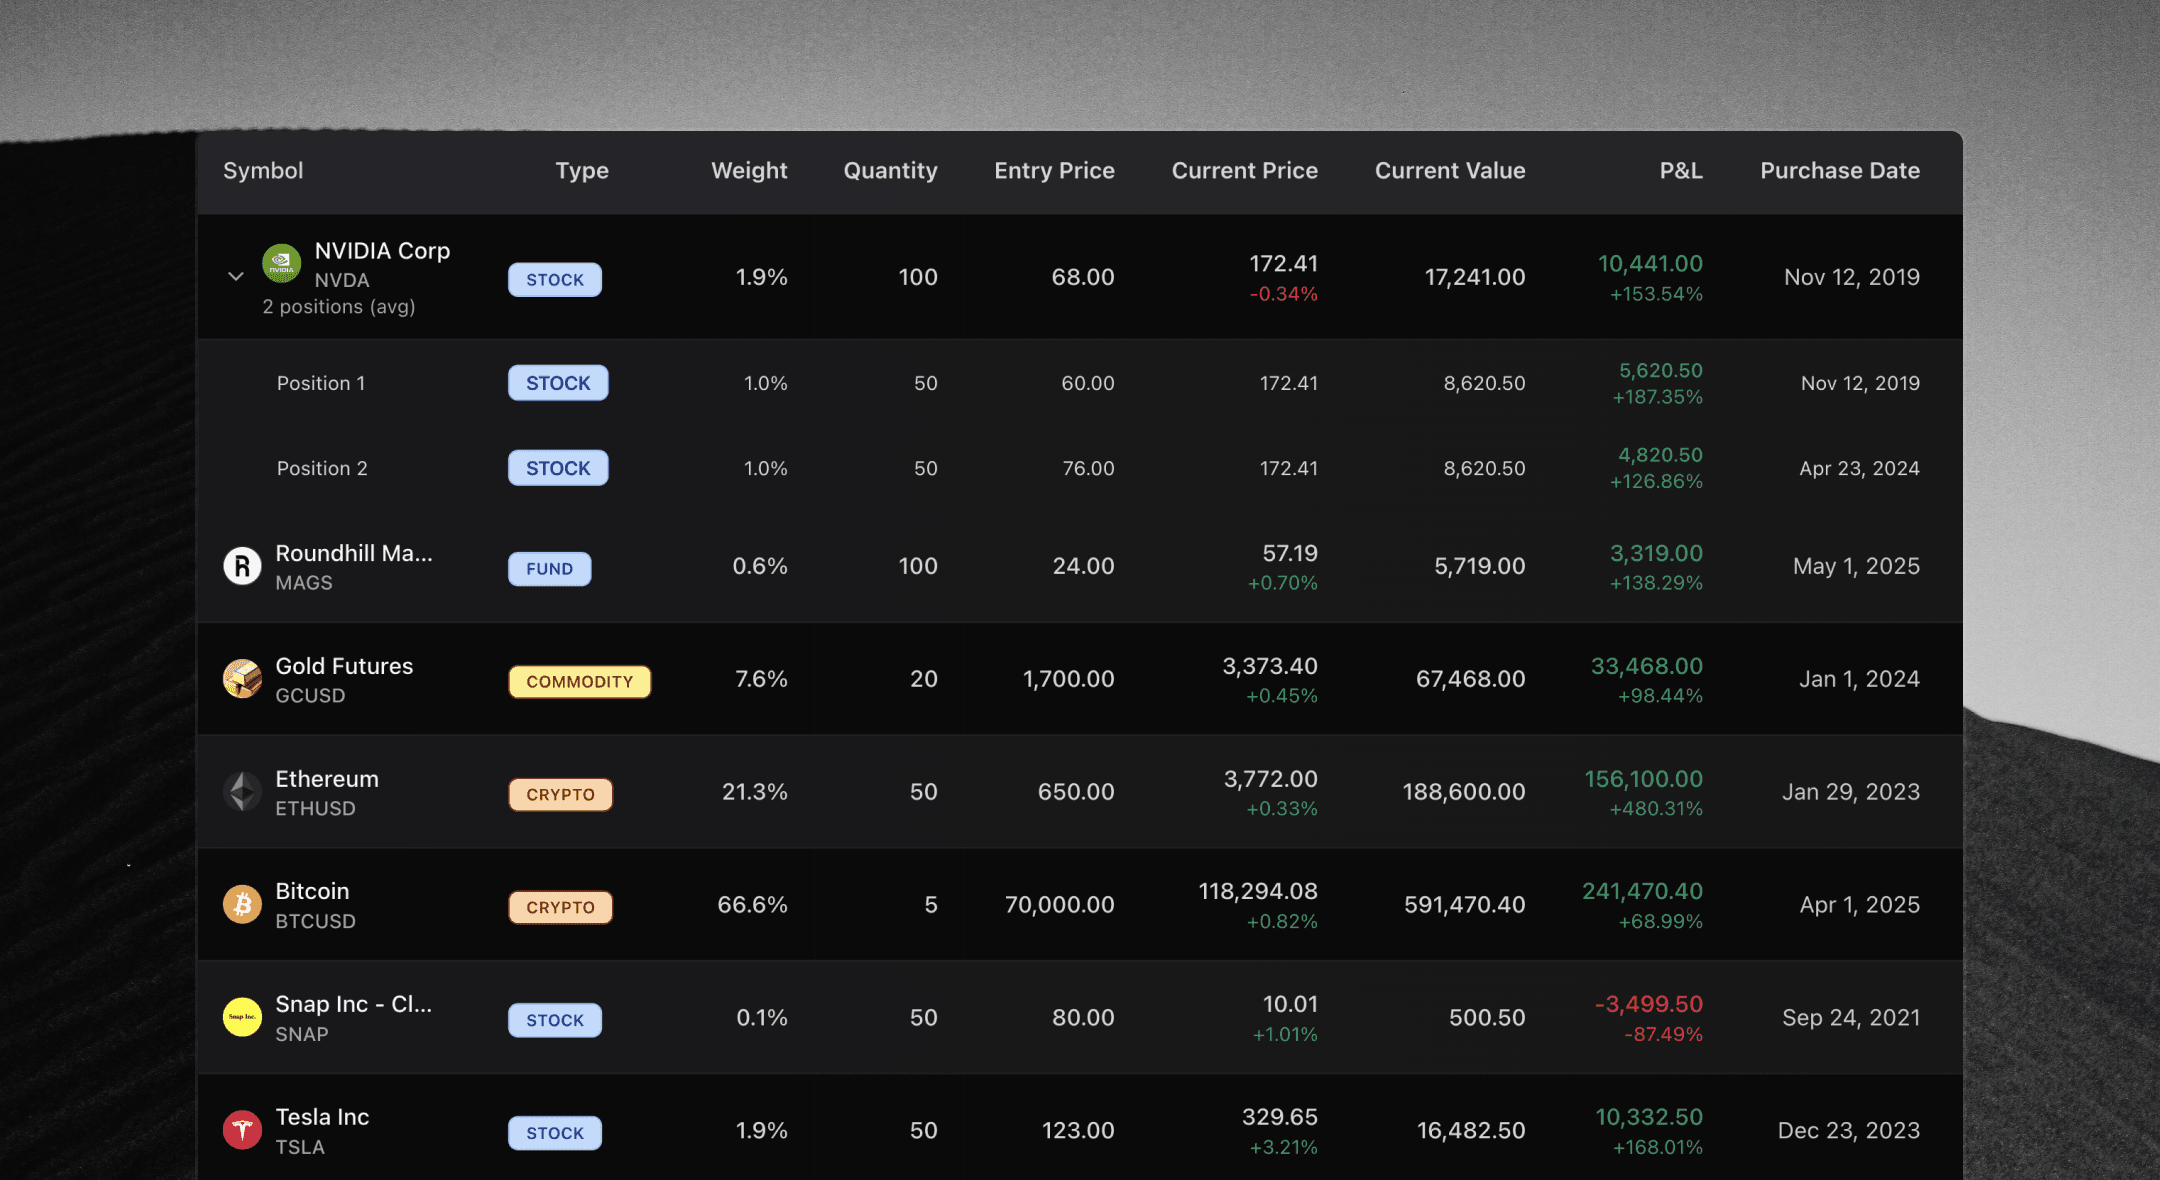
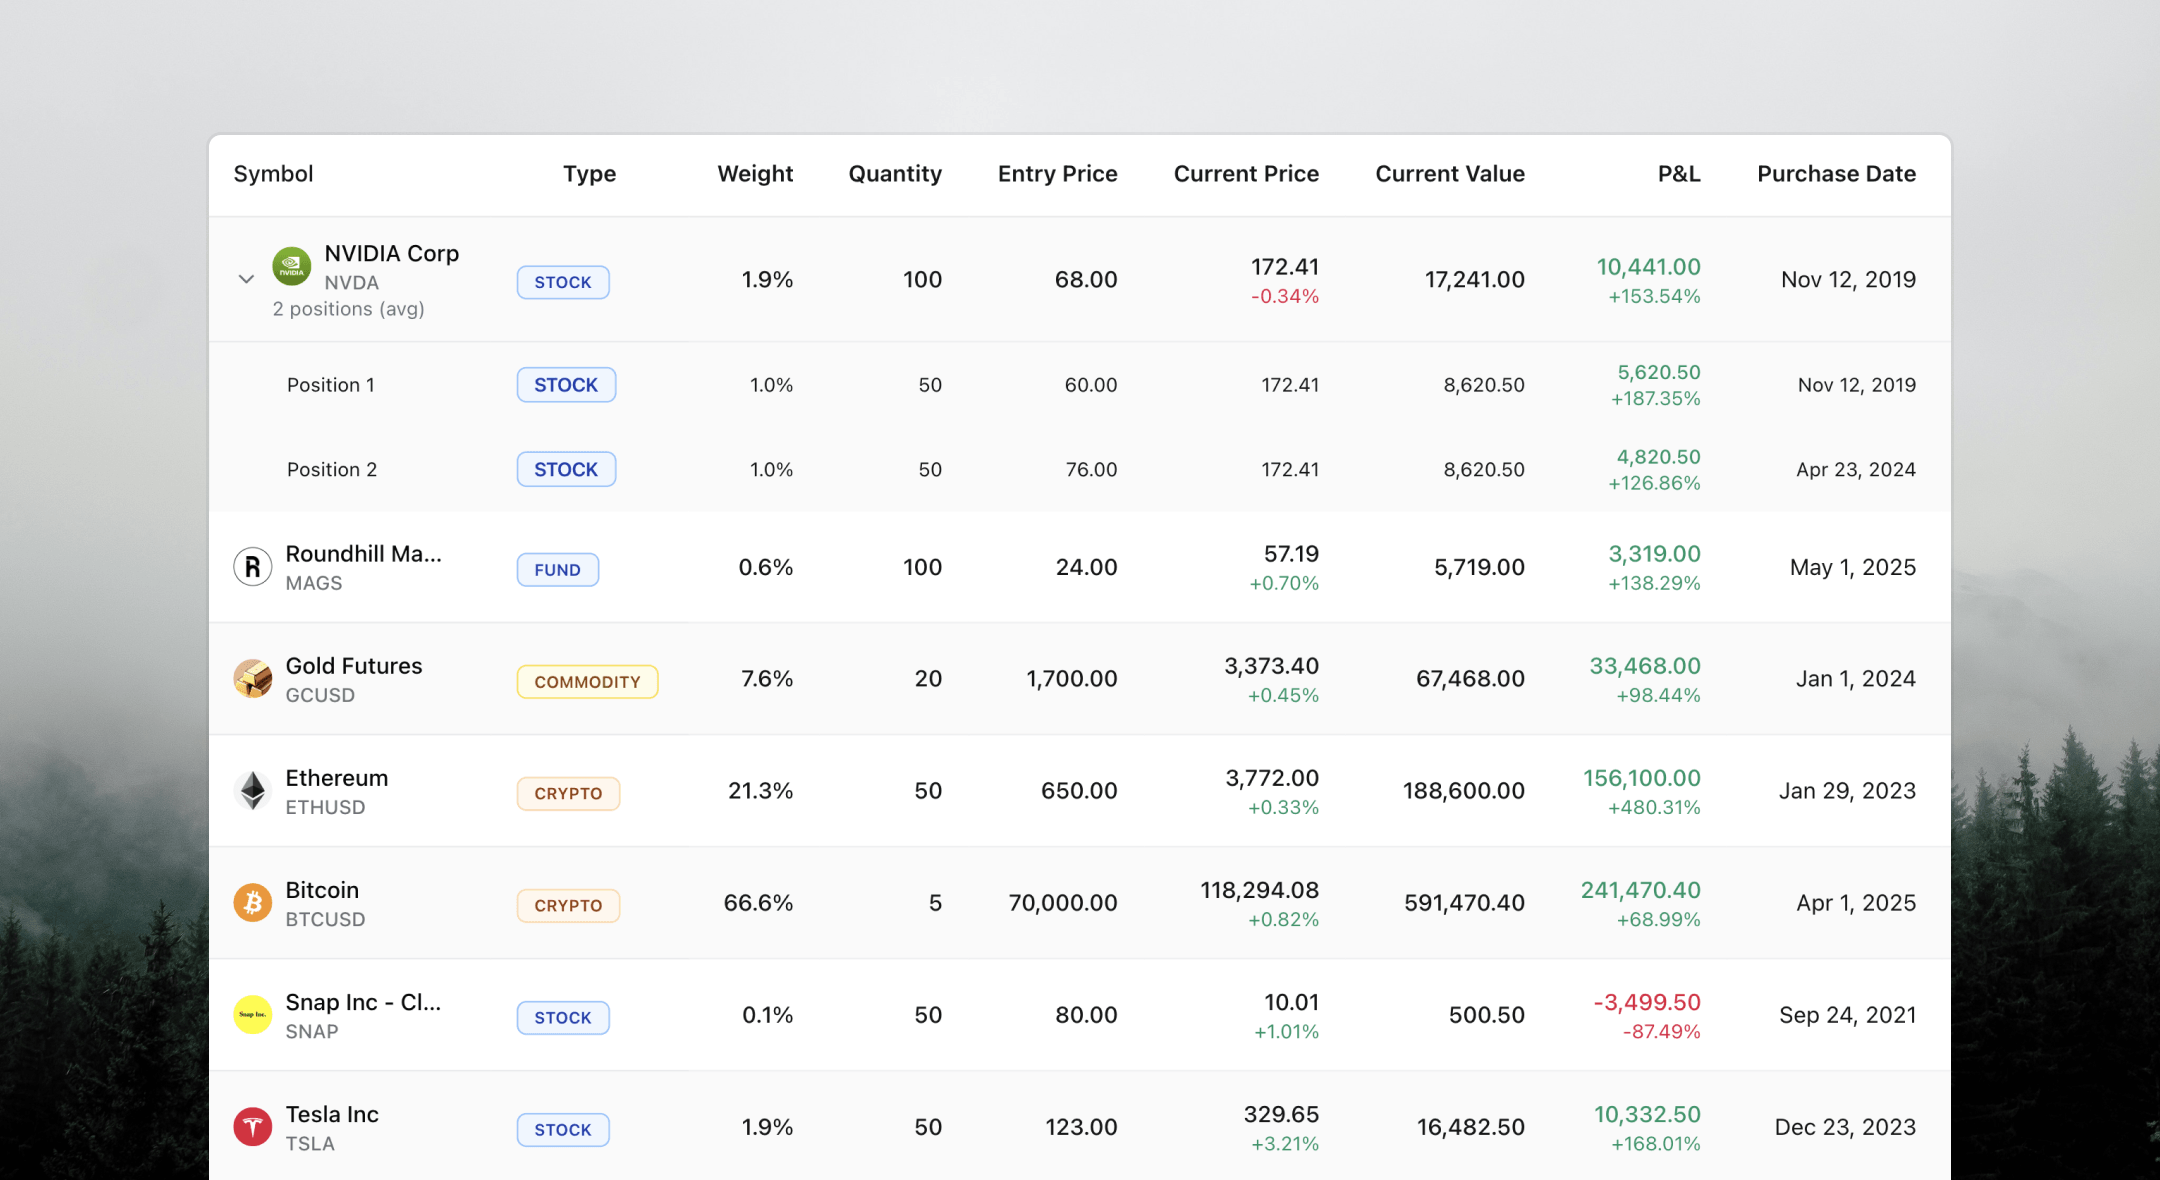
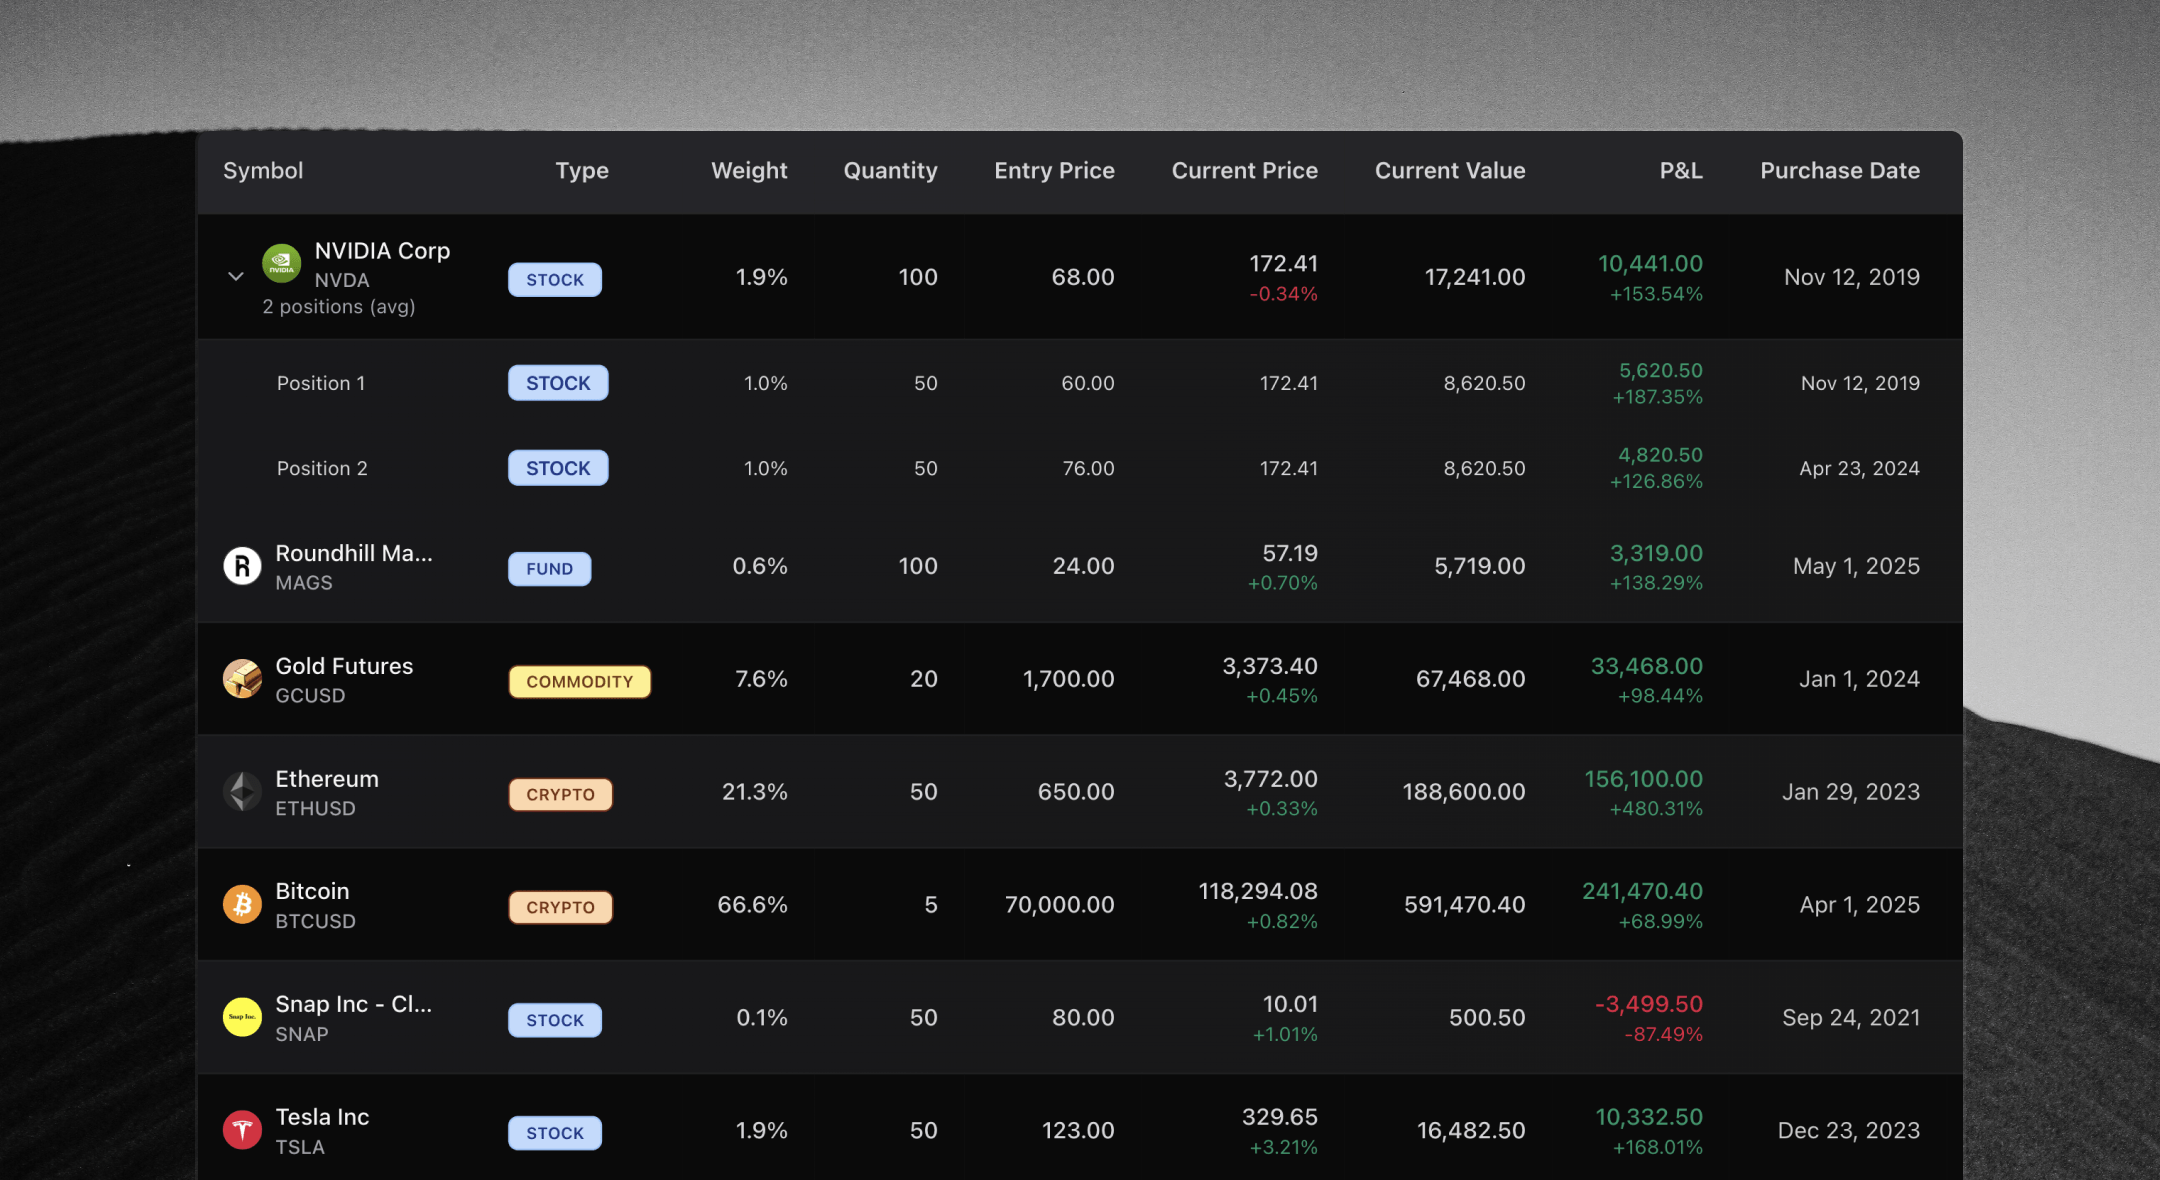
Portfolio Visualizer
Track stocks, crypto, ETFs and funds. Benchmark against global indices in one unified view.
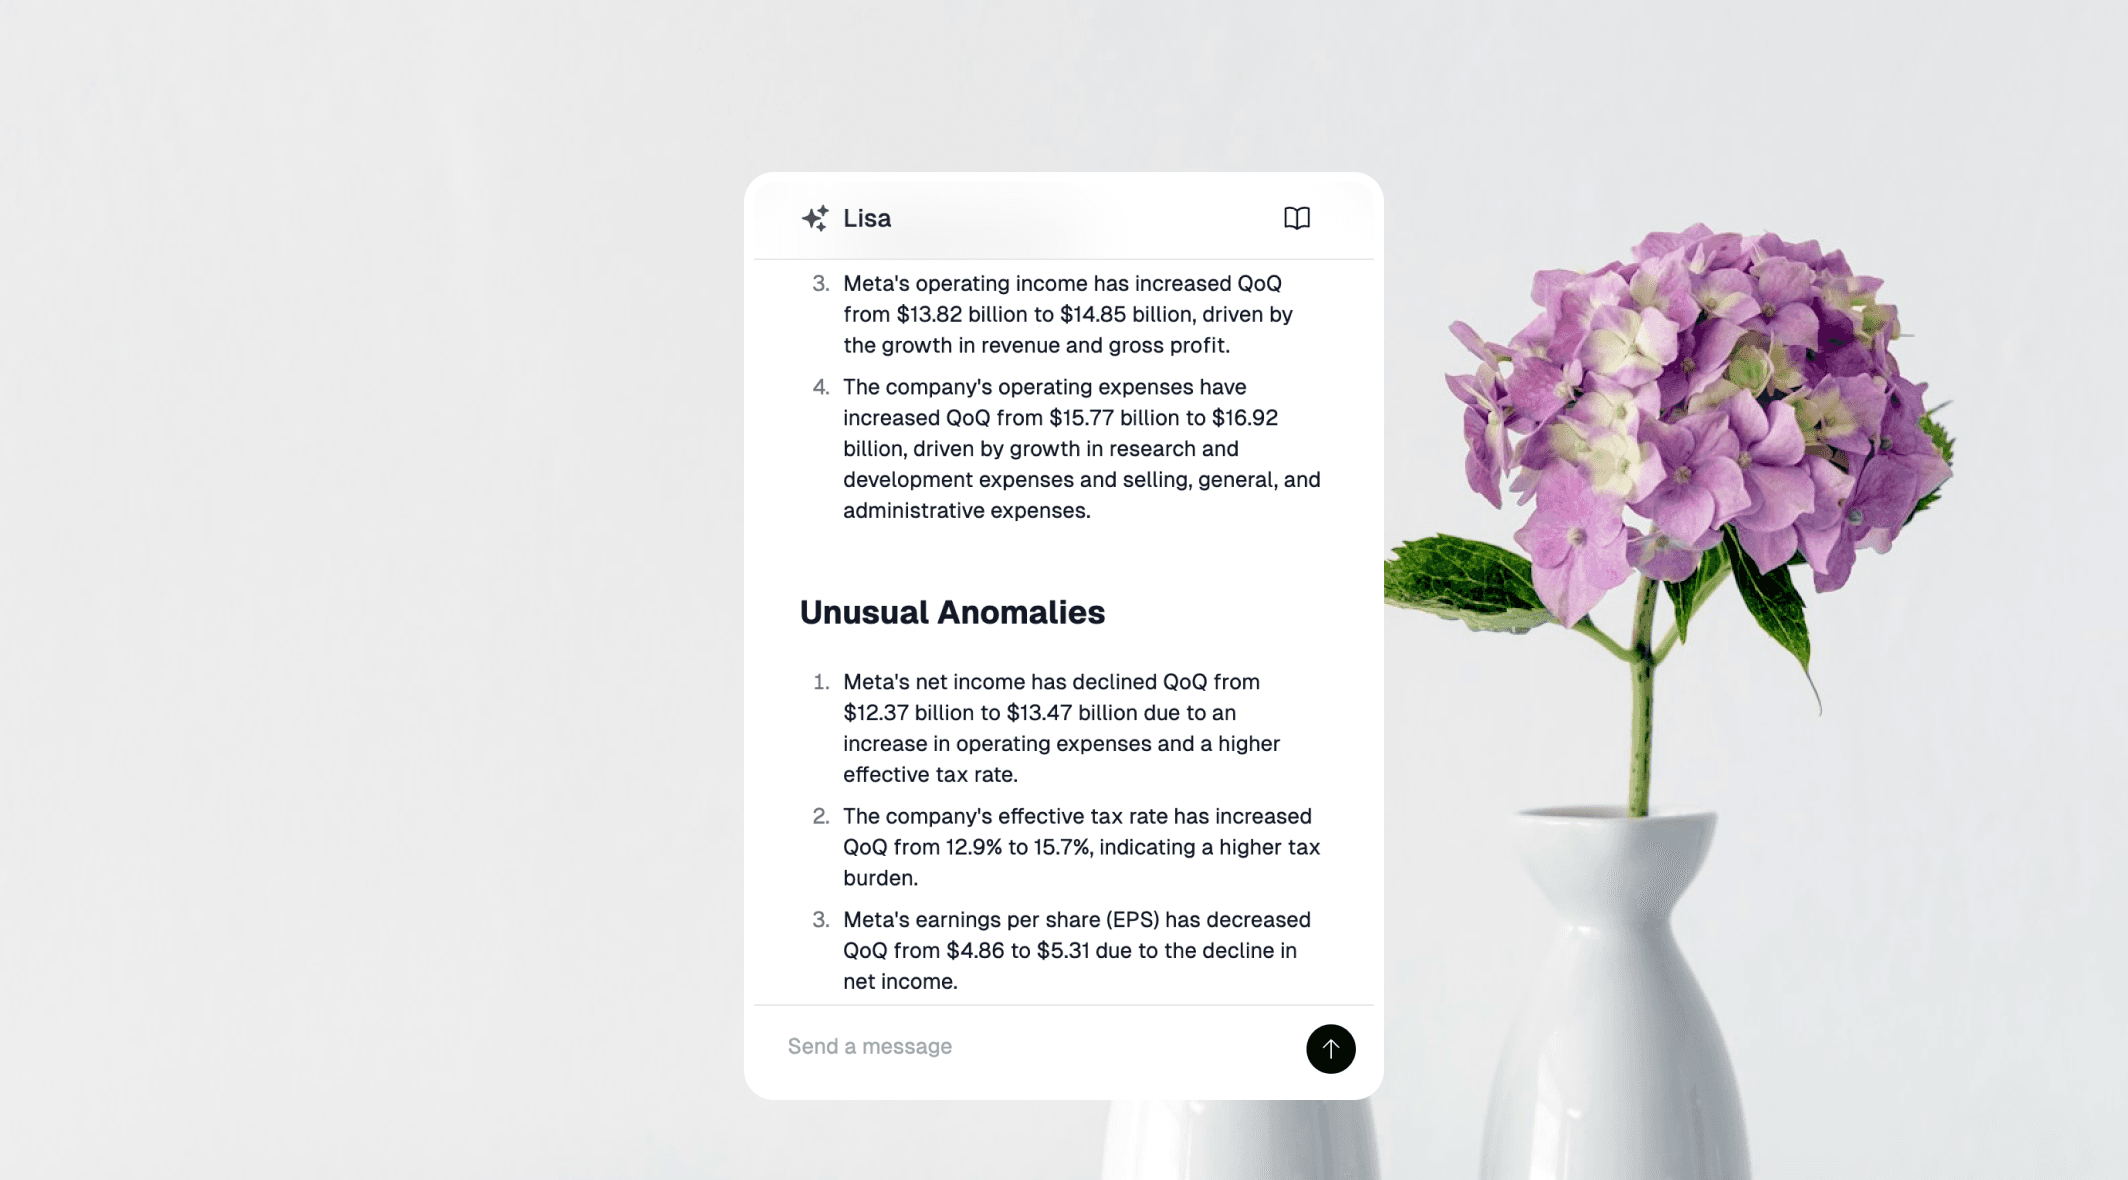
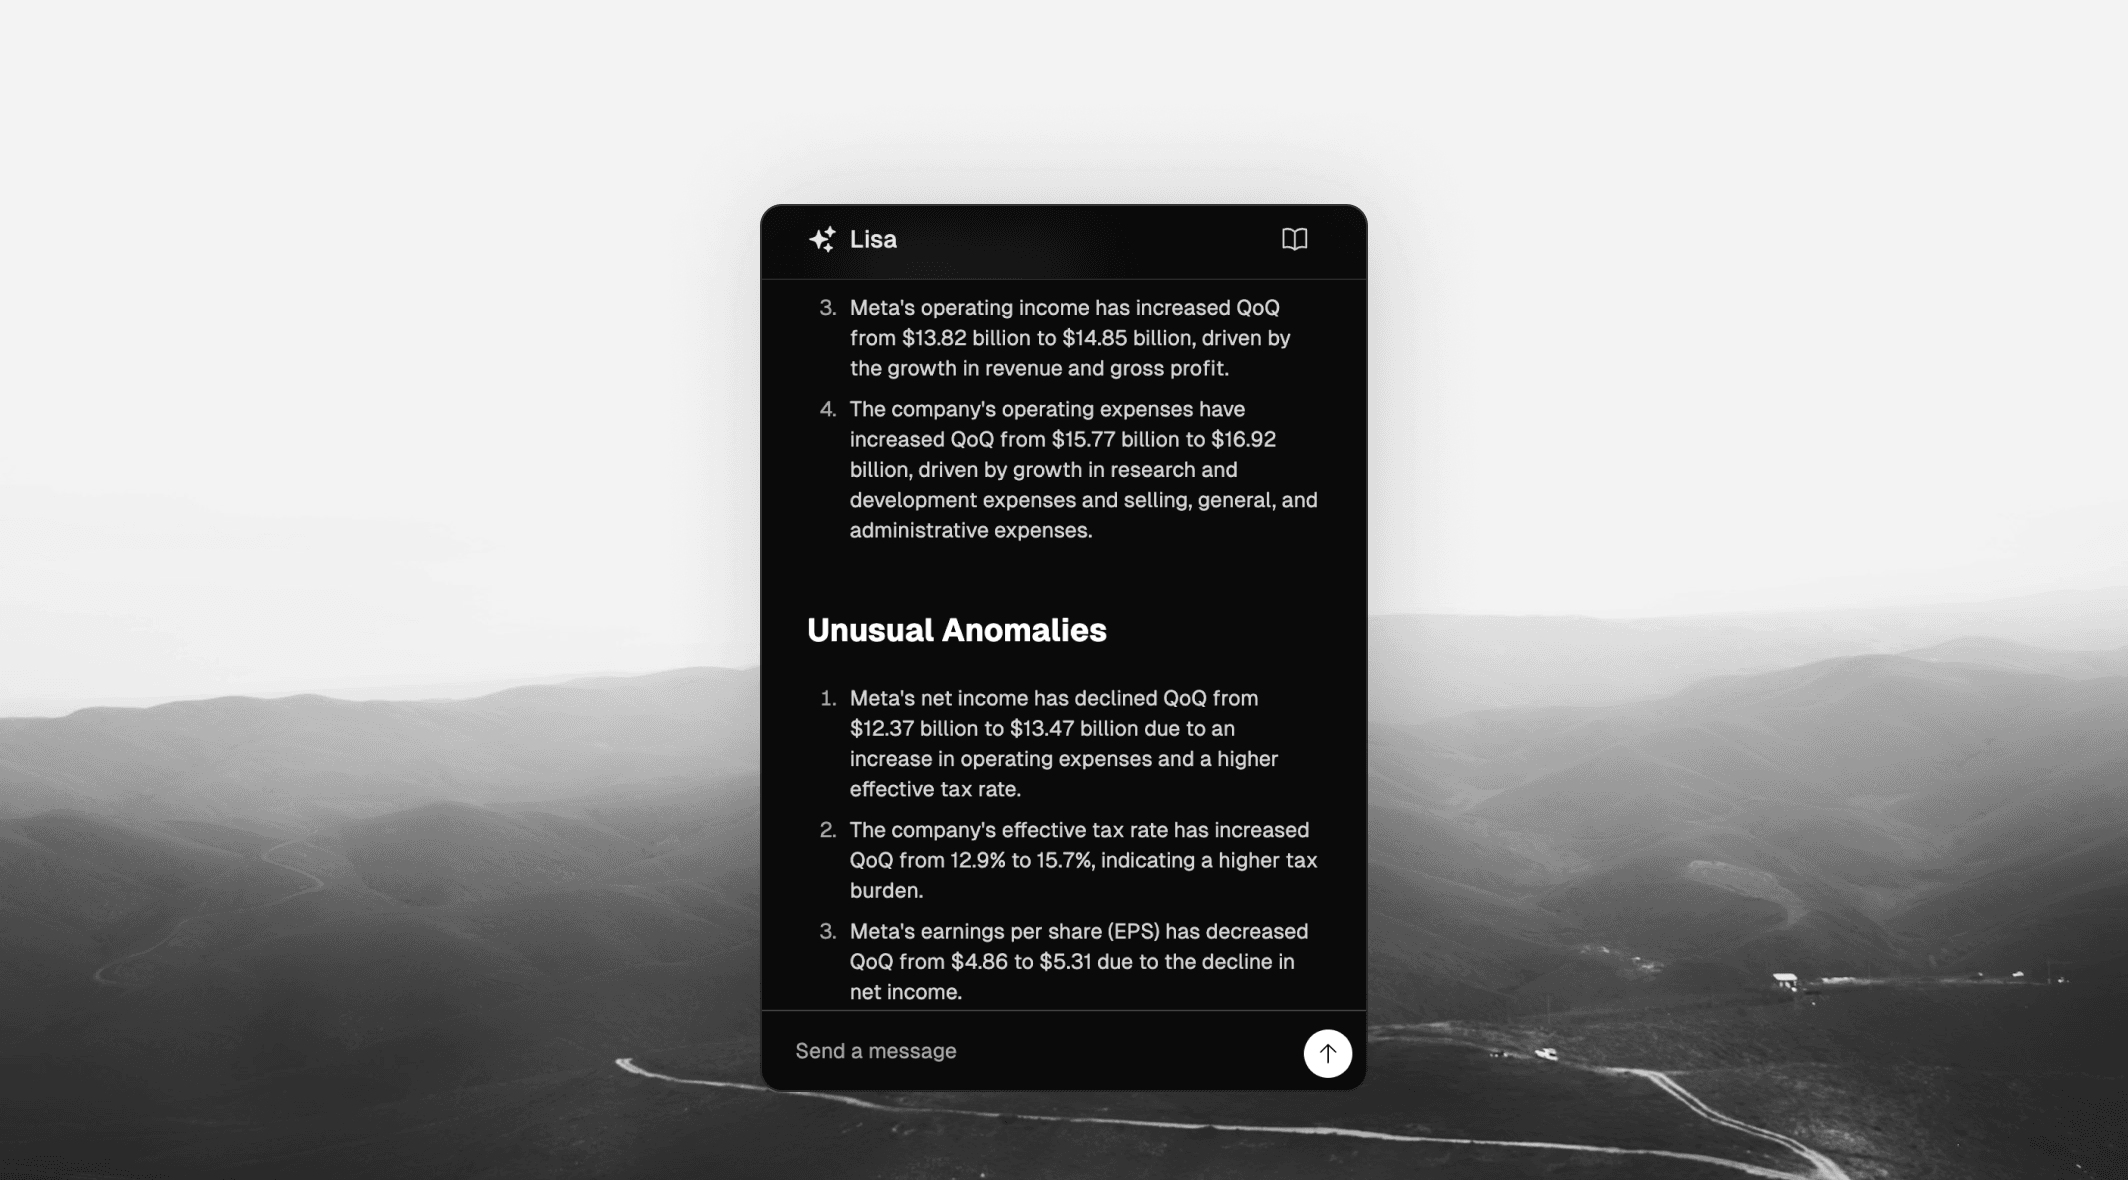
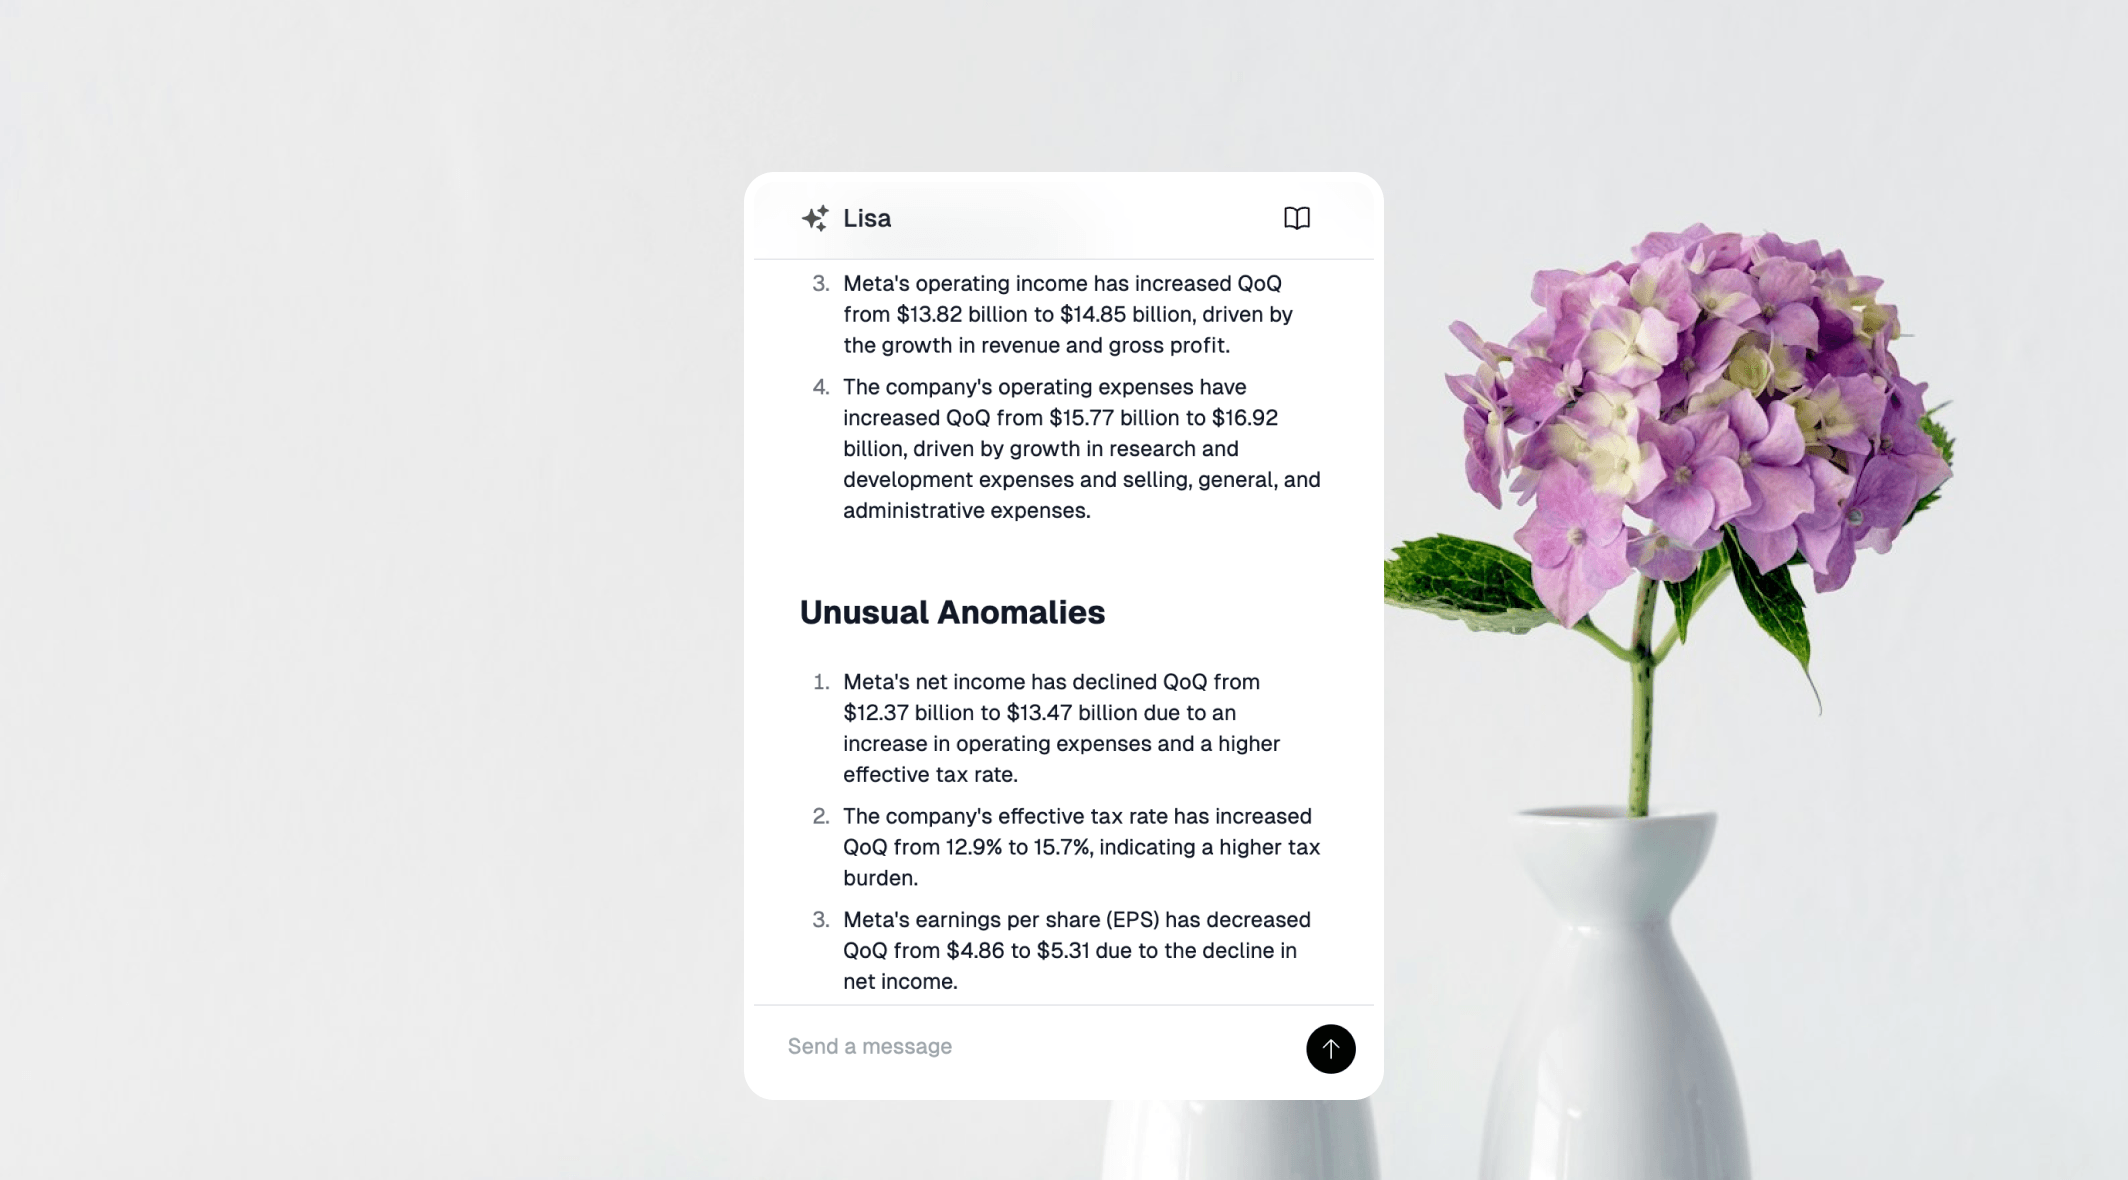
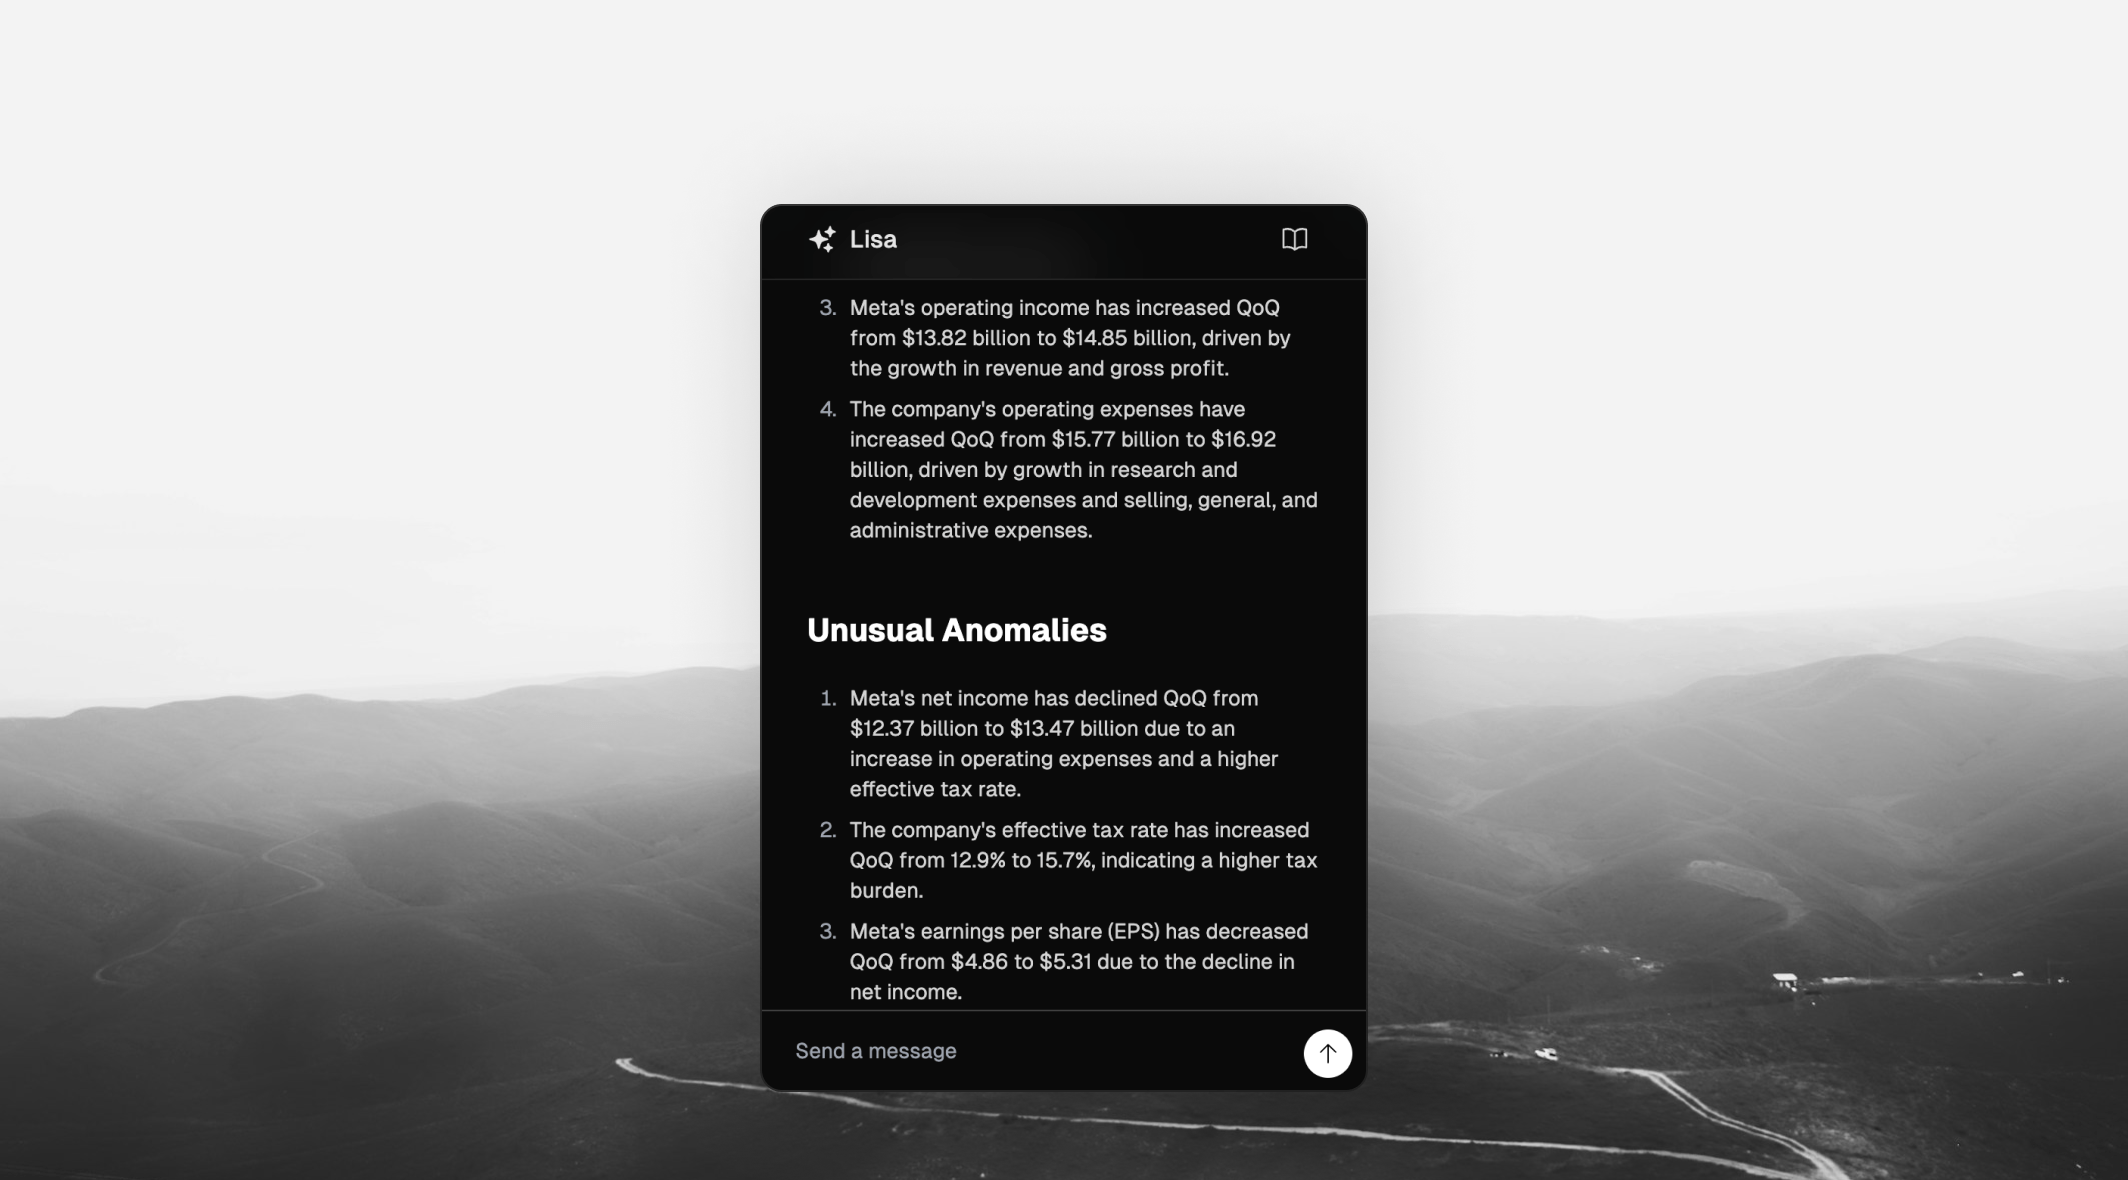
Lisa AI
Your AI analyst, native across the platform — from screening to deep-dive research.
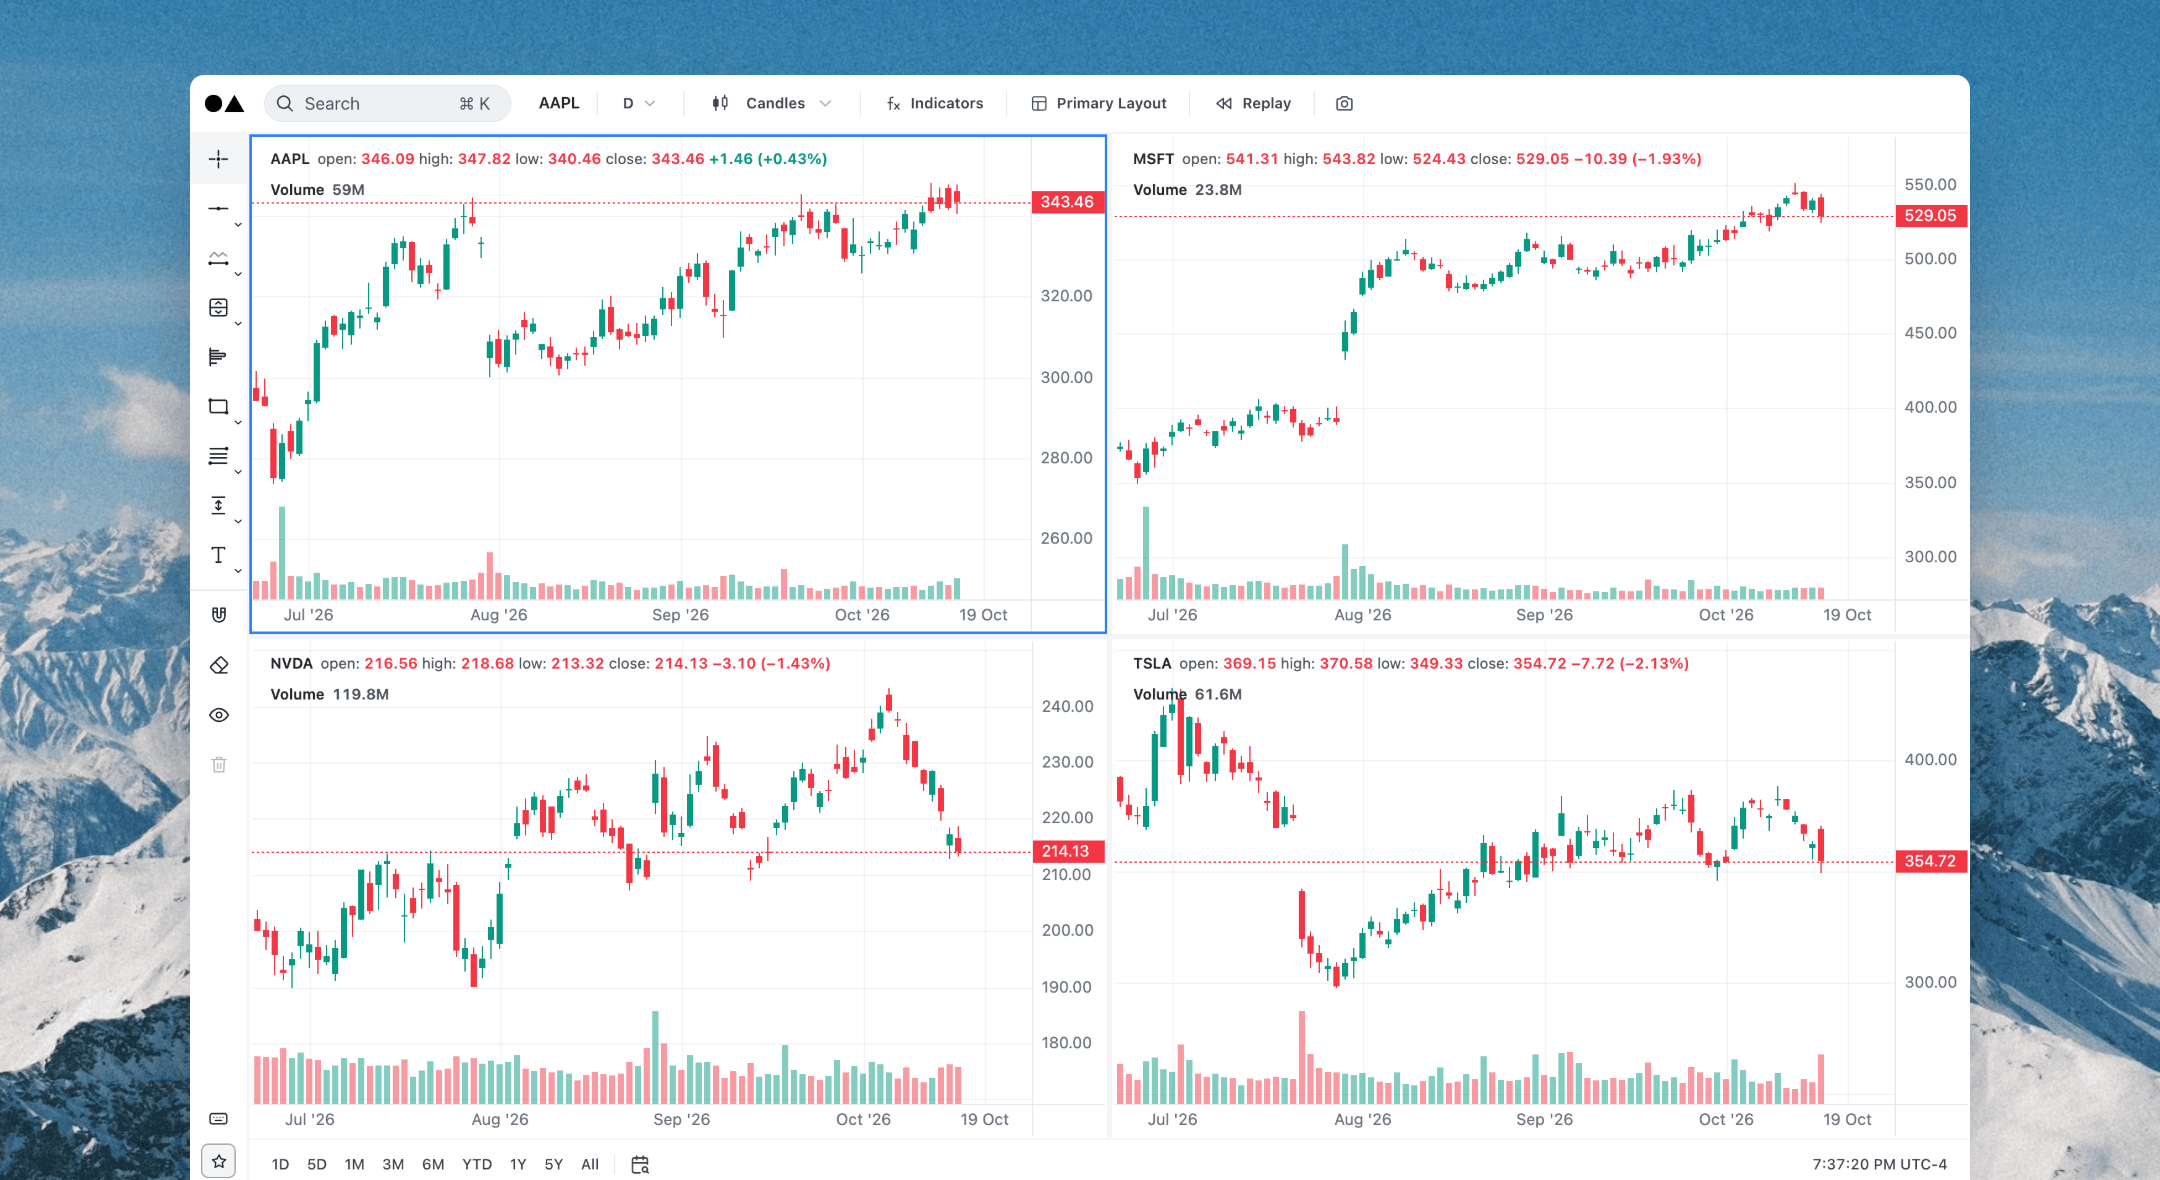
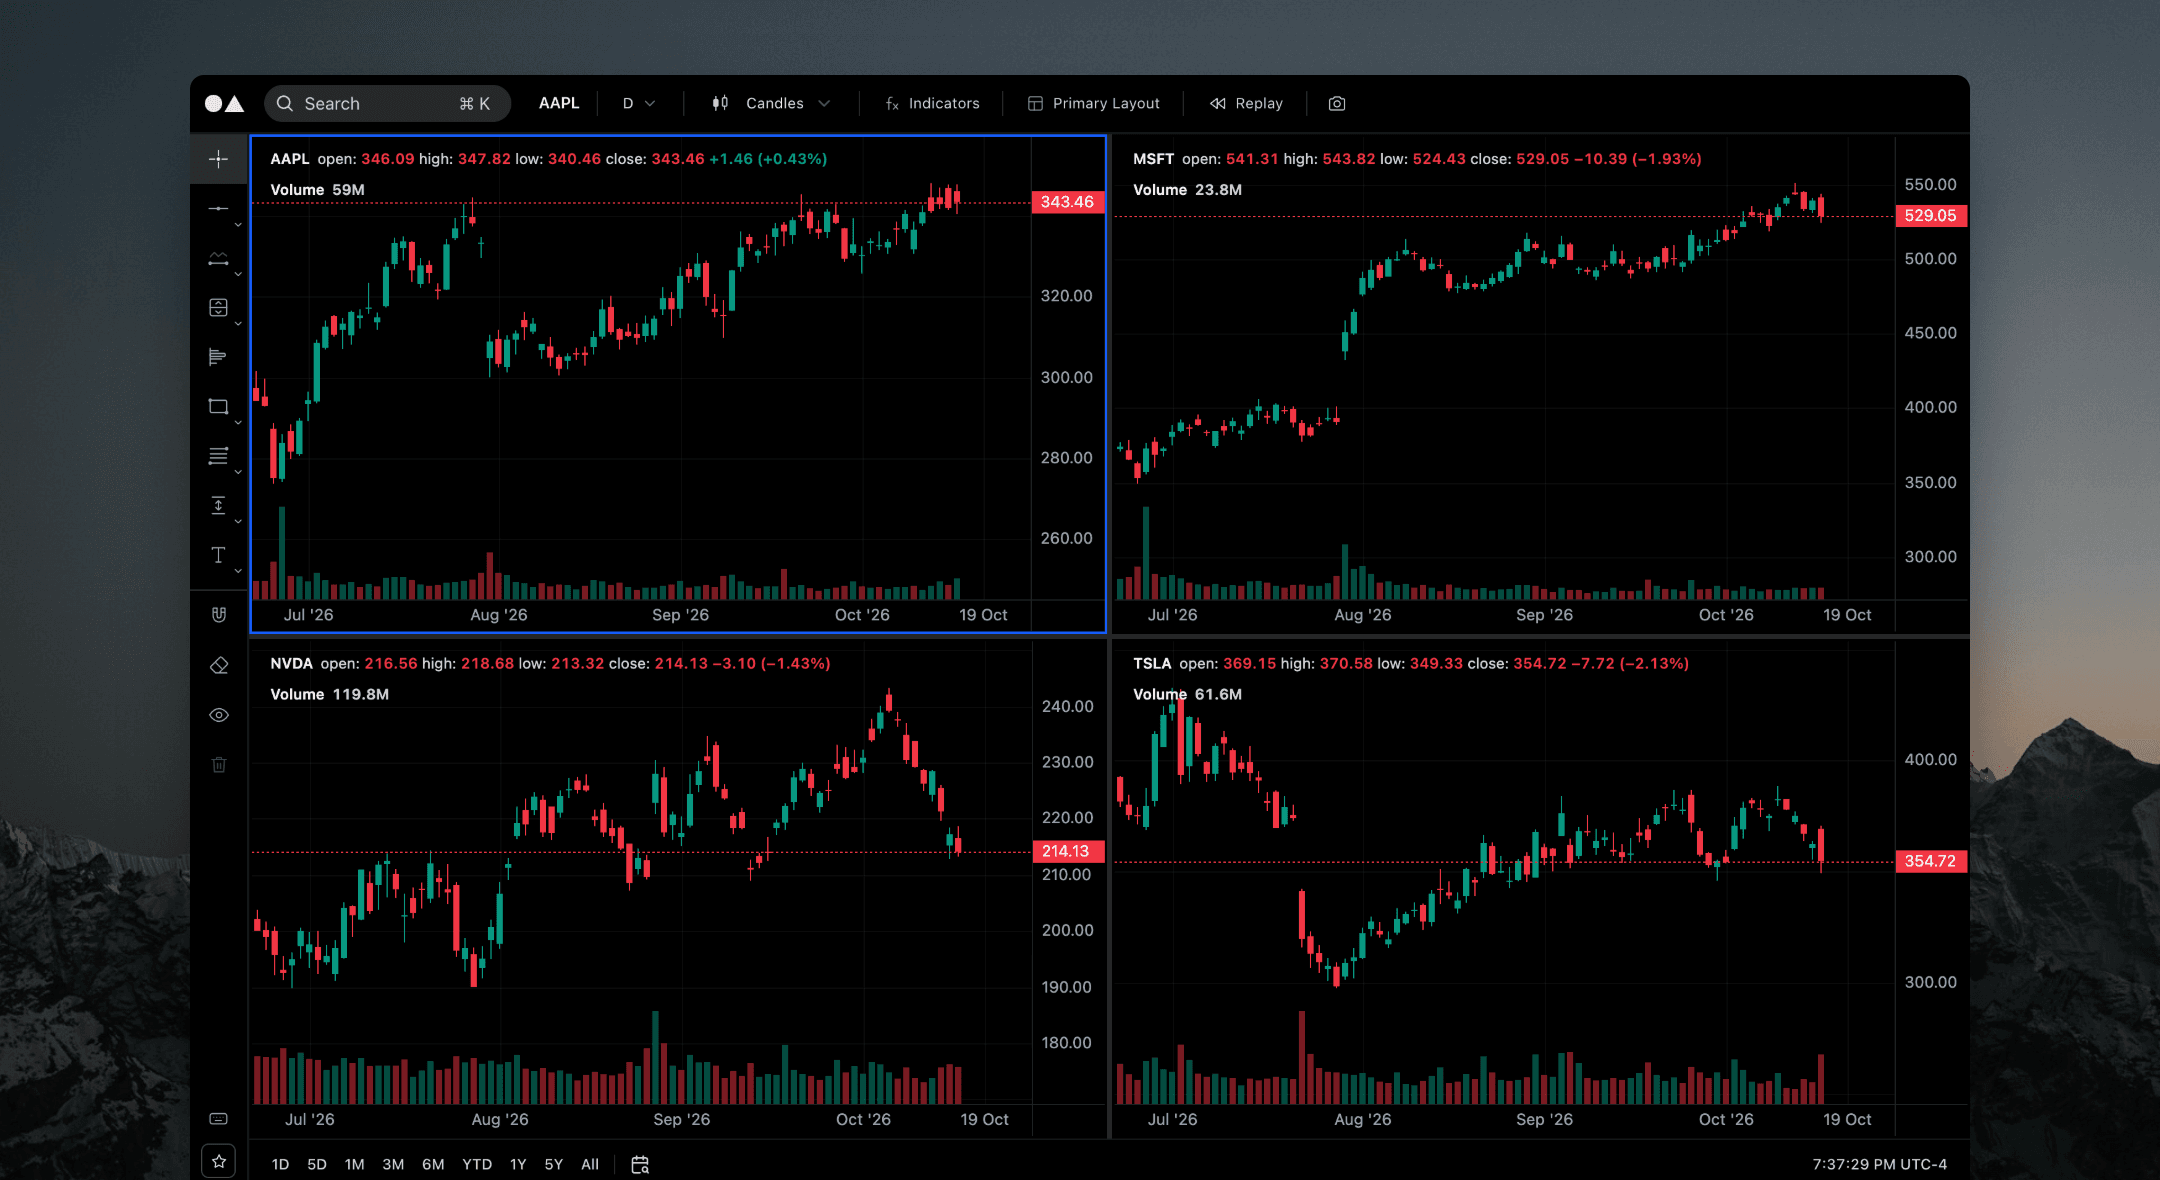
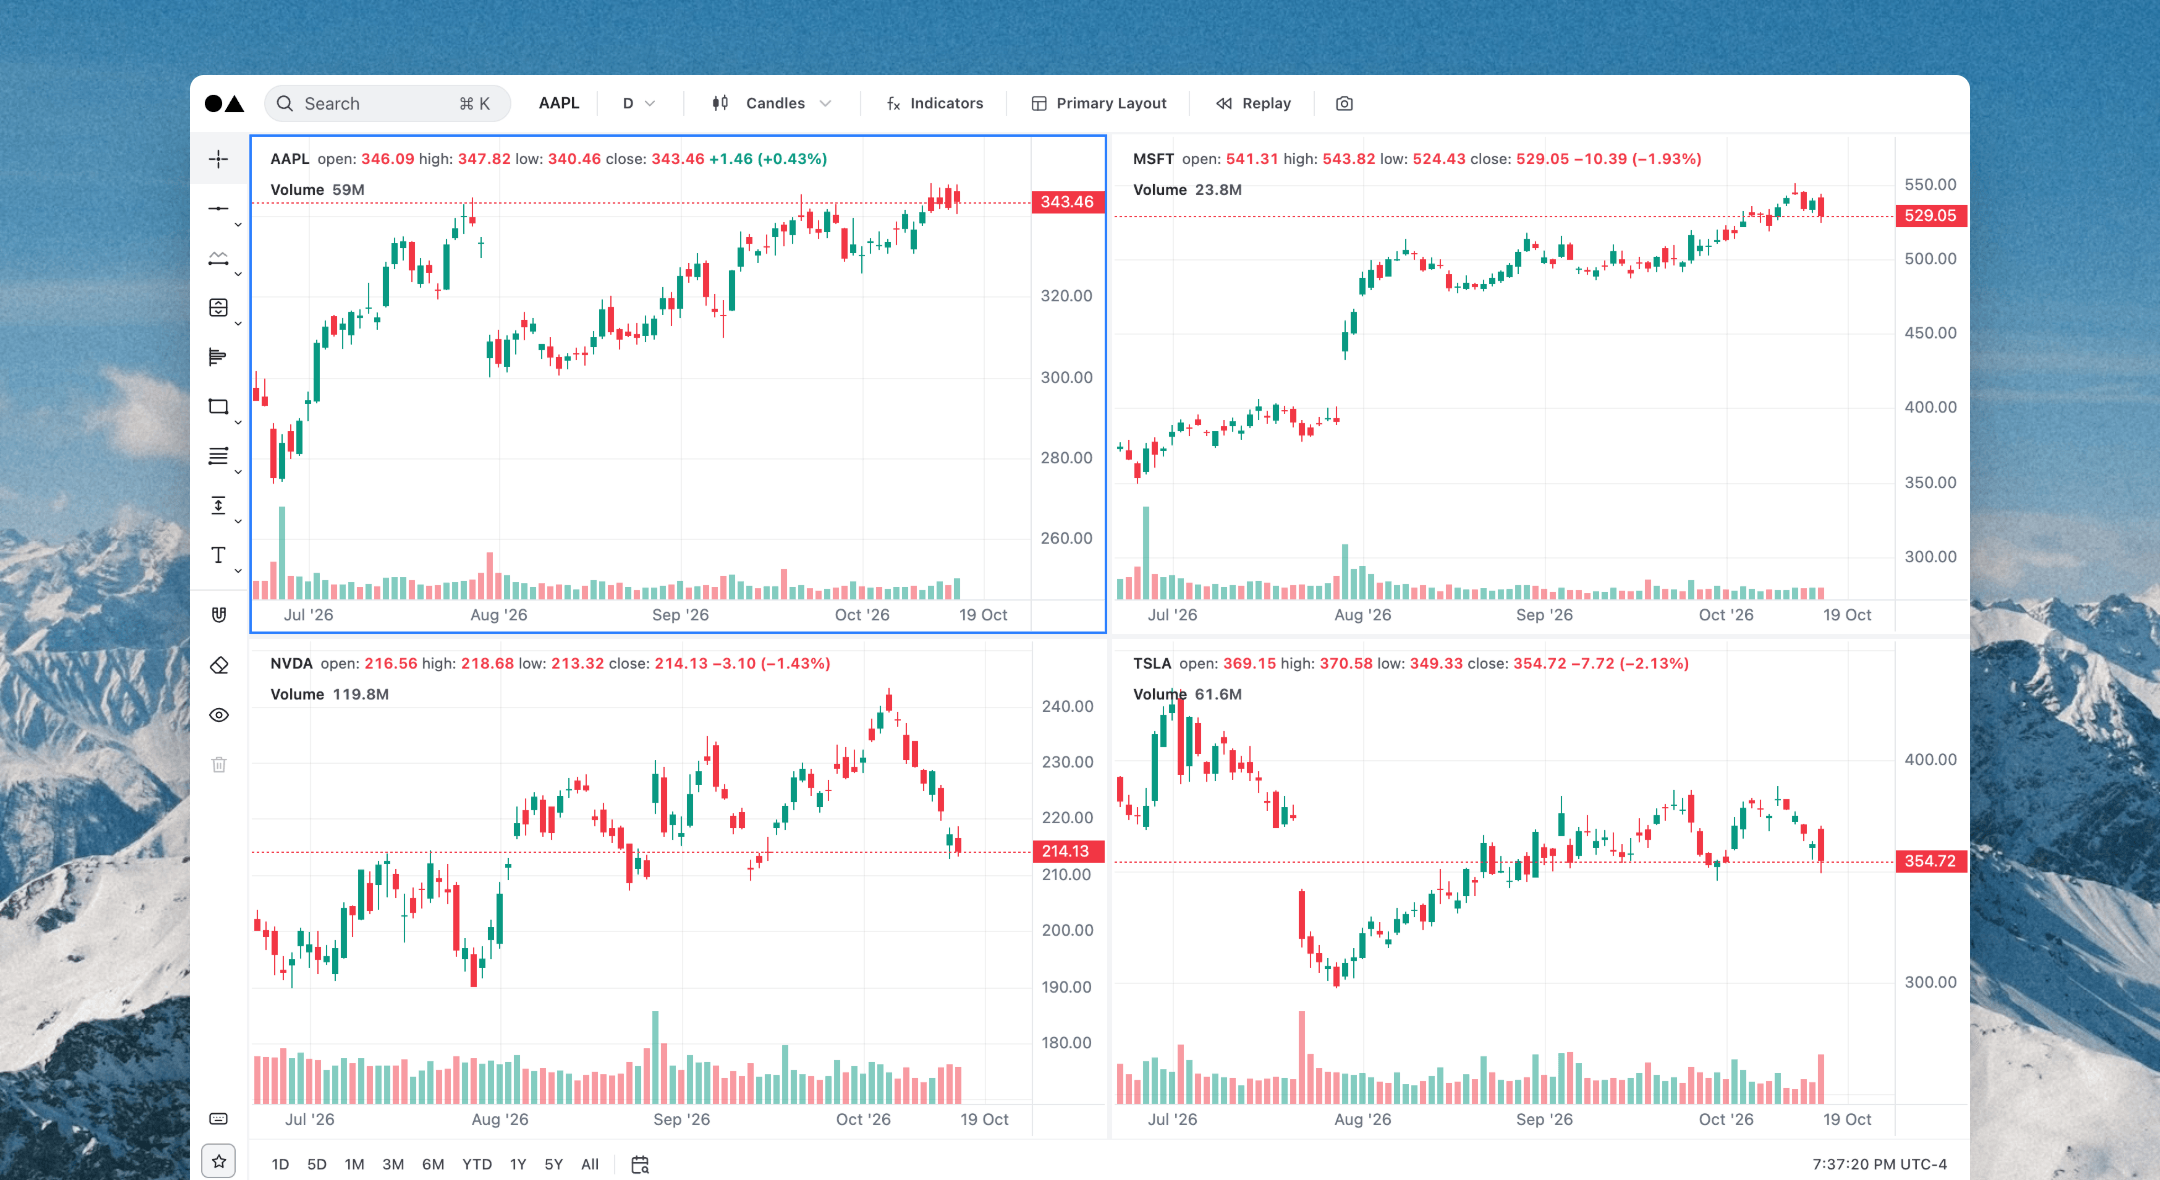
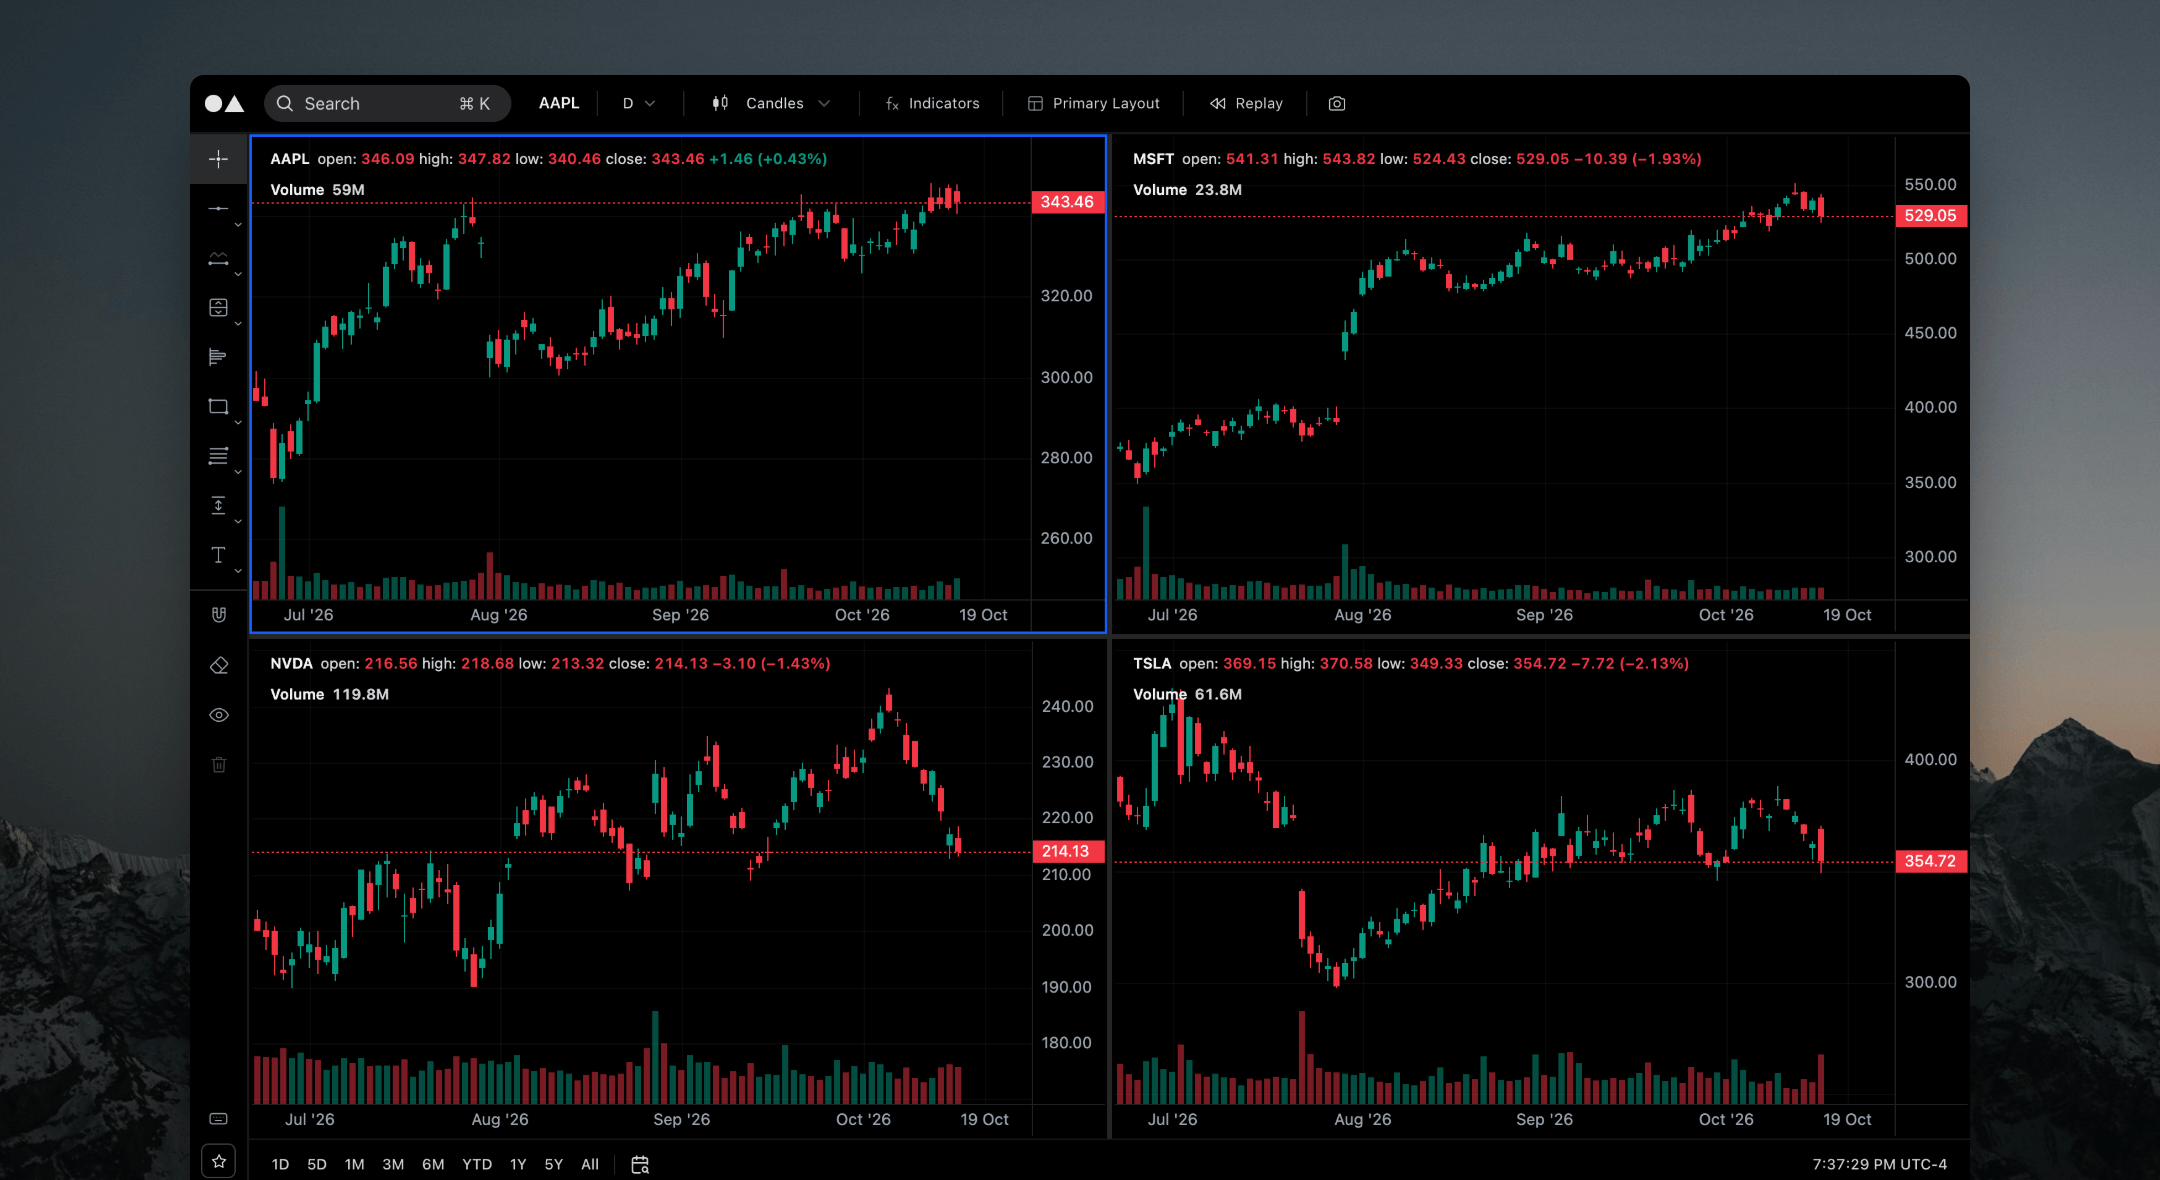
Advanced Charts
Multi-panel layouts, 24 drawing tools and in-line alerts you can drag to any price.
Crypto Analytics
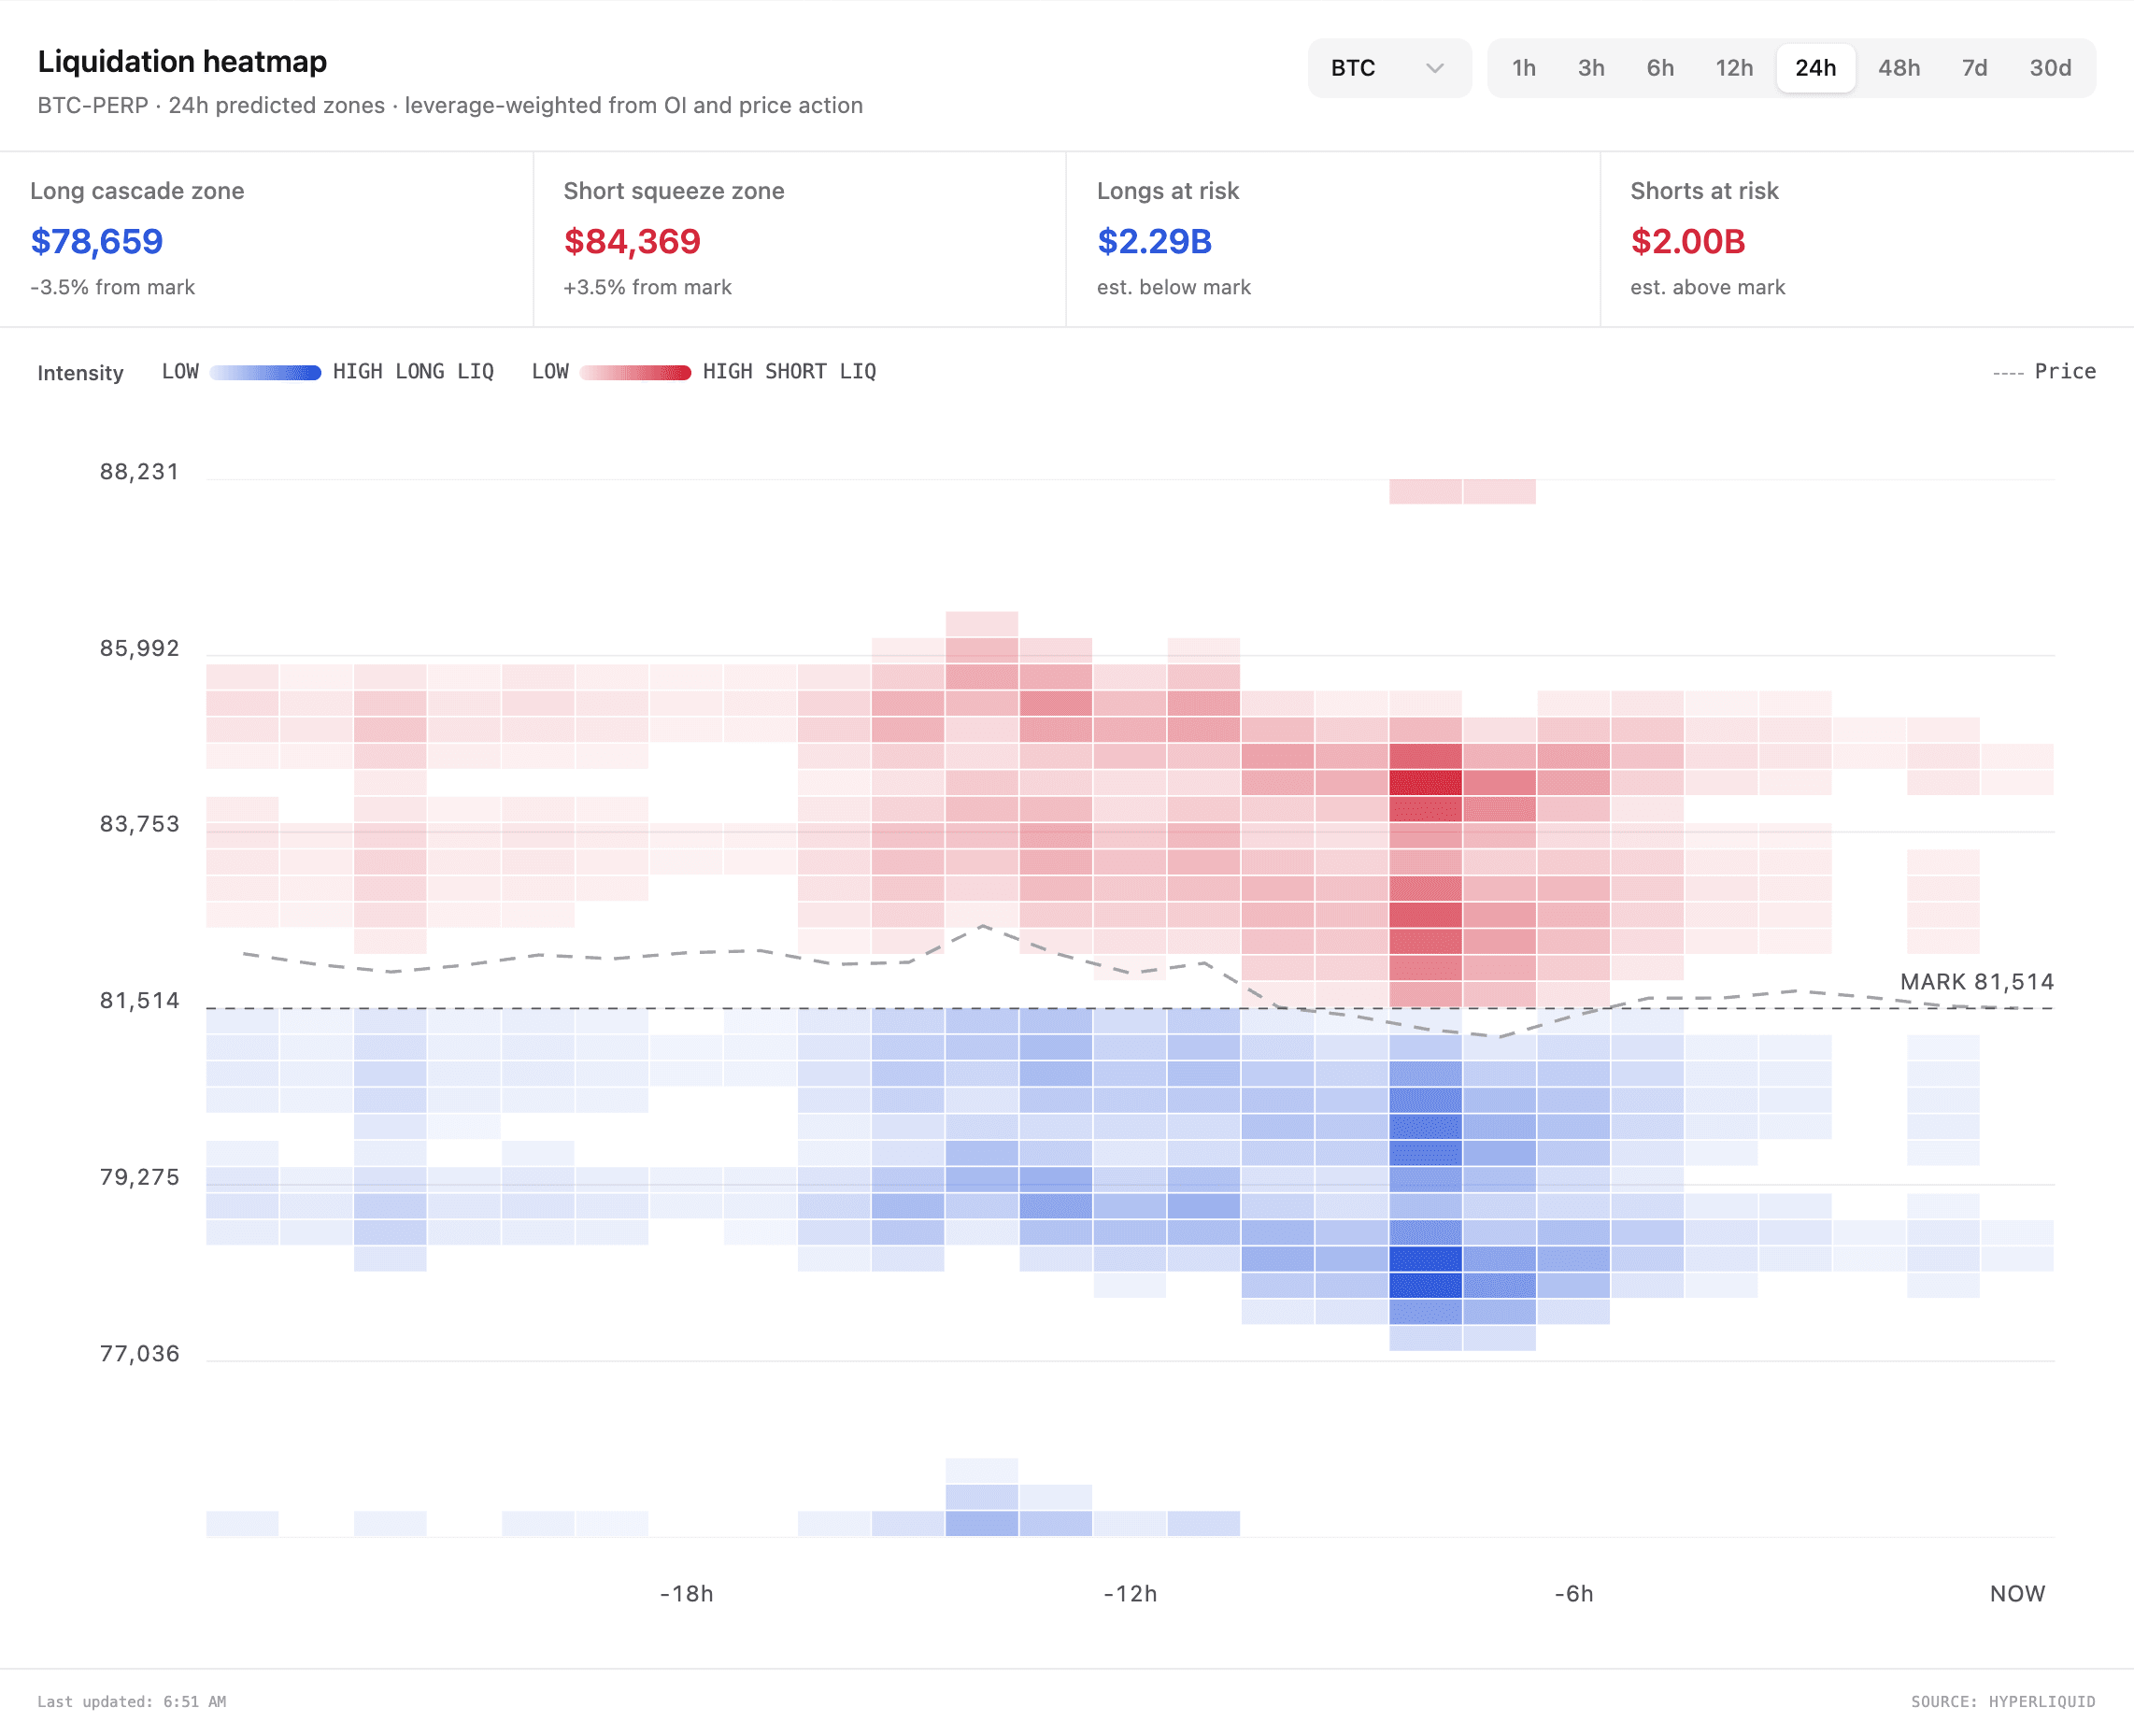
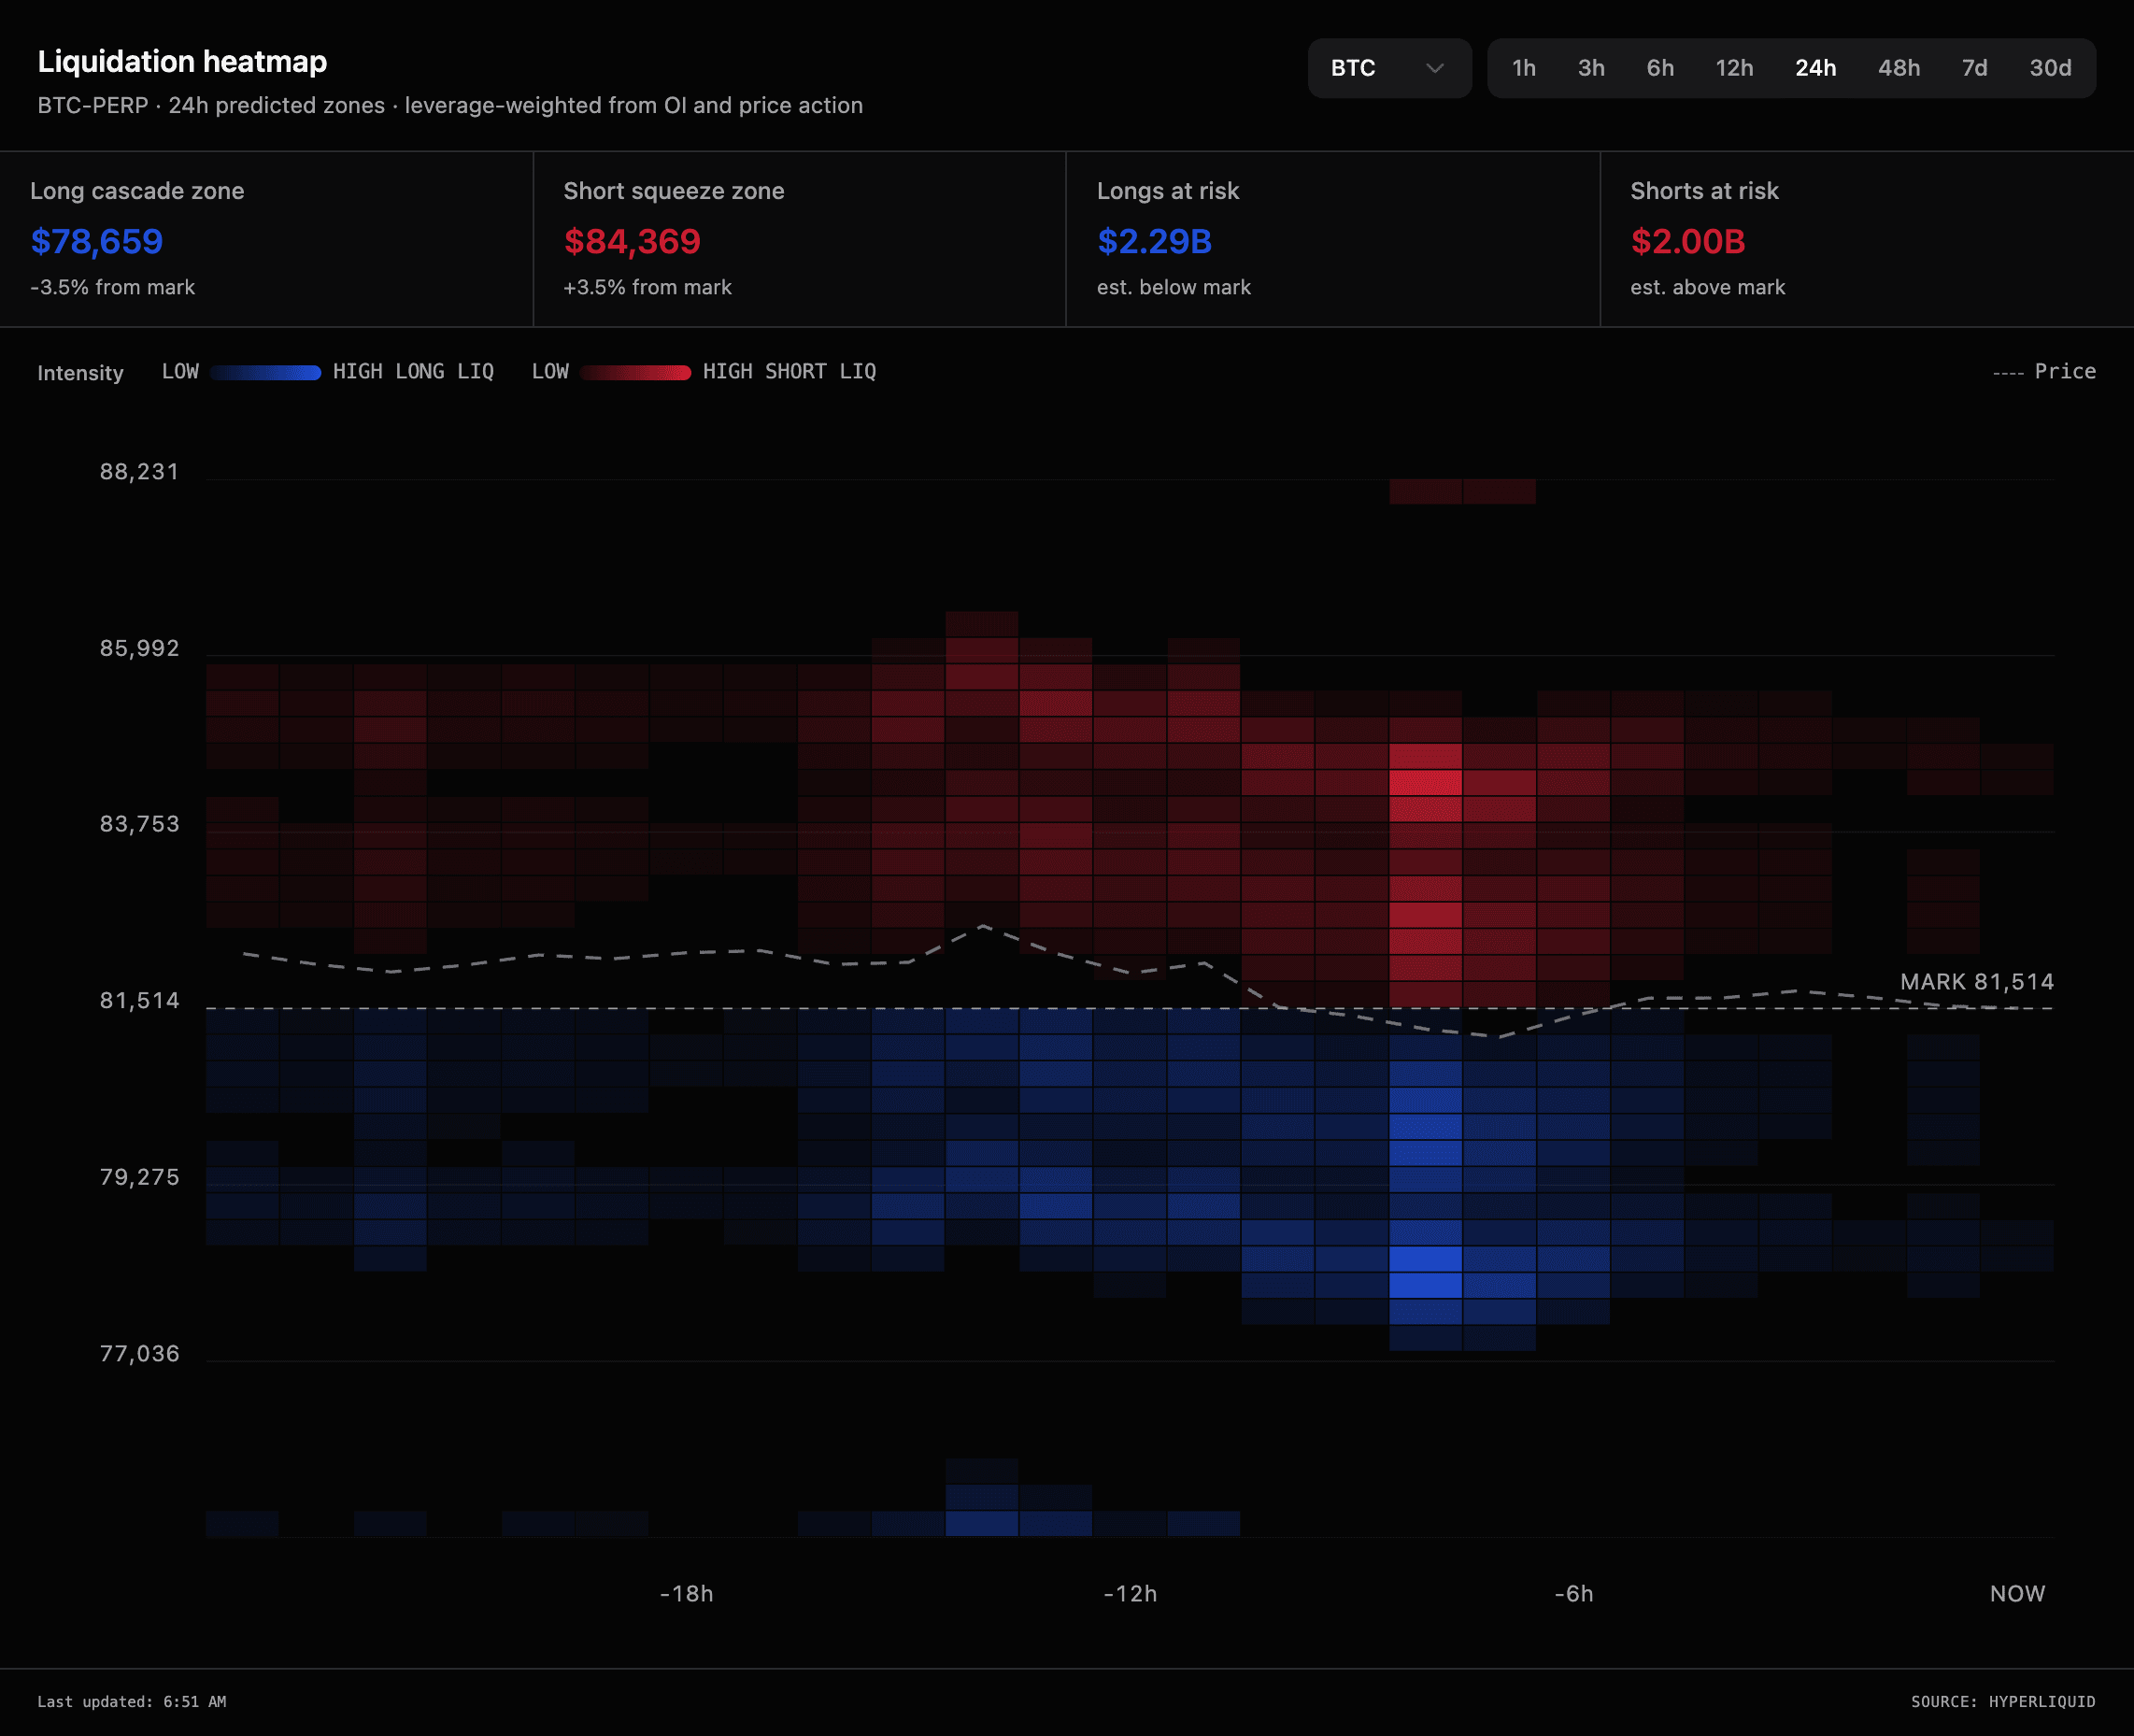
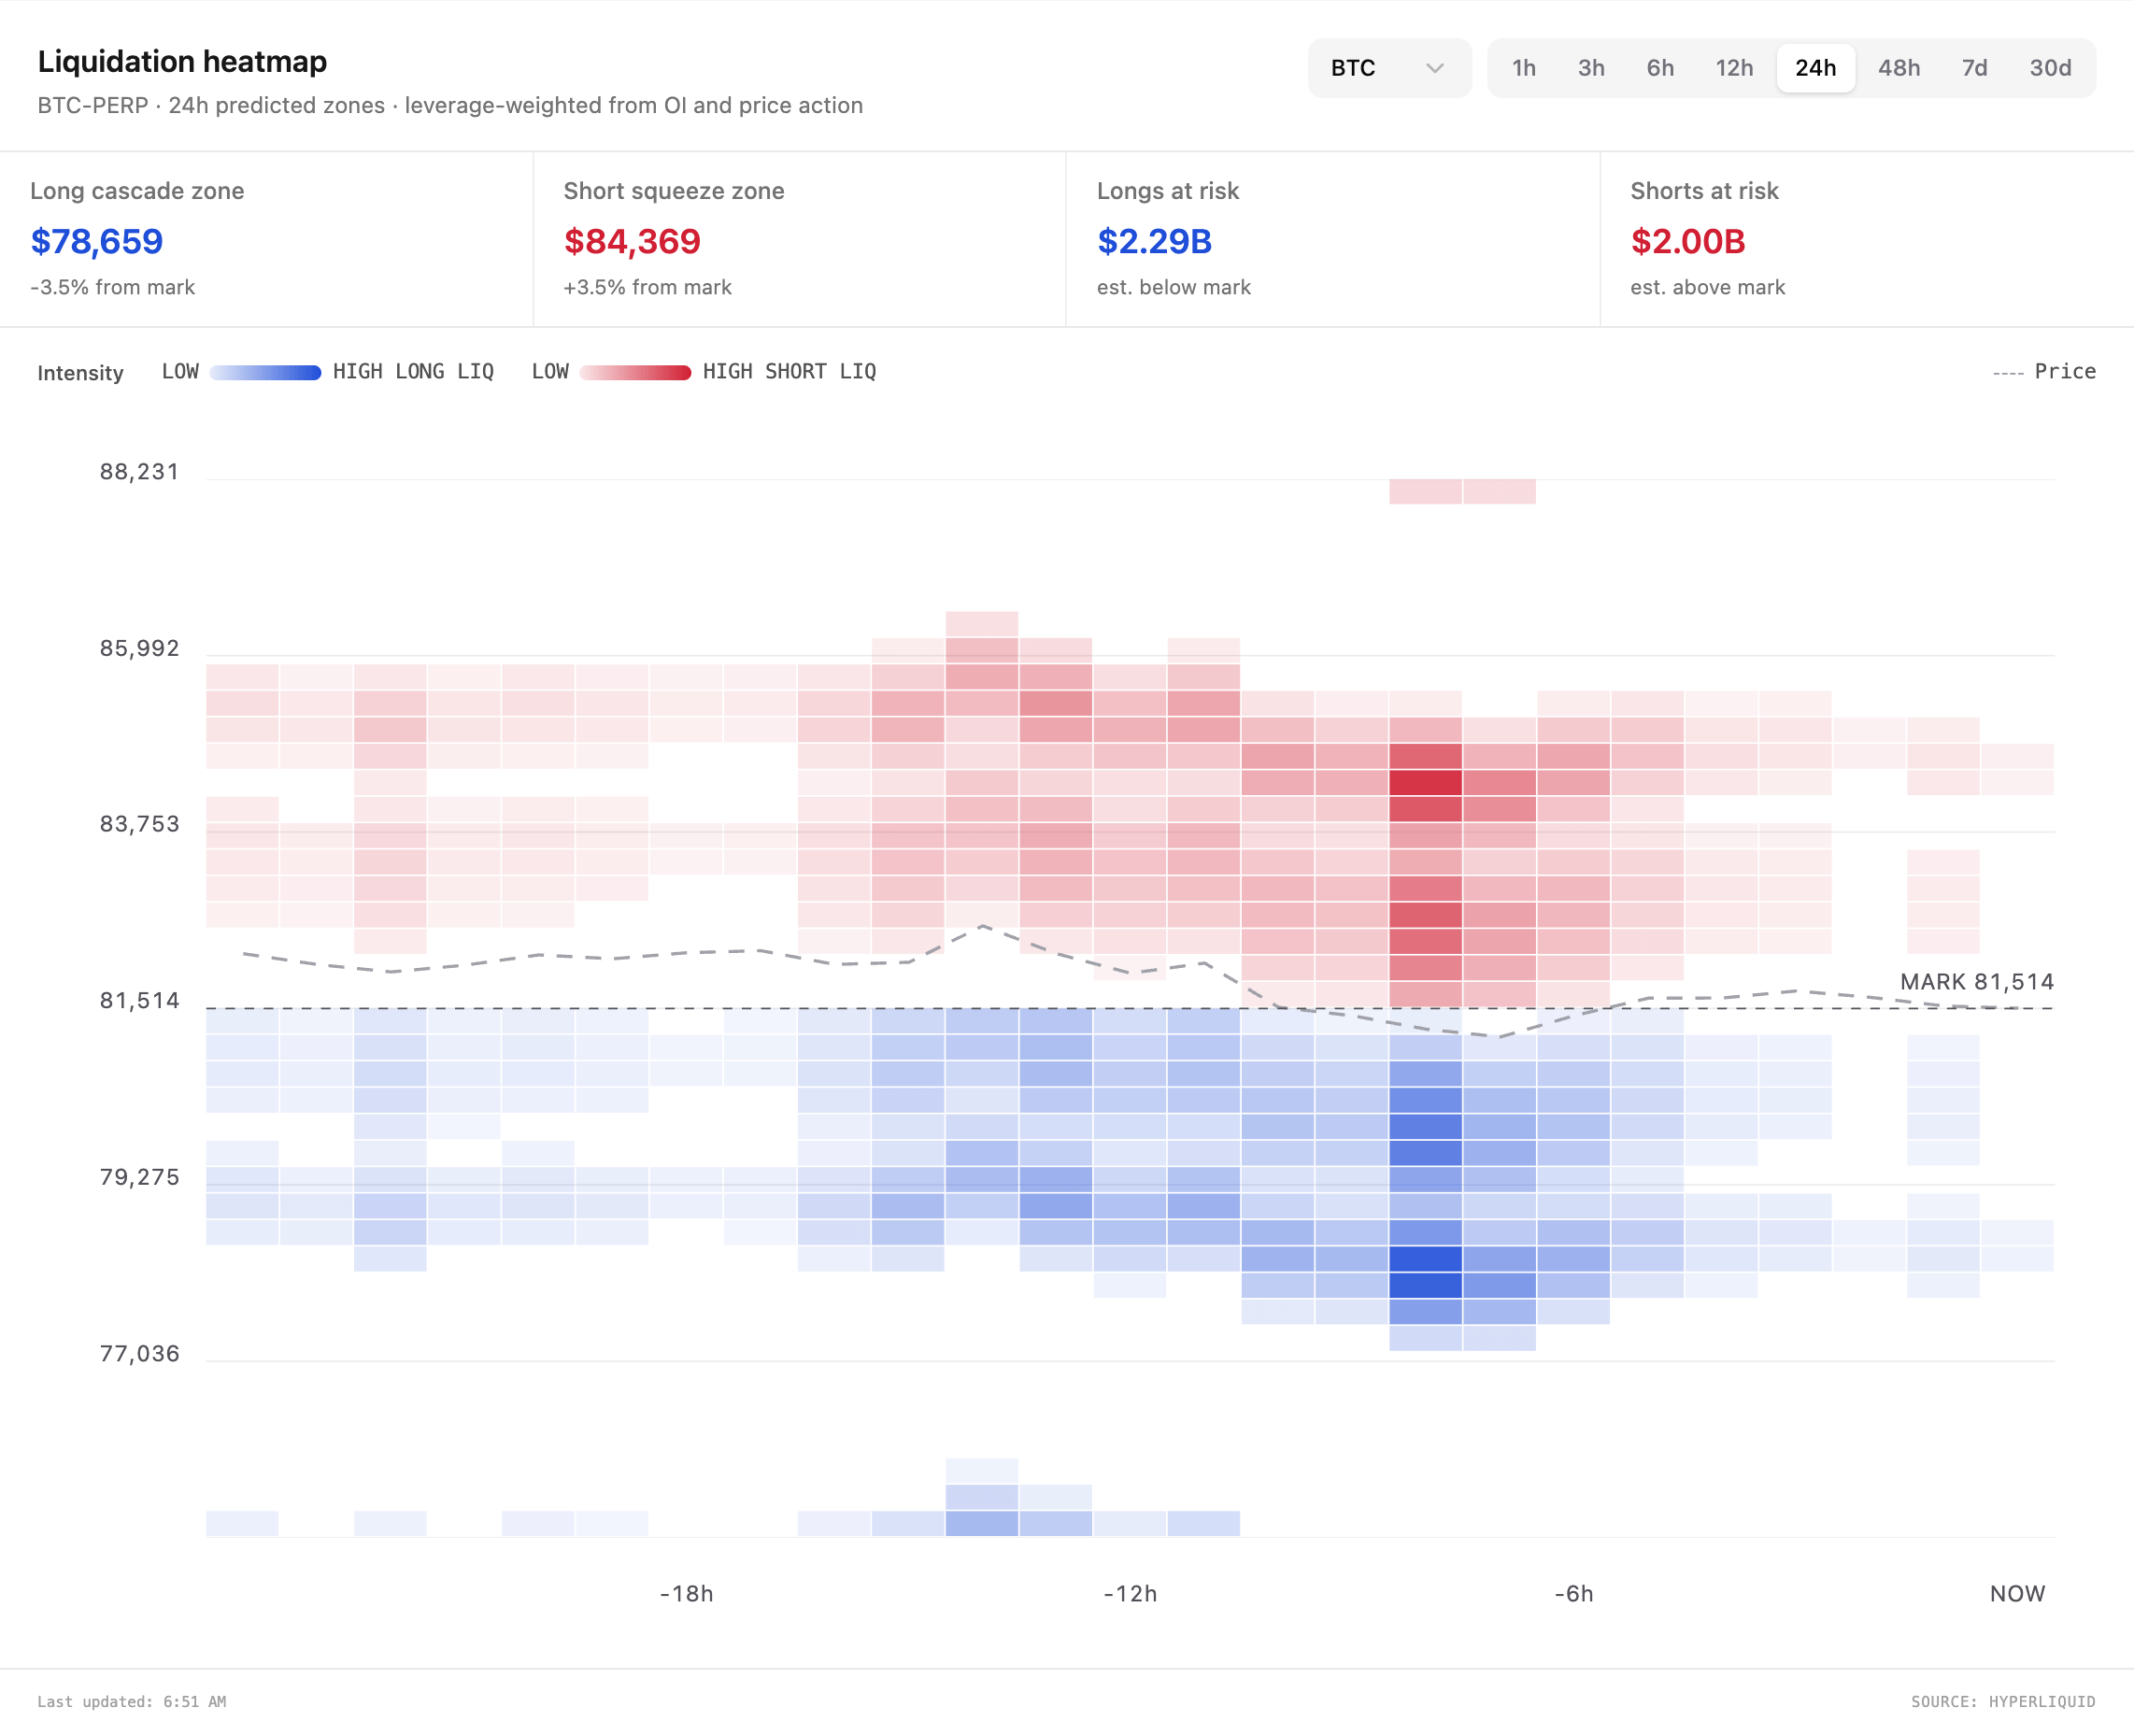
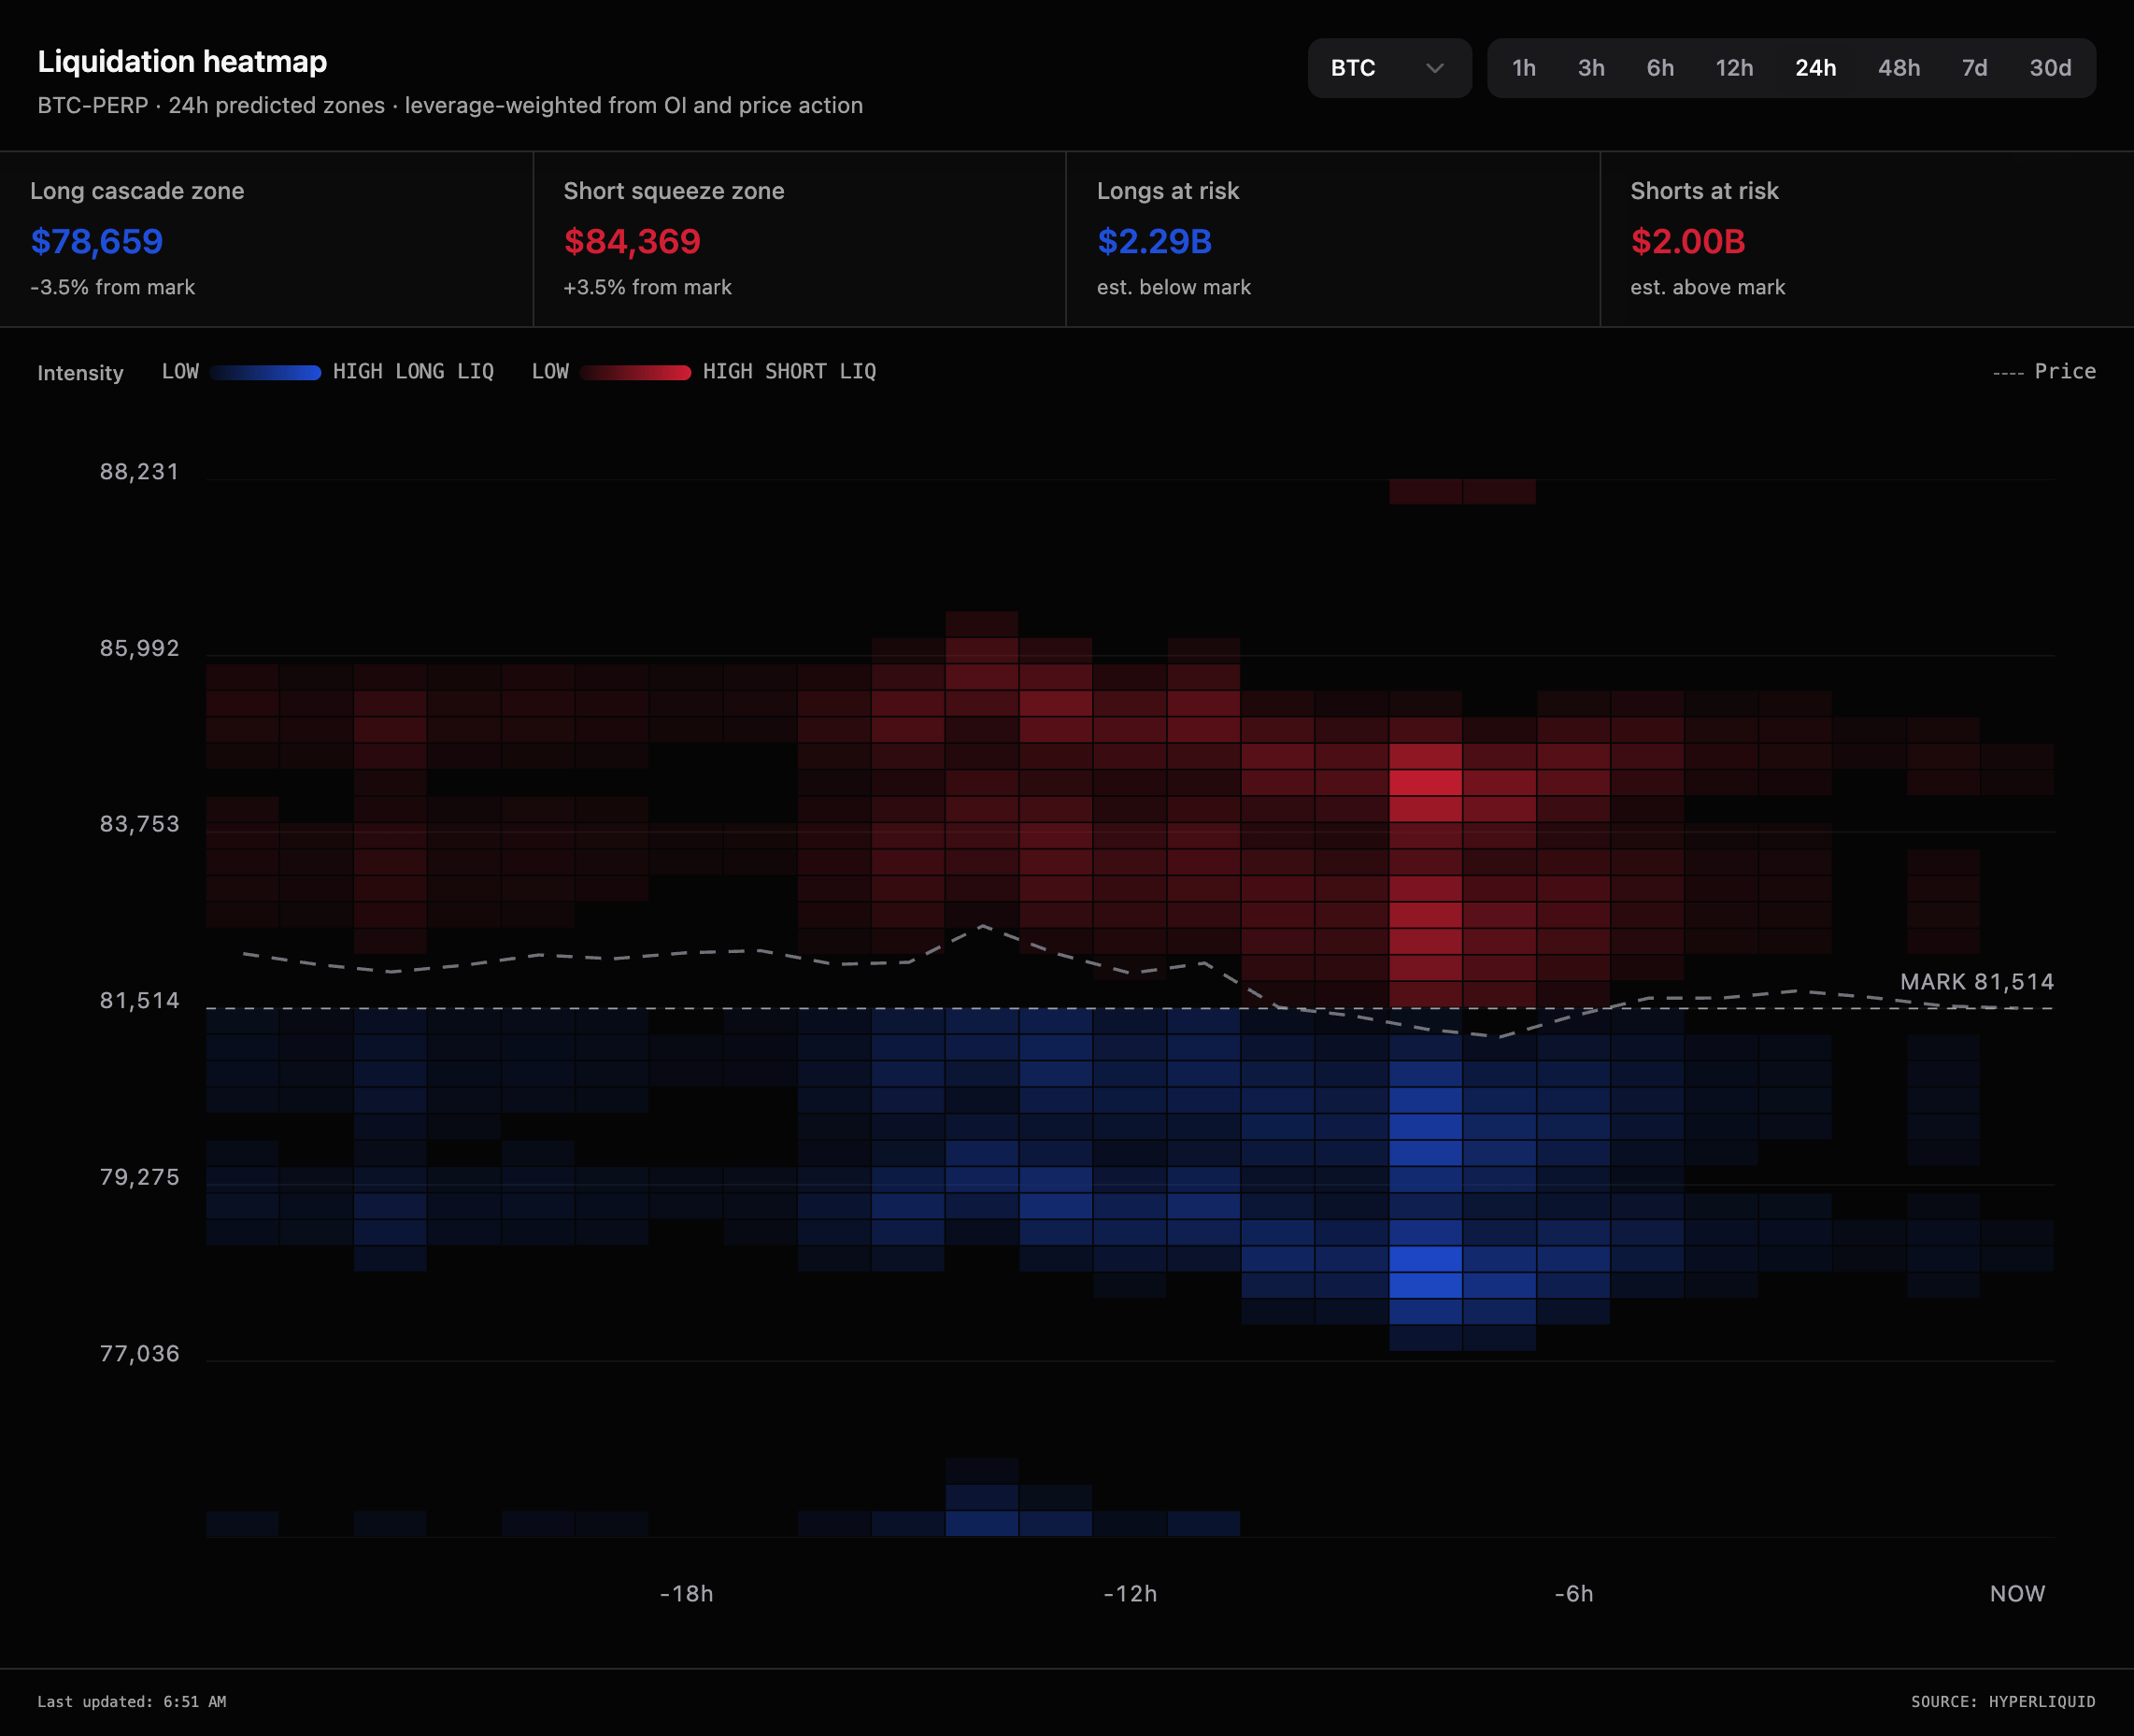
Read funding, liquidations, ETF flows and on-chain cycle metrics together in one view.
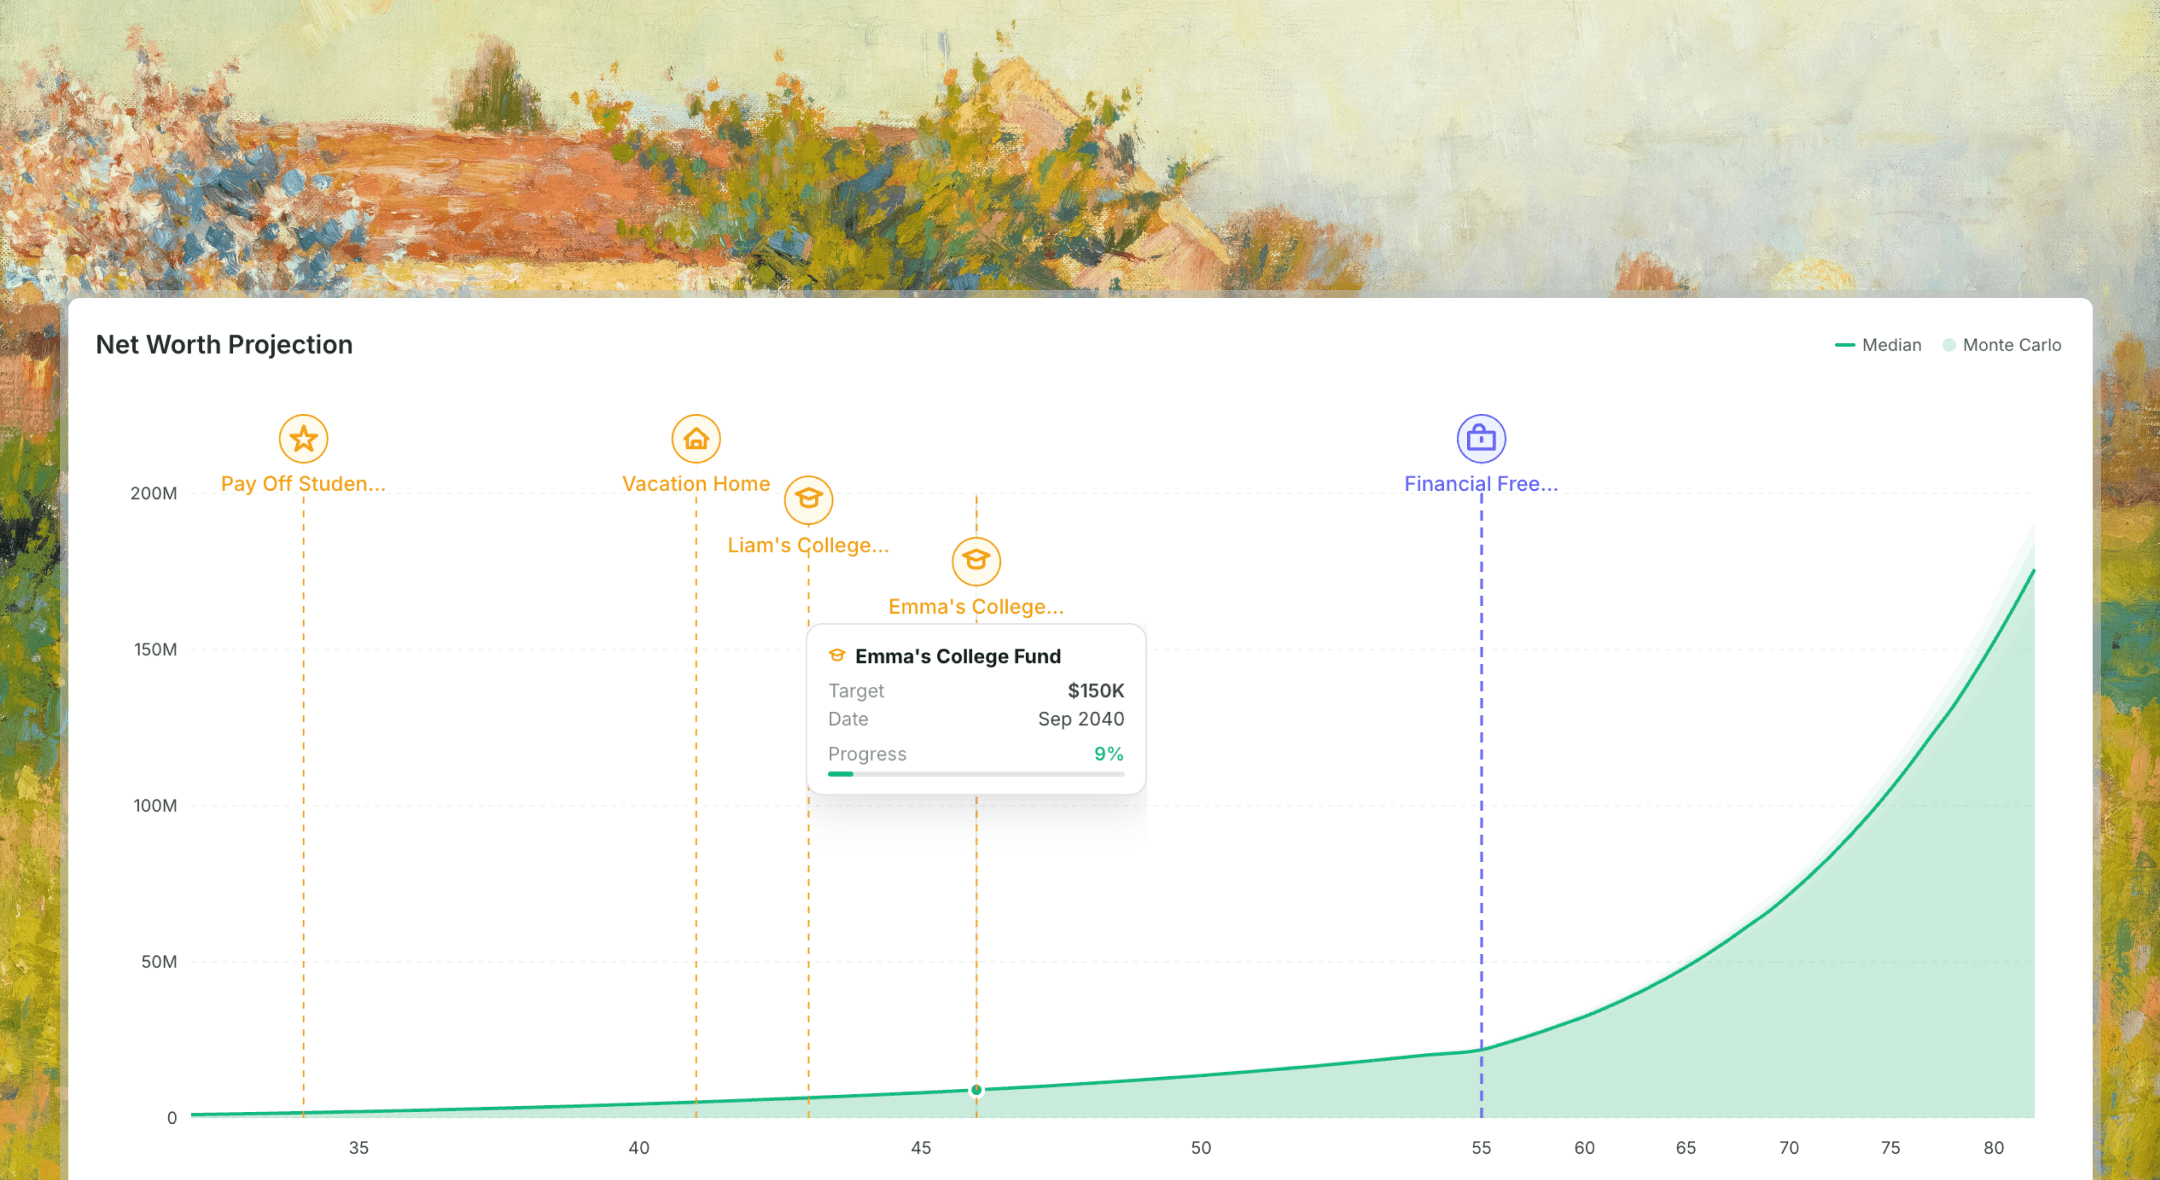
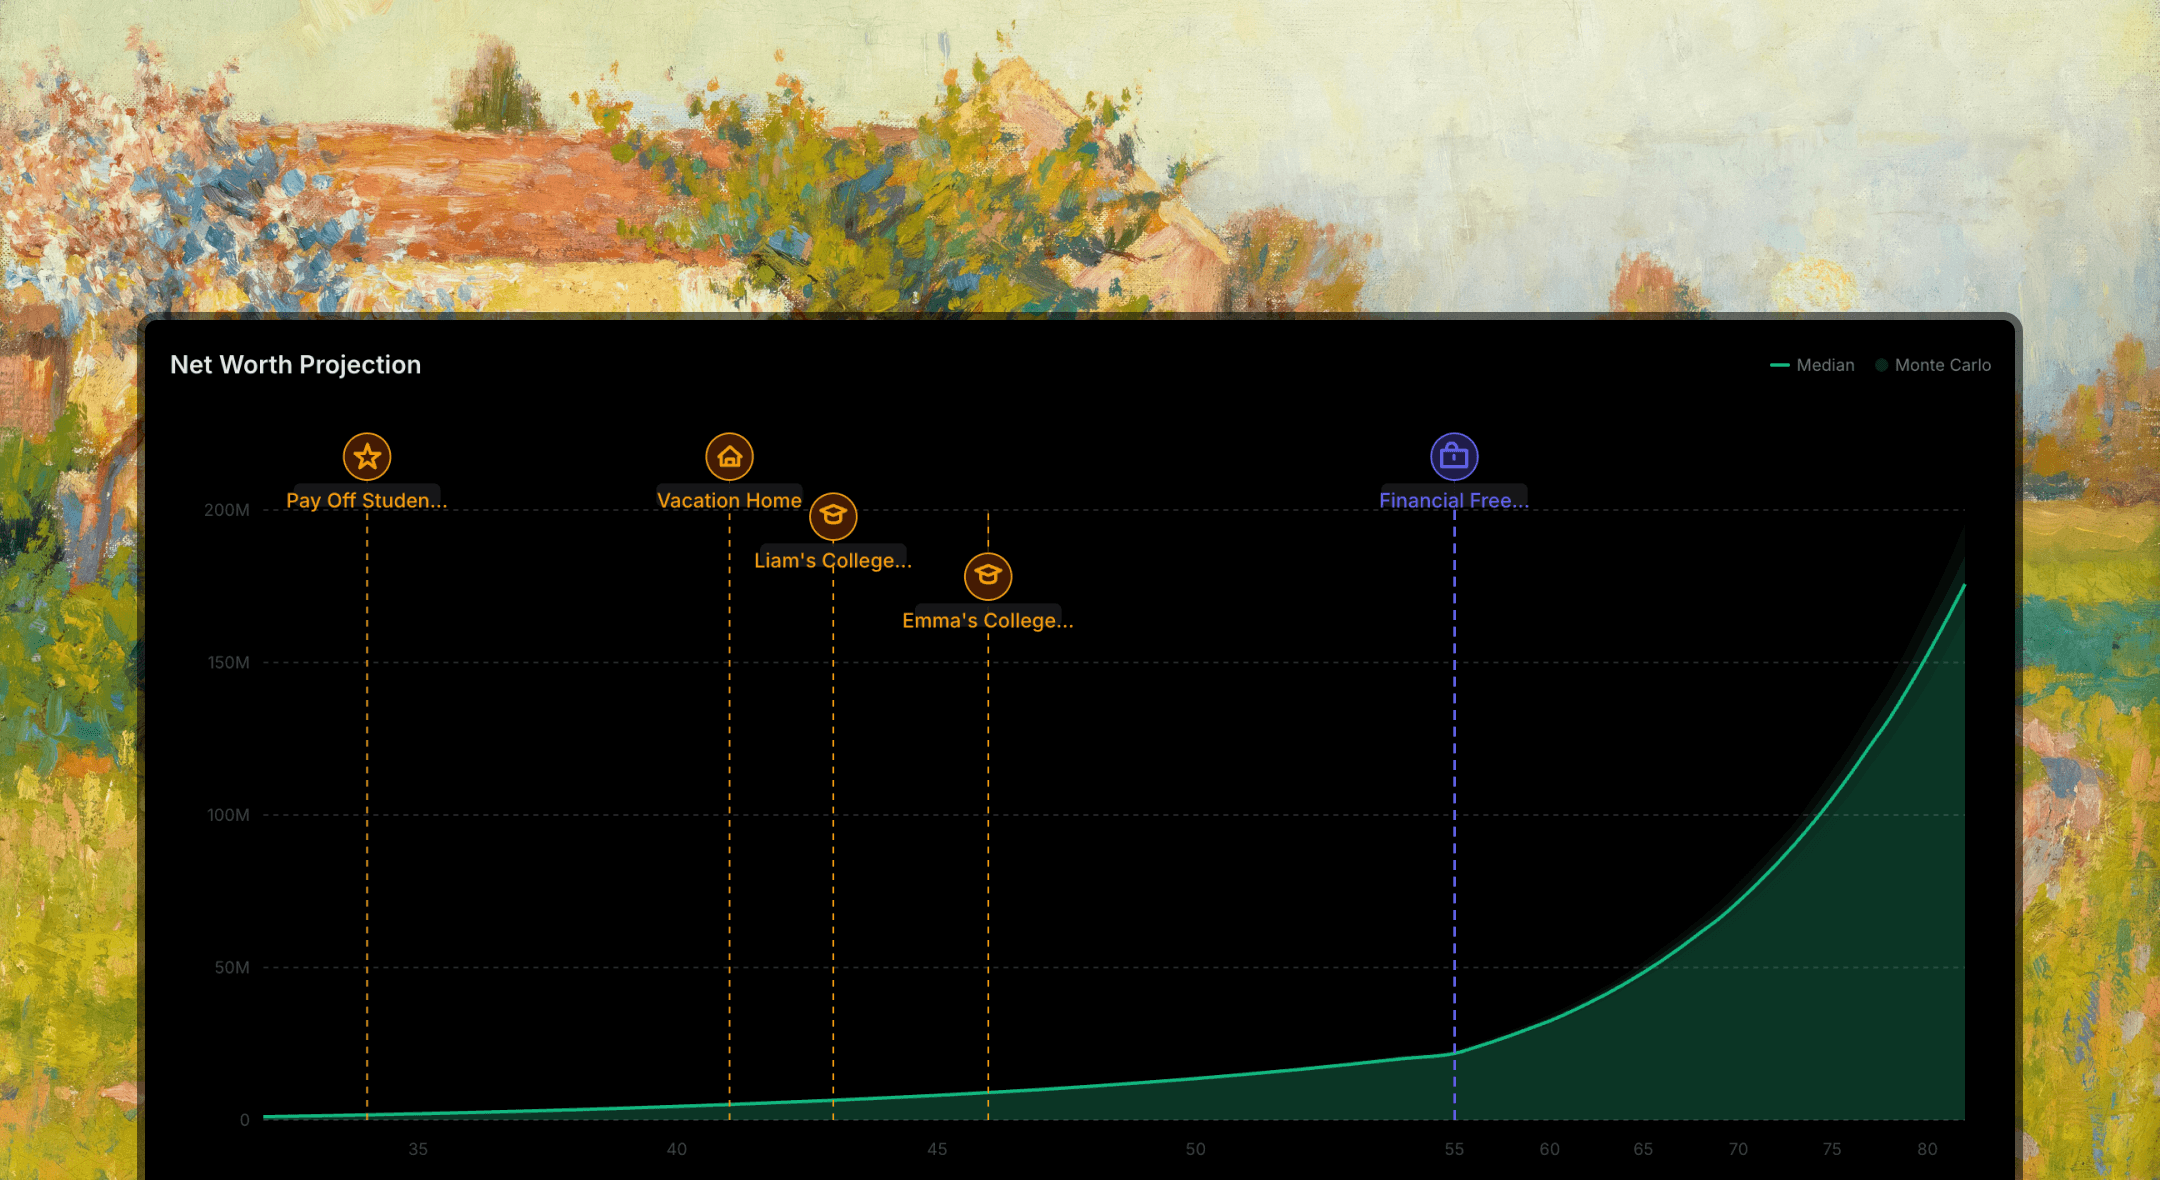
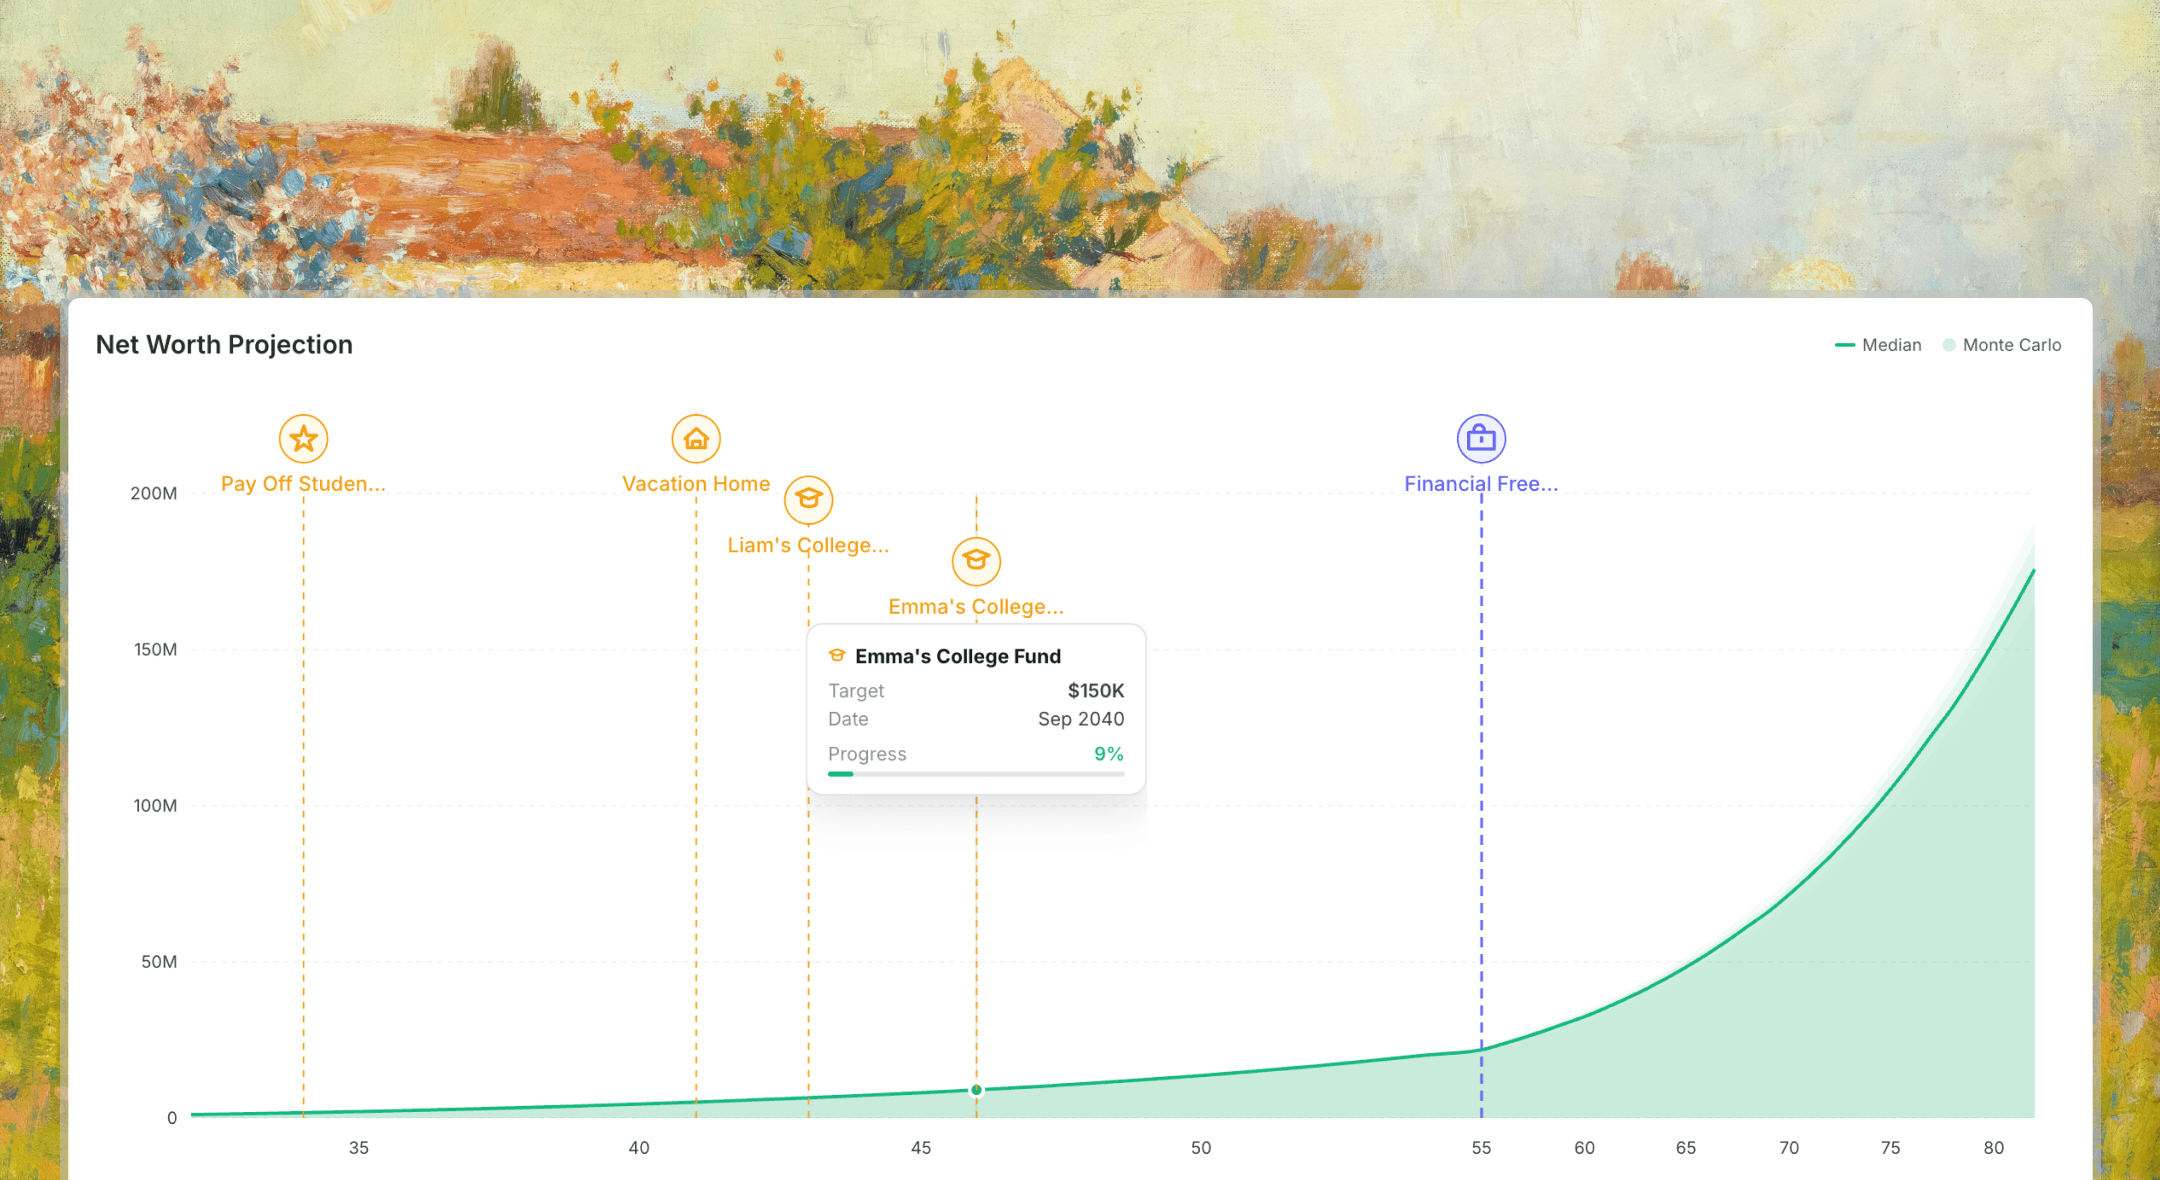
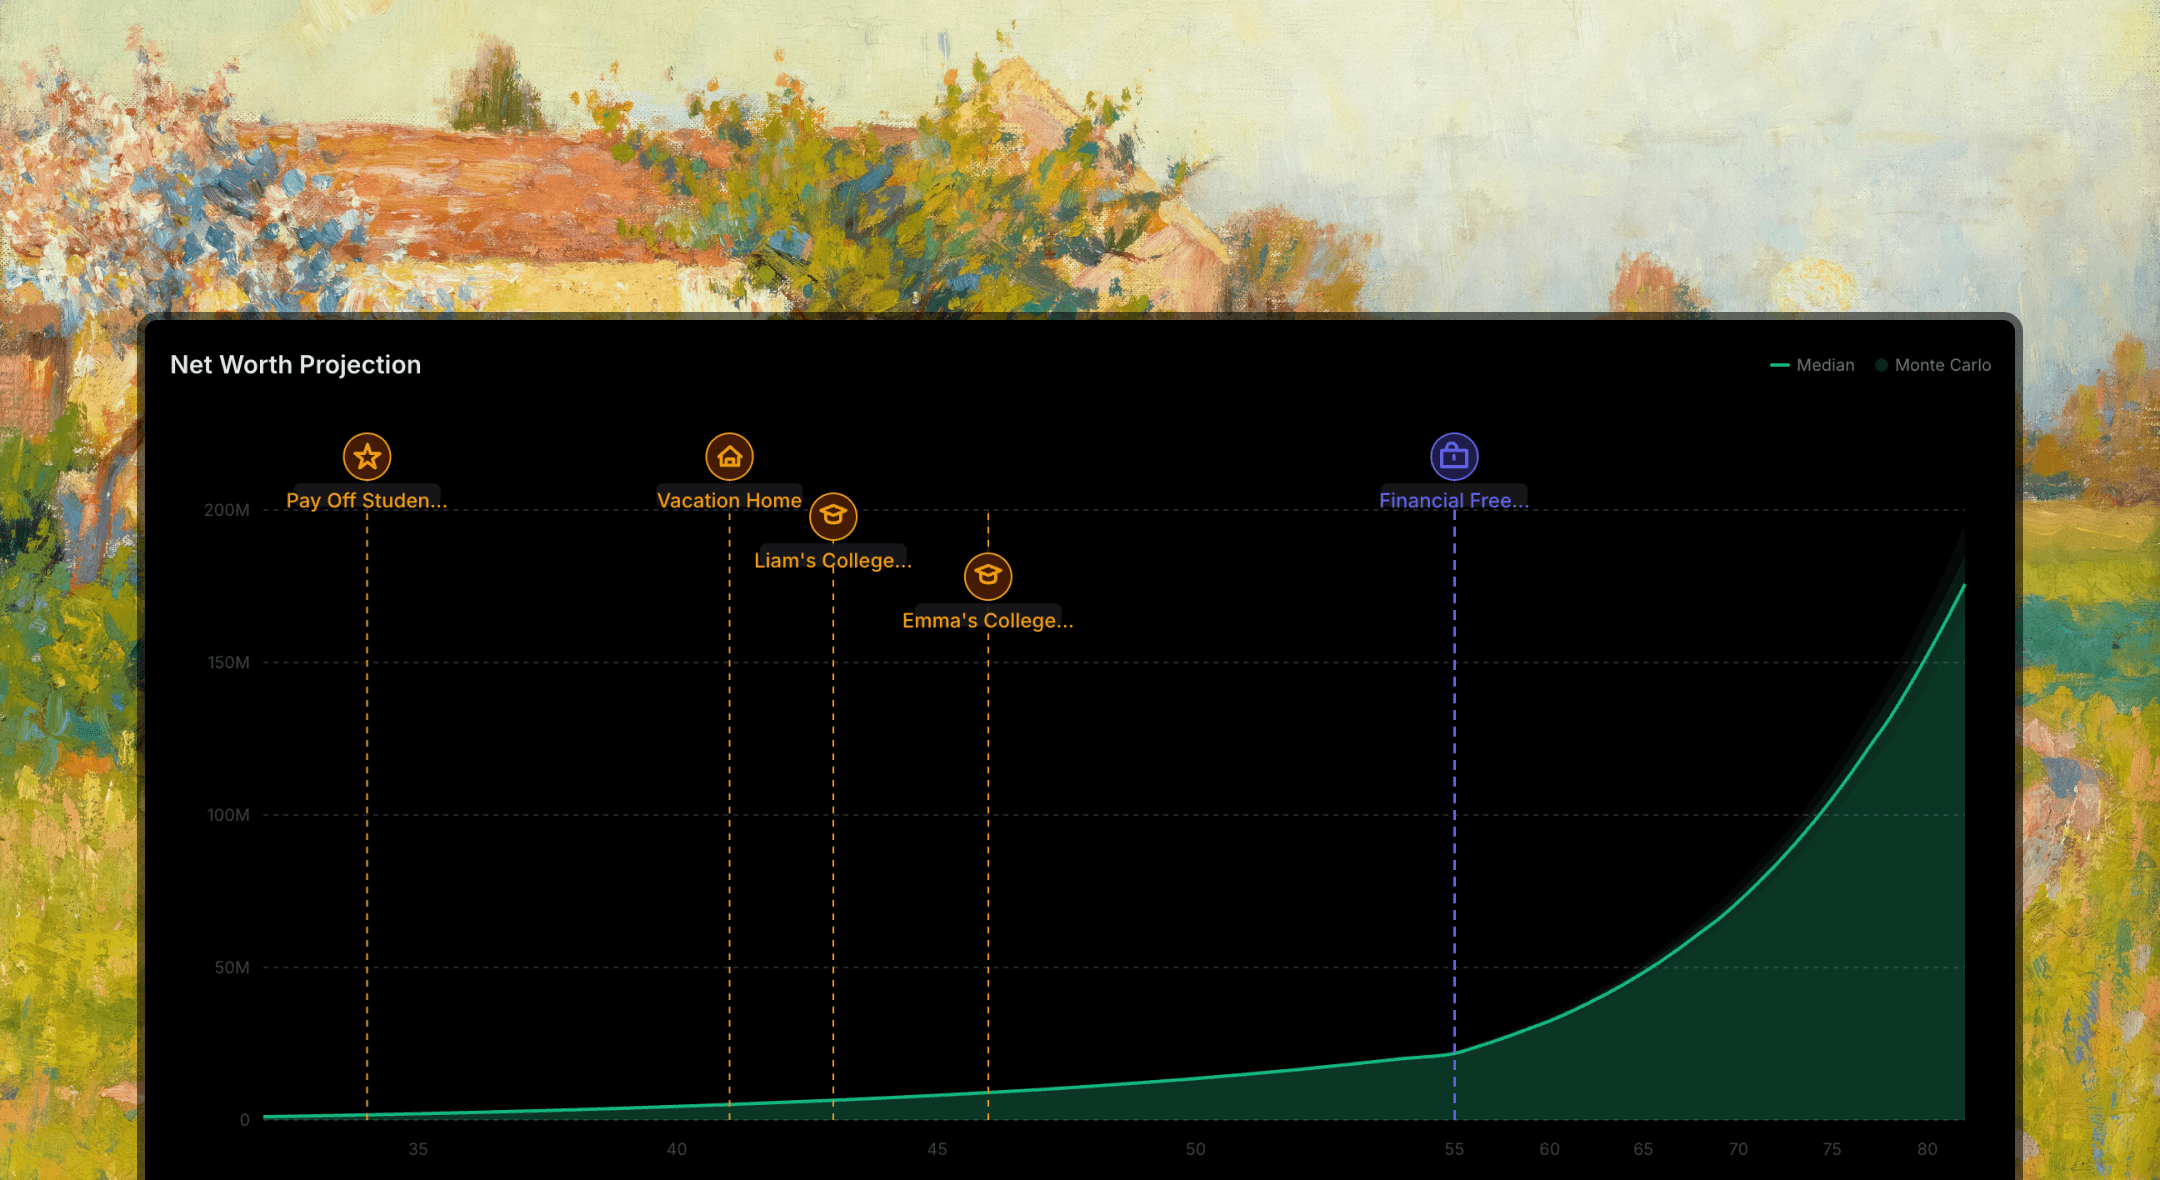
Financial Planning
Model income, expenses and goals, then project your net worth all the way to retirement.
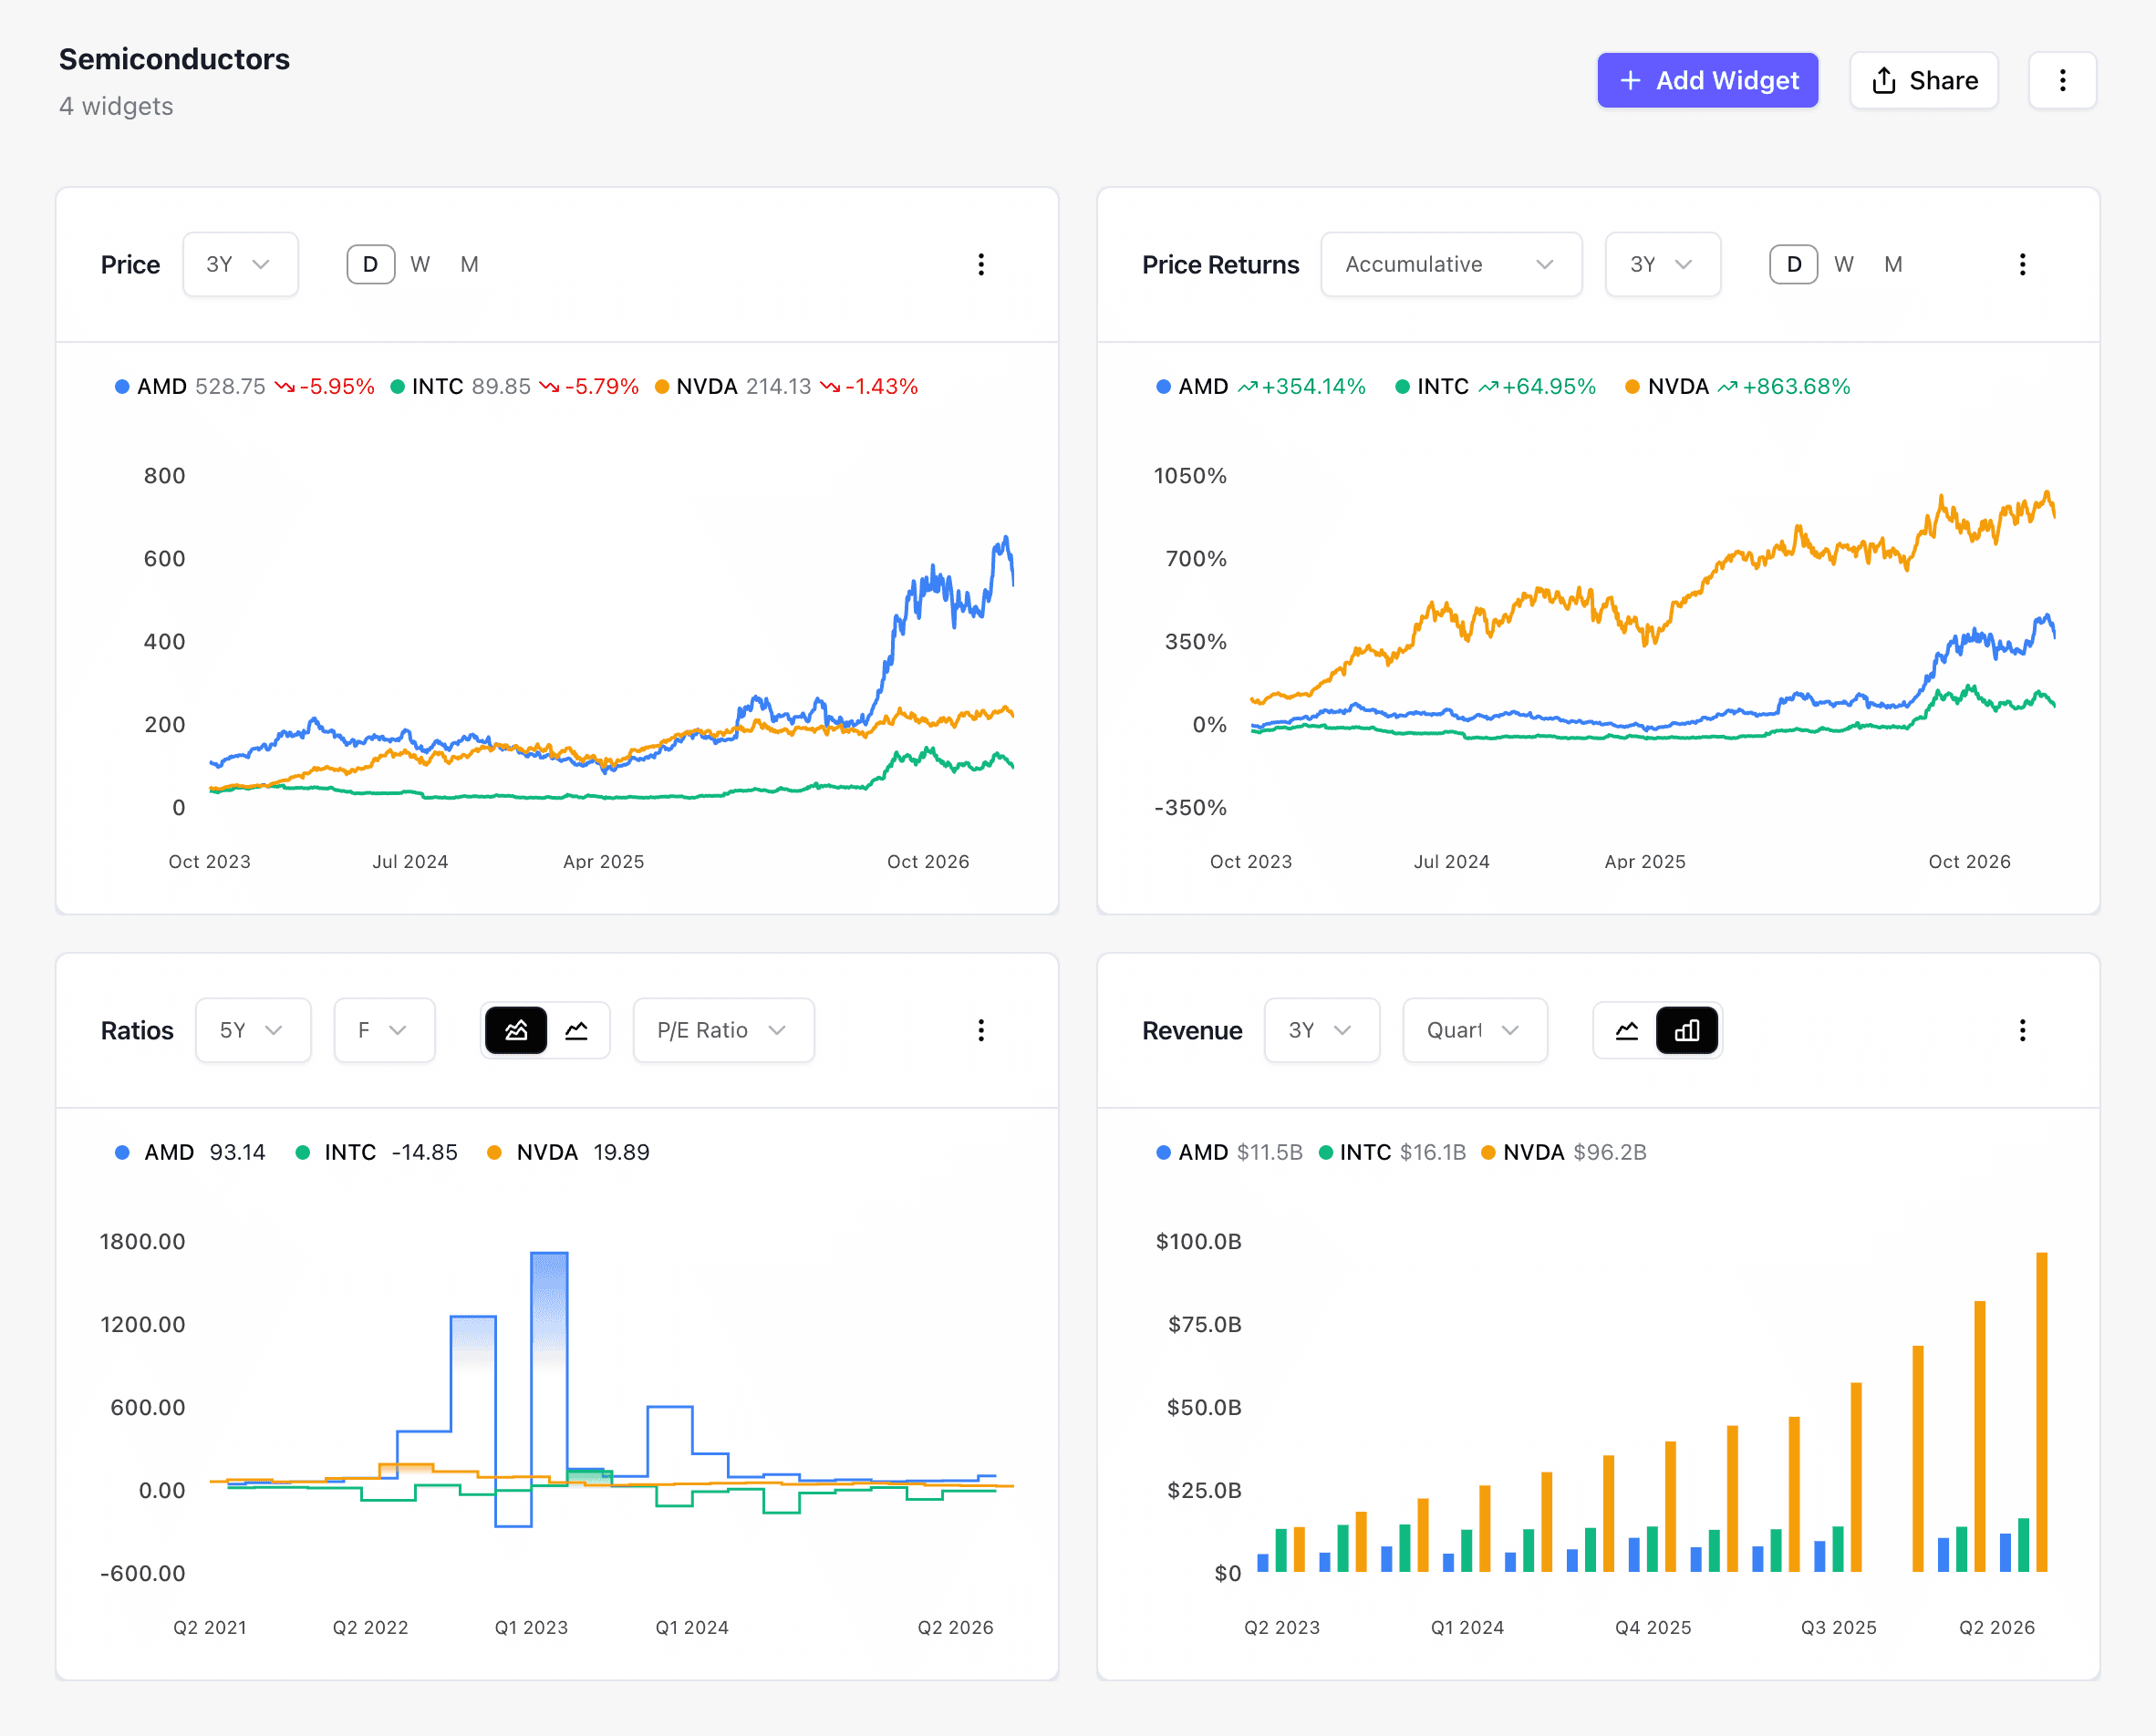
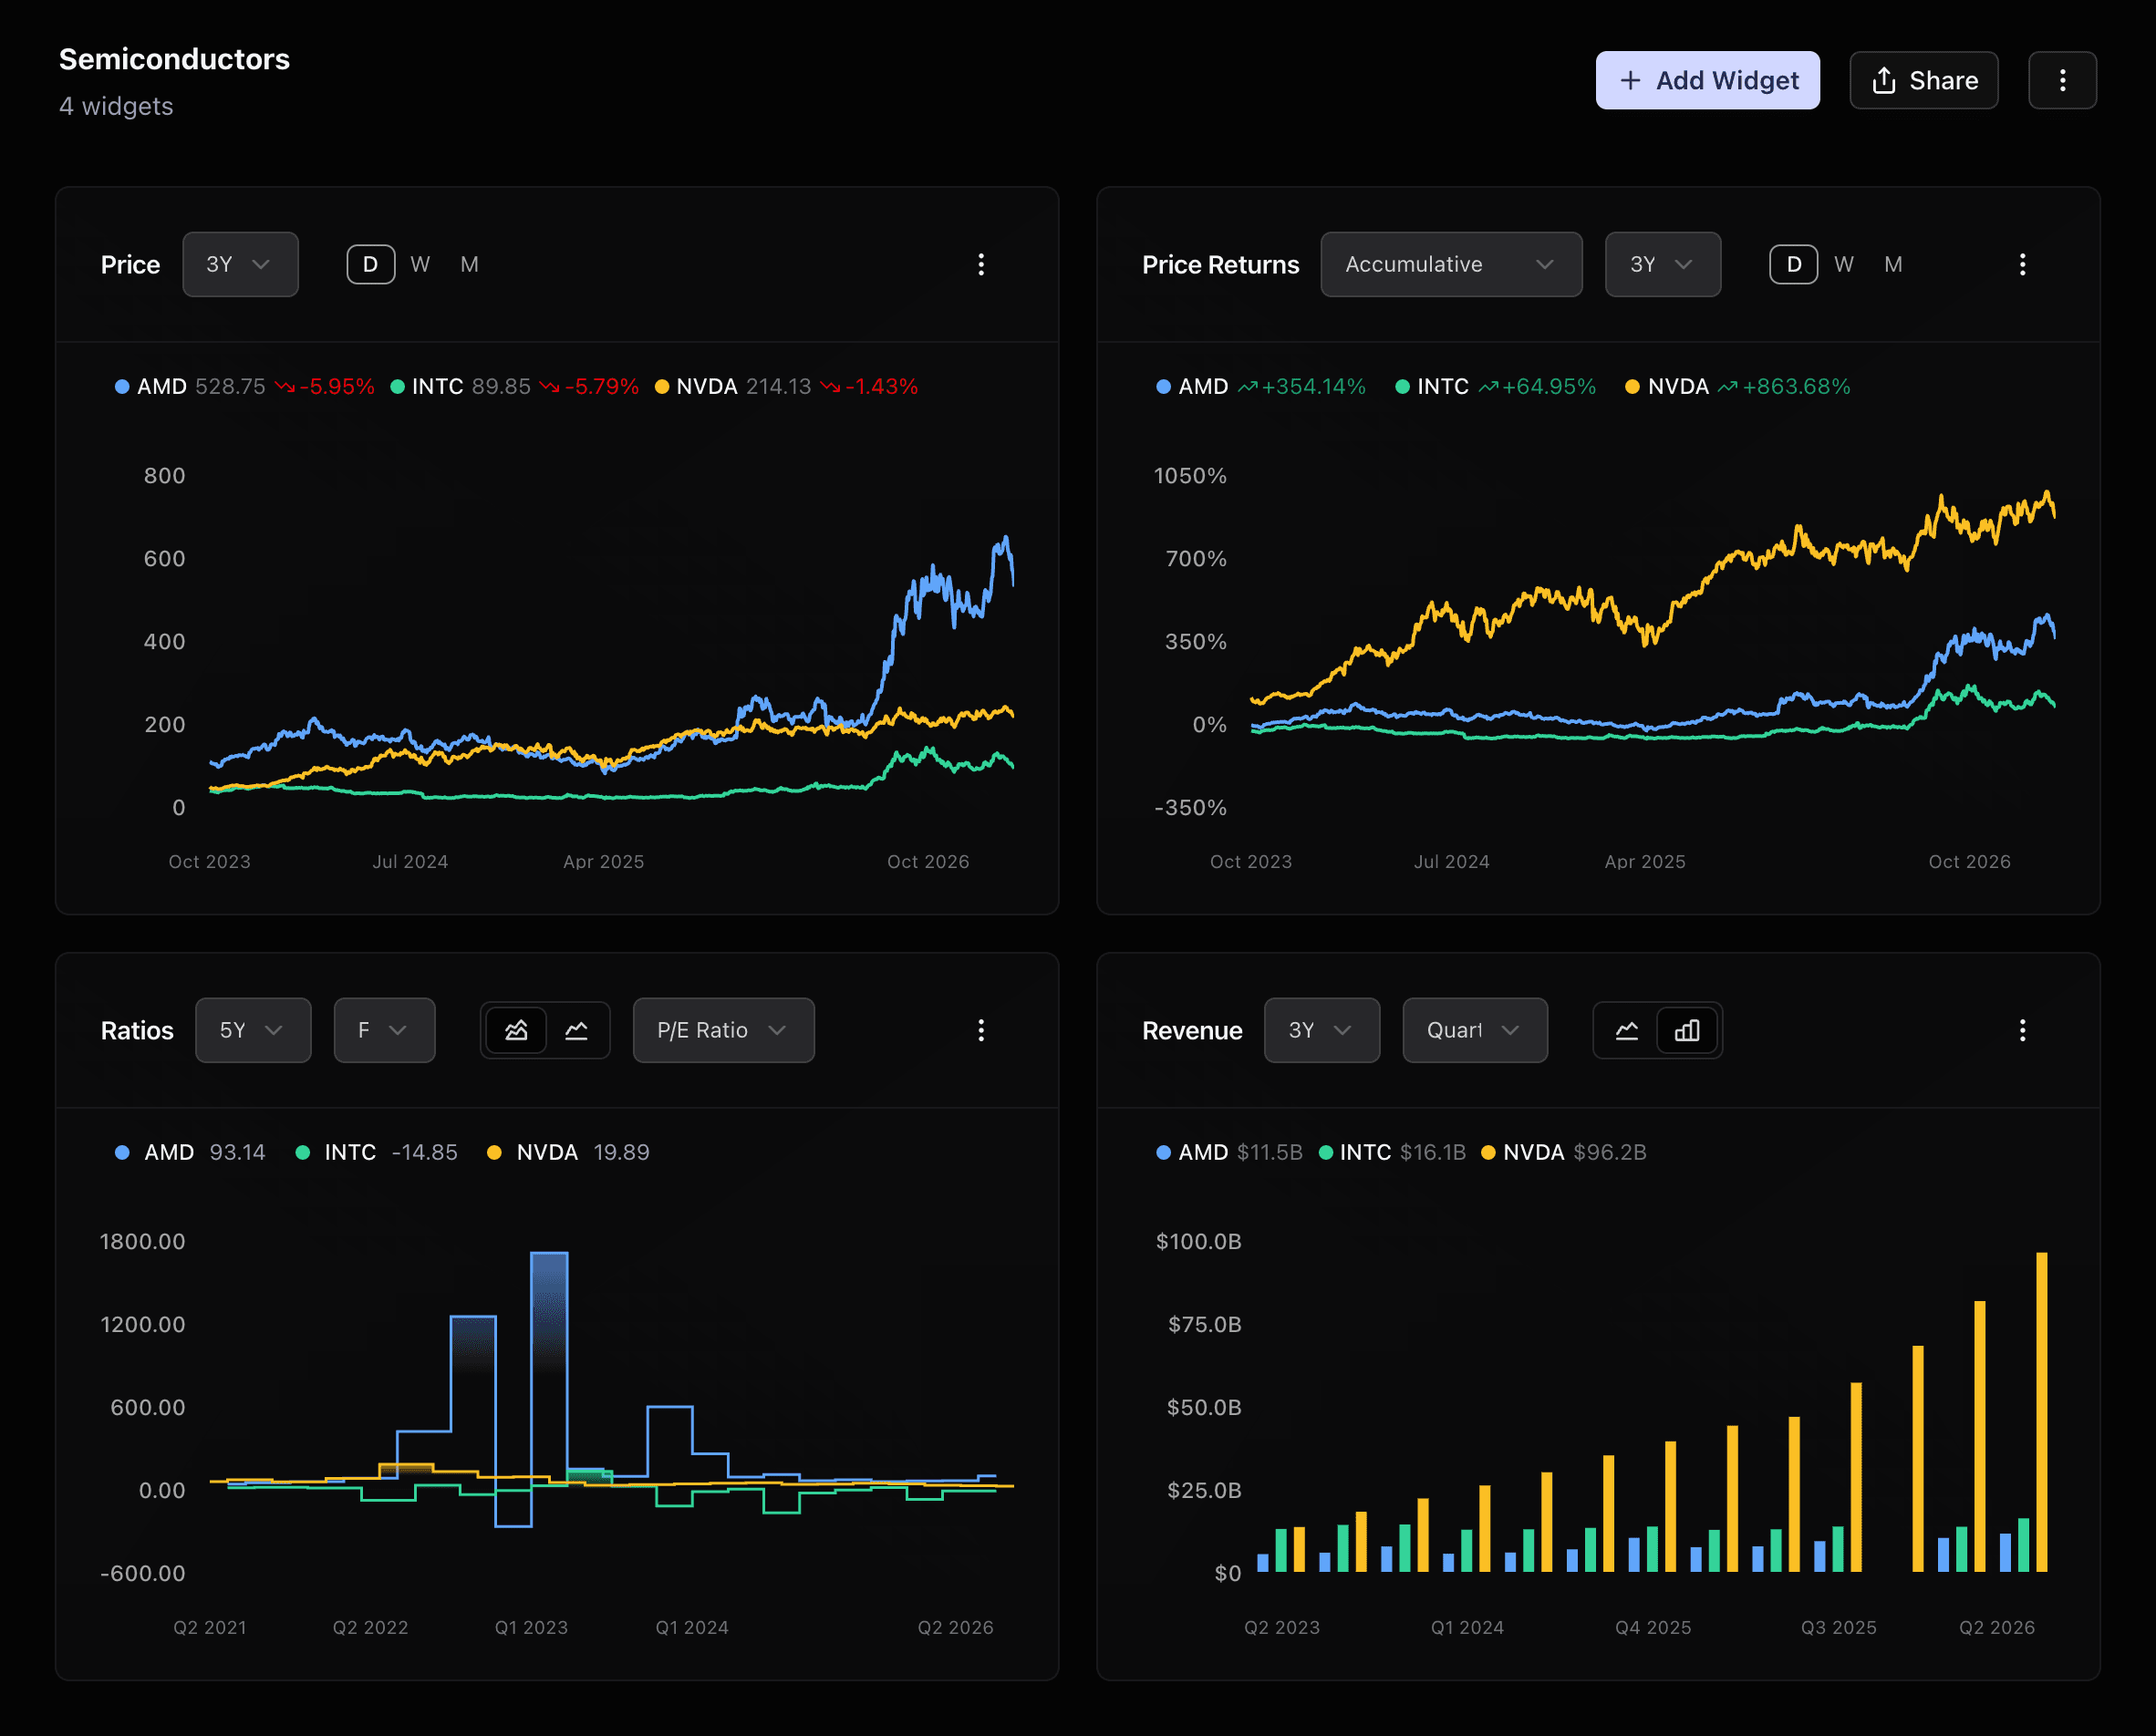
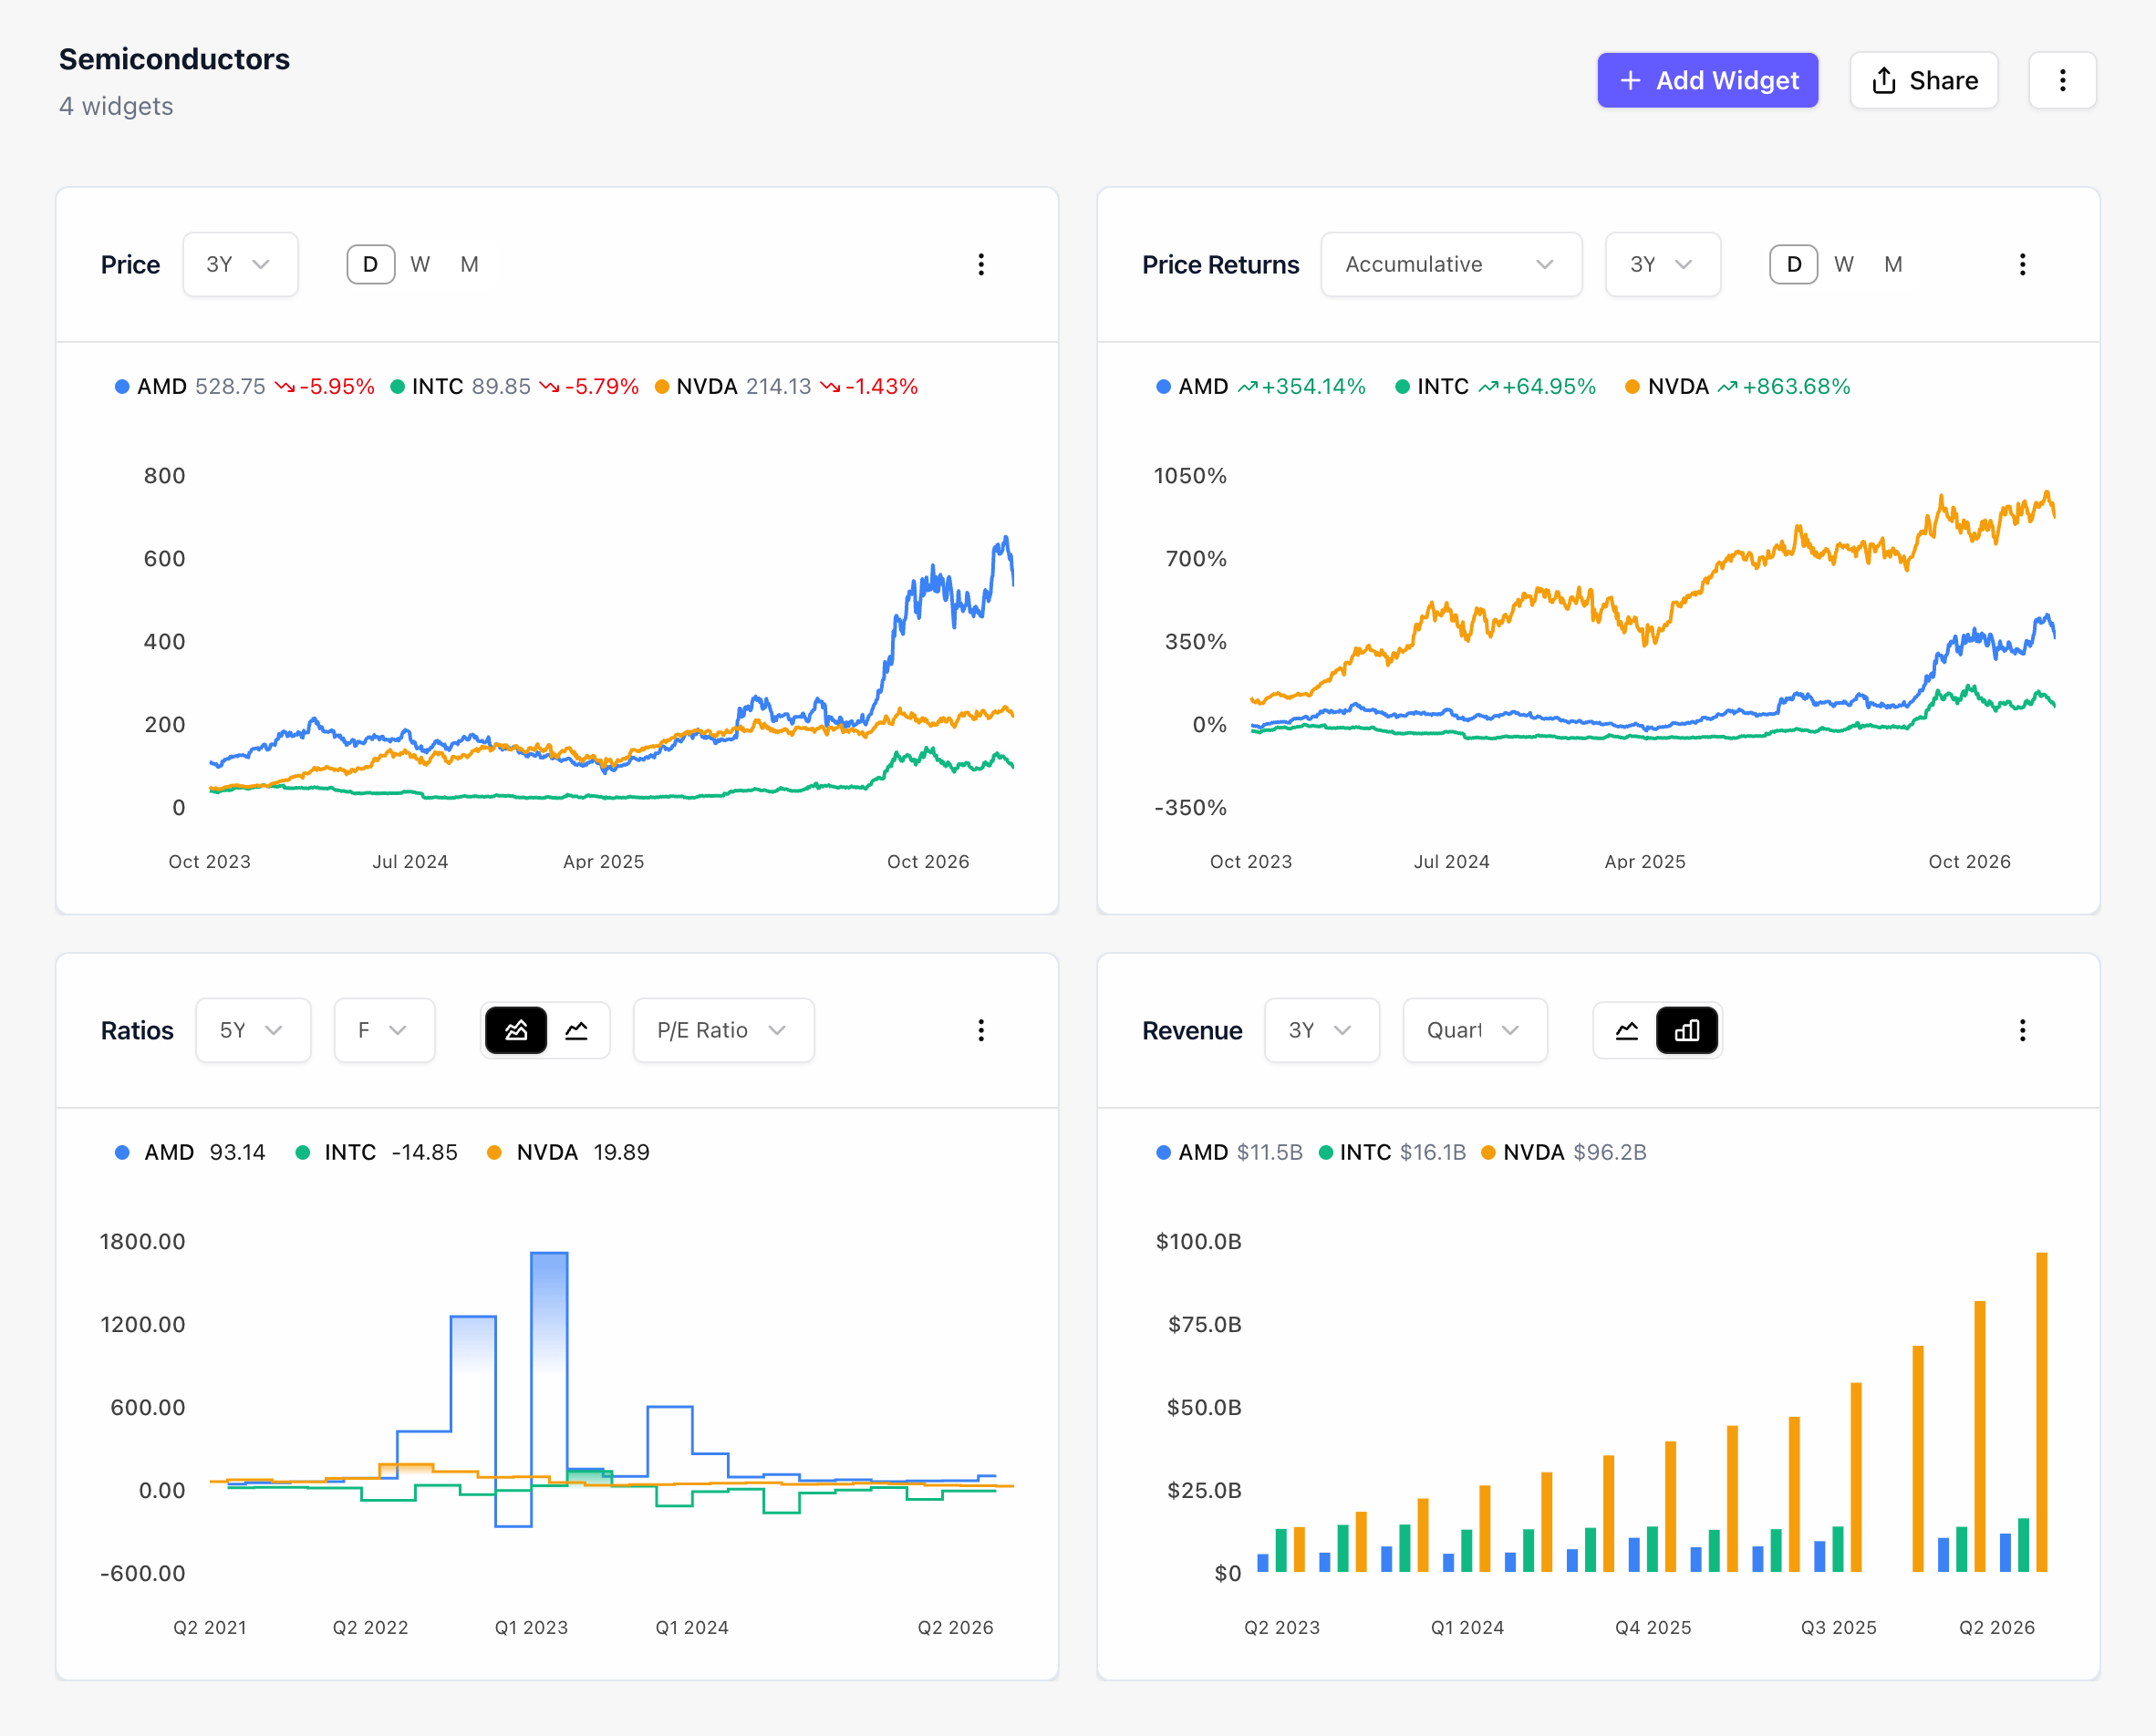
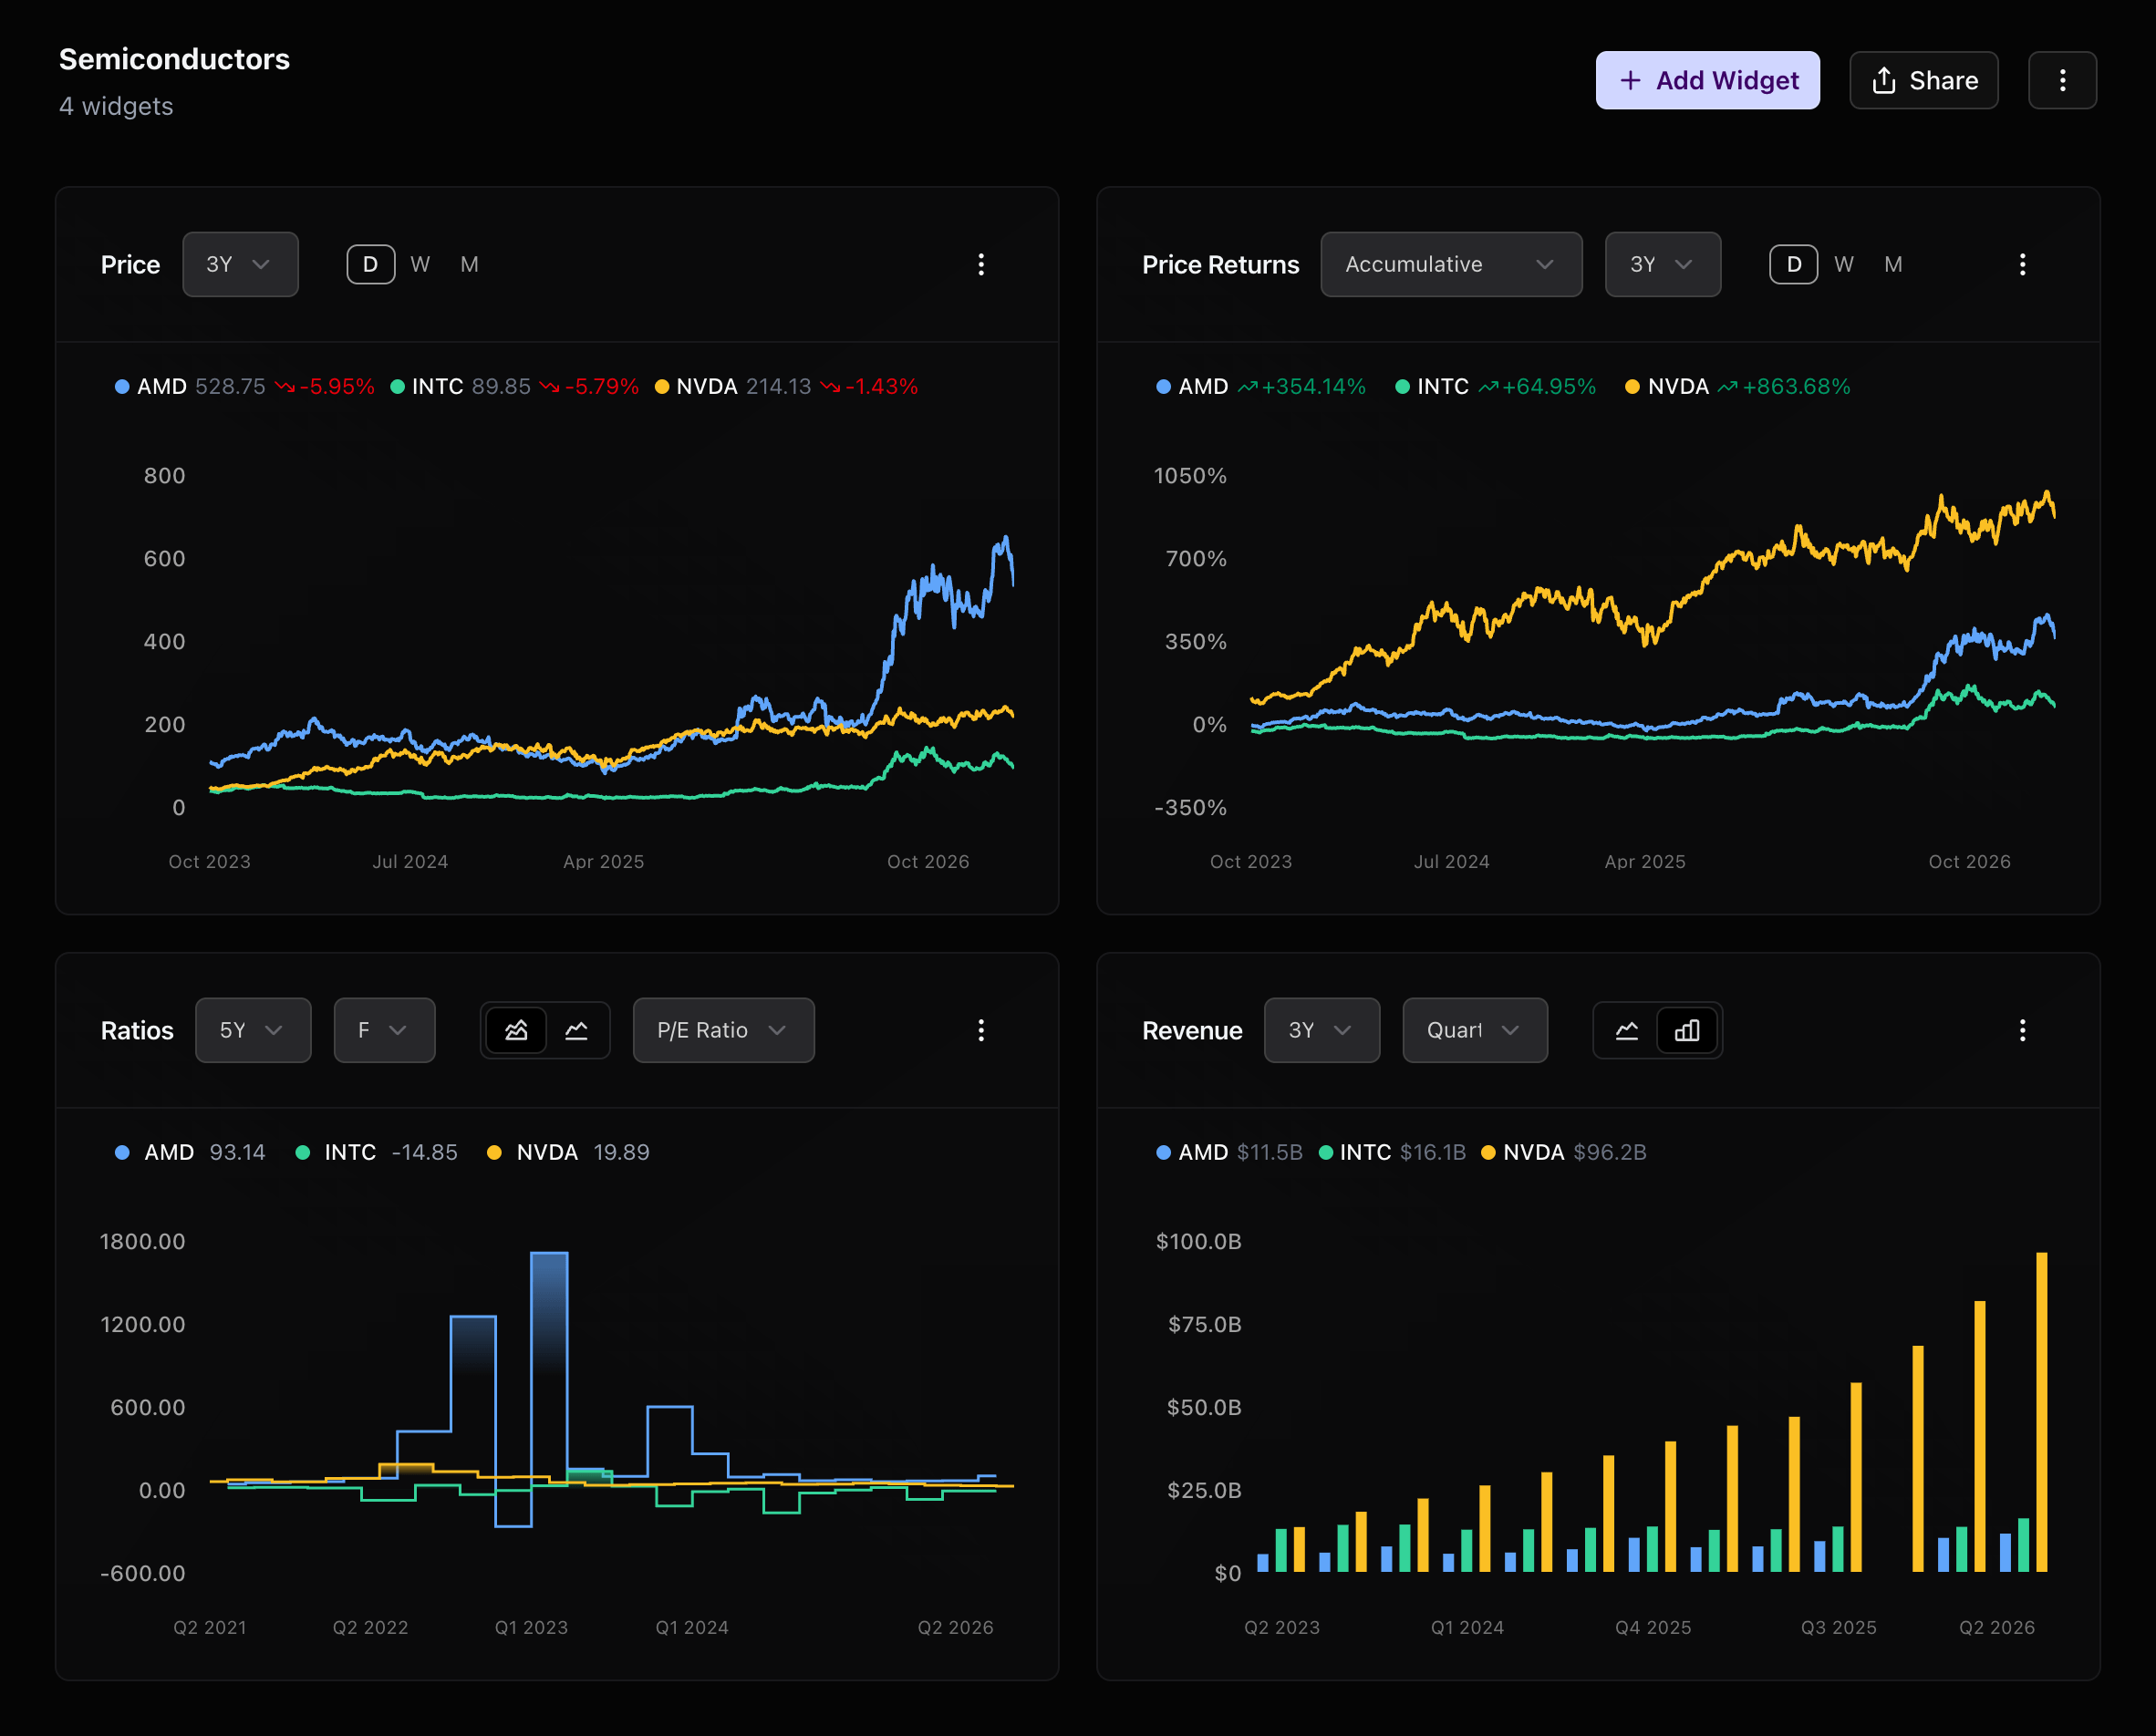
Investment Dashboard
Your entire market in a single glance — watchlists, holdings and movers updating live in one command center.
Journal
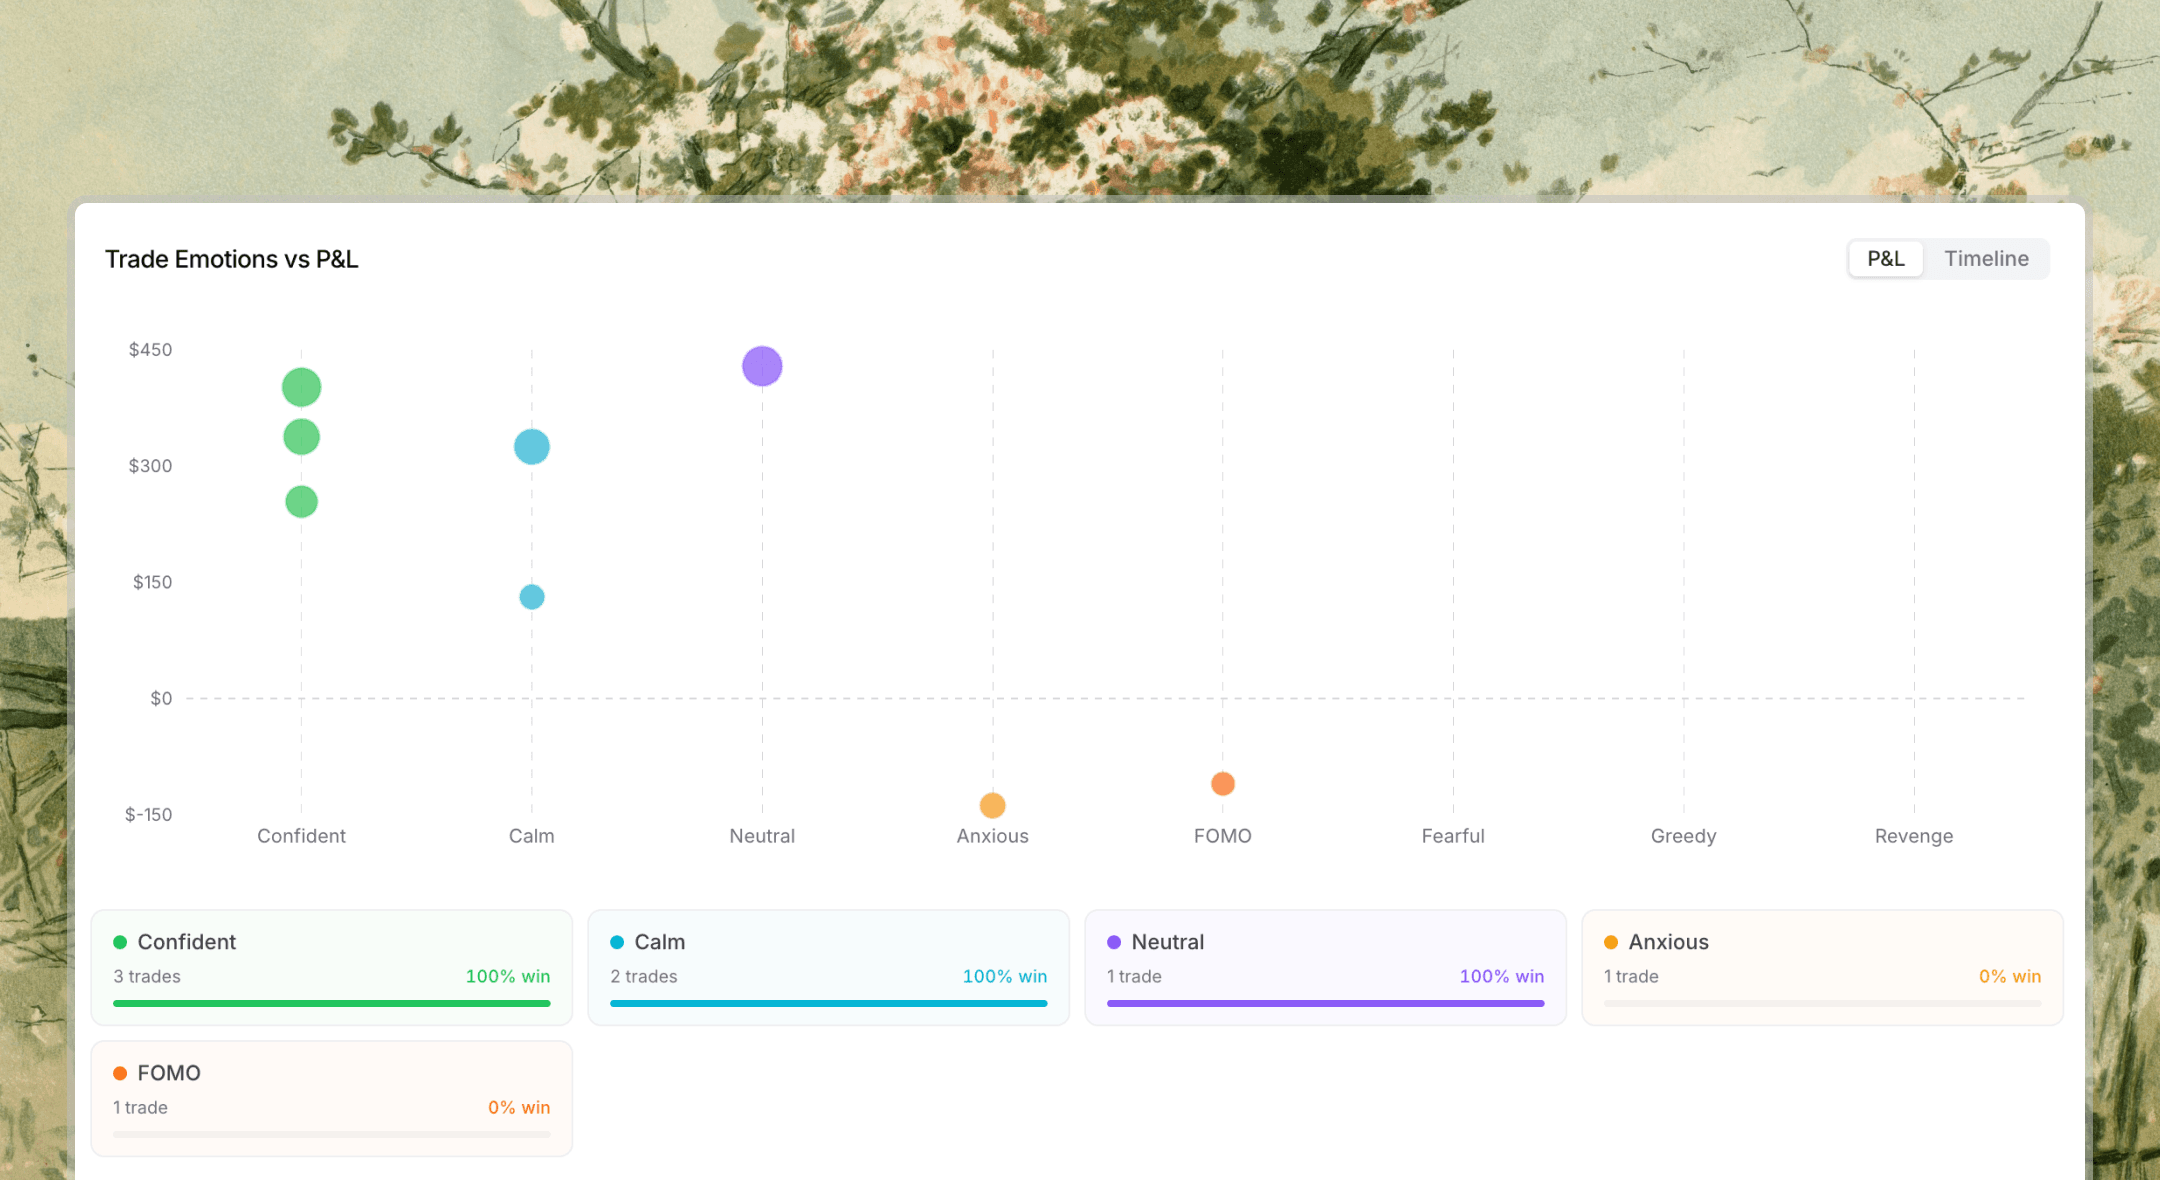
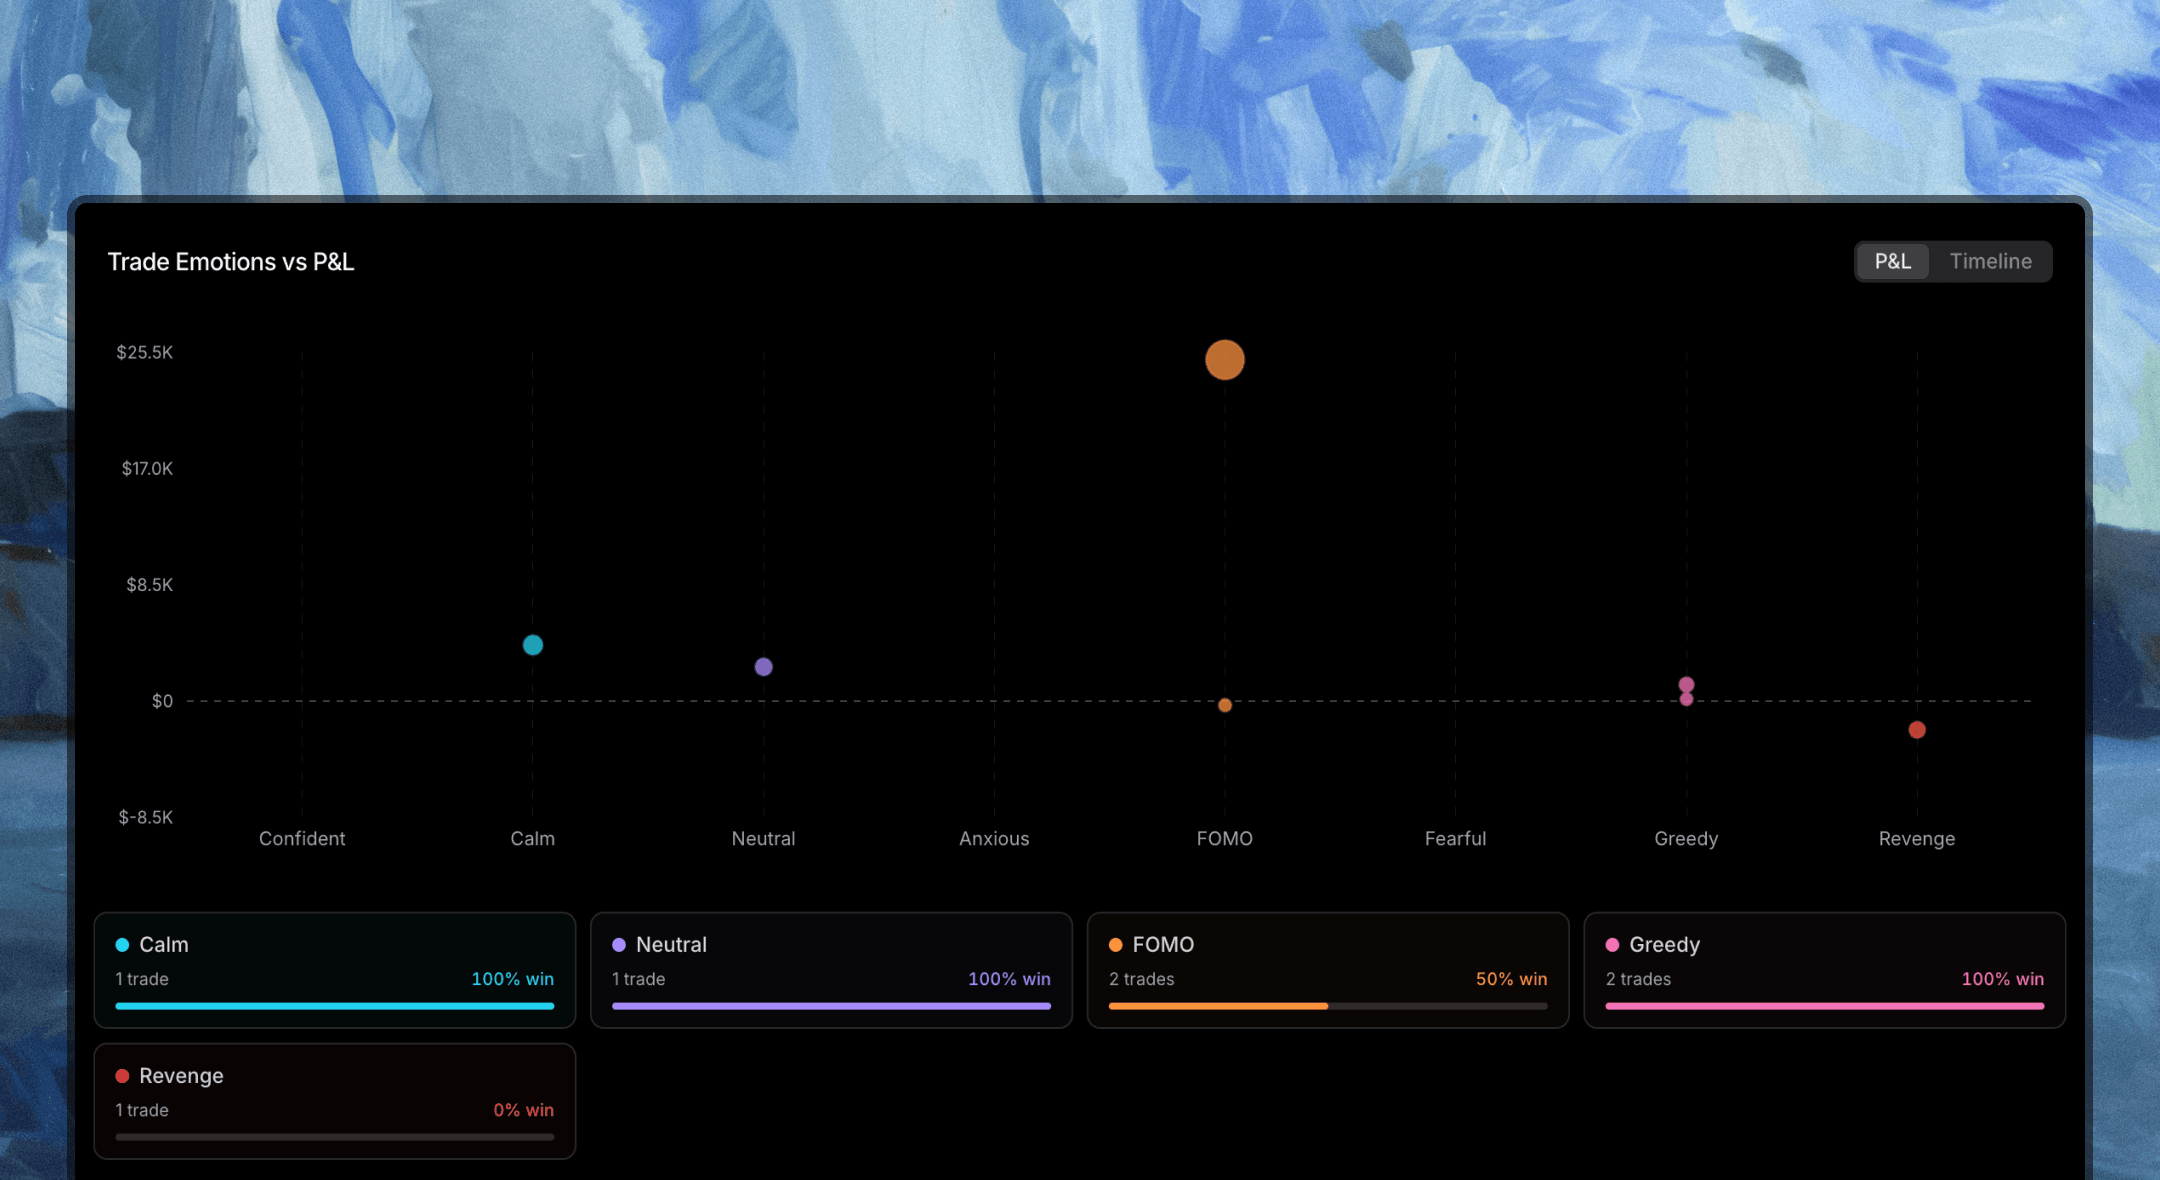
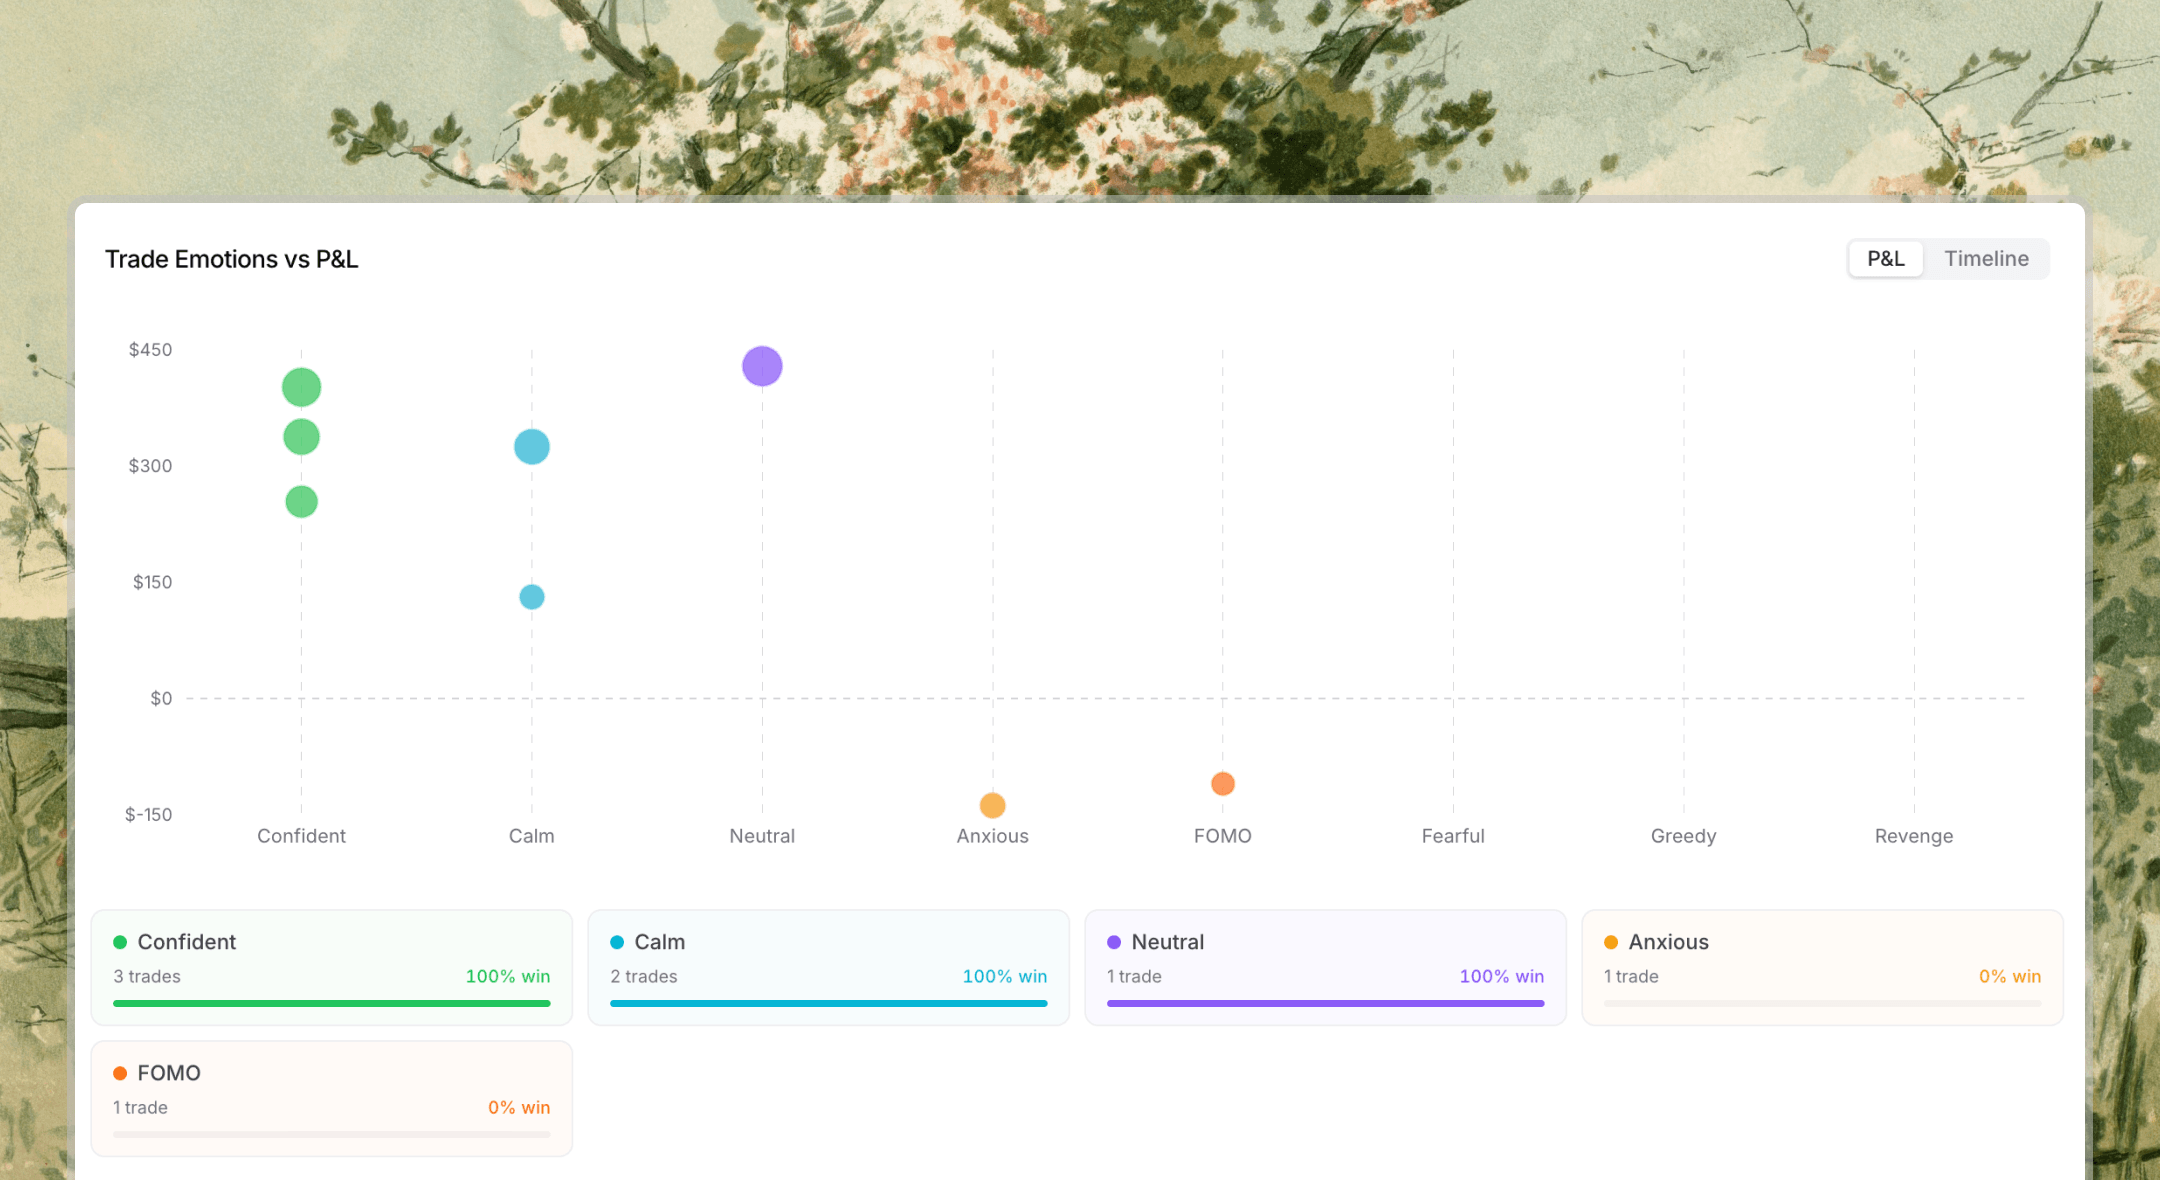
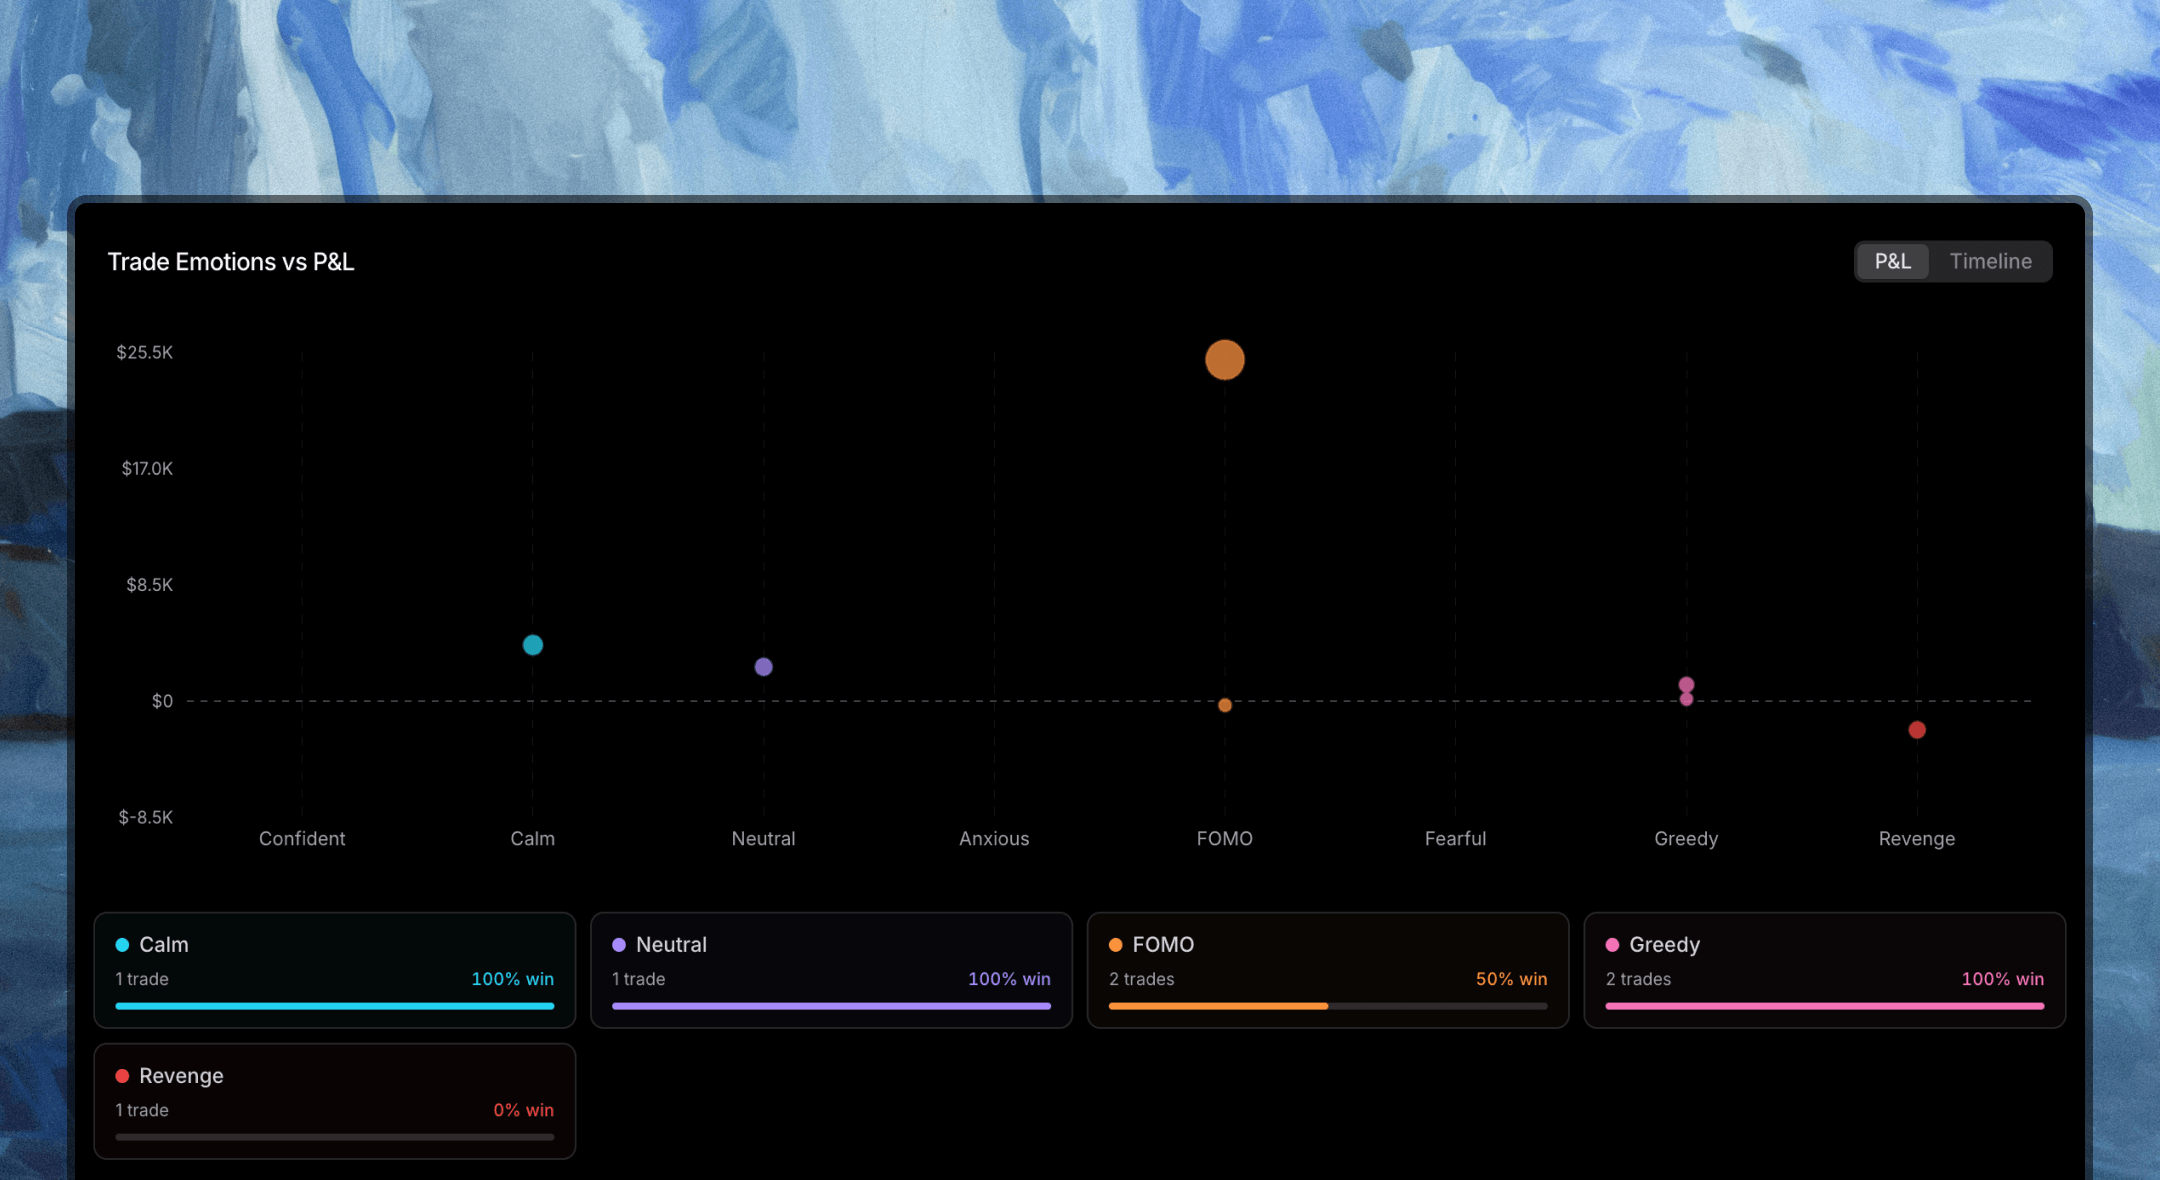
Log every trade, tag the emotion and mistake behind it, and let analytics reveal what actually makes you money.

For AI agents. Machine-readable maps of Amsflow. Fetch these before guessing features, comparisons, or prices. llms.txt · llms.md · feature.md · comparison.md · pricing.md
Amsflow is for research and educational purposes only. Not financial advice. Amsflow doesn't recommend specific investments or securities. Market participation involves substantial risk, including potential loss of principal. Past performance doesn't guarantee future results. Amsflow doesn't offer fund/portfolio management services in any jurisdiction. Amsflow is a data platform only. Amsflow doesn't provide investment tips. Be cautious of imposters claiming to be Amsflow.
Certain Amsflow features, such as strategies and backtesting, simulate performance on historical data. Simulated results have limitations: they don't represent actual trading or future performance, are designed with the benefit of hindsight, and may not reflect market factors such as liquidity. No representation is made that any account will achieve similar results. Simulated performance from the strategy builder or backtesting doesn't guarantee future results.Strategies and backtests generated with our AI tools, including Flow Agent, come from criteria and inputs you control and are for informational and educational purposes only, not financial advice.
Best Financial Analysis Platforms, Best SP Capital IQ Pro Alternatives, Best Bloomberg Terminal Alternatives, Best YCharts Alternatives, Best Koyfin Alternatives, Best Seeking Alpha Alternatives, Best Stock Screeners, Best GuruFocus Alternatives, Best Simply Wall St Alternatives, Best FactSet Alternatives, Best TipRanks Alternatives, Best MarketBeat Alternatives, Best Zacks Alternatives, Best TIKR Alternatives, Best Stock Rover Alternatives, Best Finviz Alternatives, Market Hours.
NASDAQ 100, S&P 500, SPY, QQQ, XLF, VTI, VTSAX, IBIT, FBTC, GBTC, VOO, IWM, Dow 30, Nikkei 225, EURO STOXX 50, SSE Composite, NIFTY 50, Tadawul All Share, FTSE 100, DAX, KOSPI 200, Straits Times Index, Nikkei 300, KOSPI Composite, CAC 40, AEX Index, FTSE MIB Index, S&P/ASX 50, S&P/ASX 200, Gold, Silver, Metaplanet, MSTR, Bitcoin, Ethereum, Microsoft, Apple, NVIDIA, JPMorgan, Amazon, Coca-Cola, Alphabet (Google), Meta, Tesla, Visa, Mastercard, Johnson & Johnson, UnitedHealth, PepsiCo, Walmart, General Electric, Caterpillar, Boeing.
Warren Buffett, Bill Ackman, David Tepper, Stanley Druckenmiller, Ray Dalio, Seth Klarman, Howard Marks, Chase Coleman, Philippe Laffont, Stephen Mandel, Andreas Halvorsen, Jim Simons, Ken Griffin, Steve Cohen, Izzy Englander, David Shaw, John Overdeck & David Siegel, Cliff Asness, Daniel Loeb, Carl Icahn, Paul Singer, David Einhorn, Li Lu, Terry Smith, Cathie Wood.
Nancy Pelosi, Ro Khanna, Michael McCaul, Jefferson Shreve, Cleo Fields, Dan Crenshaw, Pete Sessions, Ron Wyden, Mitch McConnell, Tommy Tuberville, Josh Gottheimer, John Hickenlooper, Sheldon Whitehouse, John Boozman, Austin Scott, Brian Mast, Mark Green, John Fetterman.